Several days of significant coastal flooding occurred during the first weekend of November 2021. A powerful storm system developed off the Southeast coast during November's New Moon when tidal ranges are naturally large. At one point the barometric pressure in the low offshore fell to 993 millibars, the same as in a moderate to strong tropical storm. This combination of meteorological and astronomical factors created the fourth highest tide on record at Wrightsville Beach, NC and the seventh highest at Myrtle Beach, SC. This became one of the most significant non-hurricane coastal floods in our local historical record.
|
Infrared satellite animation from November 6 to 8, 2021 of the coastal storm that helped produce significant coastal flooding along the South and North Carolina coastline. |
|
|
Significant flooding began during the morning high tide on November 6 as shown in the following social media posts.
|
Coastal Flooding in Carolina Beach, NC on Nov 6, 2021 |
Coastal Flooding in Carolina Beach, NC on Nov 6, 2021 |
|
|
'Minor' coastal flooding typically occurs several times a year along the Carolina coastline, however the depth and extent of flood waters was much greater during this storm than is typically observed. Severe disruptions to travel occurred on many streets in low lying sections of barrier island communities. Some property damage occurred to vehicles and to first floor structures. On Topsail Island, beach erosion was significant with up to four or five feet of sand carved out of one section of the beach.
Significant flooding continued during the morning high tides on November 7 and 8, establishing a new record for coastal flooding in non-hurricane scenarios at Wrightsville Beach. The following social media posts show some of the local impacts noted on November 7 and 8.
|
|
|
|
|
|
Severe beach erosion occurred on Topsail Island, NC during high tides on November 6 and 7, 2021. The cliff cut into the sand appears to be three to five feet high at this location, with damage noted to wooden walkways leading from the beach homes down to the beach. (photo from Topsail Area Alerts & News Share on Facebook) |
Town officials from Wrightsville Beach and Surf City both reported surf heights of six to eight feet at the height of the storm. Buoys within 40 miles of the coast reported significant wave heights of 14 to 16 feet. The Coastal Data Information Program at the University of California at San Diego created this infographic showing significant and maximum wave heights observed at local buoys during this storm.
Tide Gauge at Wrightsville Beach, NC
|
Astronomical tides versus actual measured water levels at Wrightsville Beach, NC from November 4 through 9, 2021. The maximum observed water level was 7.75 feet MLLW which occurred at 9:12 AM on Saturday Nov 6. The storm surge peaked at 2.67 feet at 1:12 AM EDT on Sunday Nov 7. |
||||||||||||||||||
|
Tide Gauge at Myrtle Beach, SC
|
Astronomical tides versus actual measured water levels at Myrtle Beach, SC from November 4 through 9, 2021. The maximum observed water level was 8.29 feet MLLW which occurred at 9:24 AM on Saturday Nov 6. The storm surge peaked at 2.12 feet at 11:12 AM EDT on Saturday Nov 6. |
||||||||||||||||||
|
Very strong winds developed in association with the offshore storm. Wind gusts of 50 to 70 miles hour were measured at the weather buoys off the South and North Carolina coastline. At Frying Pan Tower, a privately owned former Coast Guard Station off Cape Fear, a wind gust of 83 mph was recorded at an elevation of 85 feet above the ocean surface. Along the coast of the Carolinas, wind gusts of 40 to 45 mph were recorded at a number of piers and coastal weather stations. The strongest winds occurred during the evening of November 6 into the early morning of November 7.
|
Model analyzed wind gusts Saturday and Sunday November 6-7, 2021 |
|
Climate Change and Sea Level Rise
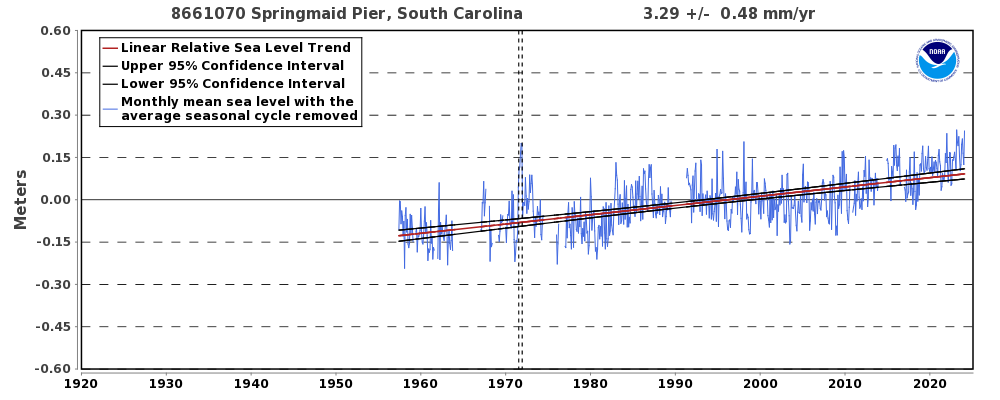
Another factor which played a role in November's coastal flooding is sea level rise due to climate change. Water level data collected since the late 1950s in Myrtle Beach, SC shows a steadily increasing trend in average sea level. In Myrtle Beach, sea level rise averages 0.16 inches each year and has totaled 9.4 inches since the tide gauge was installed. Official projections through the end of the century show that sea level will continue to rise -- perhaps even at a faster rate than has been observed over the past 60 years. This will make it easier for future storms to cause damaging coastal floods.
|
Observed sea level rise in Myrtle Beach, SC since the late 1950s. Additional data is available at https://tidesandcurrents.noaa.gov/sltrends/sltrends.html |
Local sea level rise projections from the U.S. Global Change Research Program's 2018 report |
Additional Links
Research and Page Author: Tim Armstrong
Last Updated: Nov 12, 2021


 Coastal Flood