|
Click here for a review of surface weather maps. |
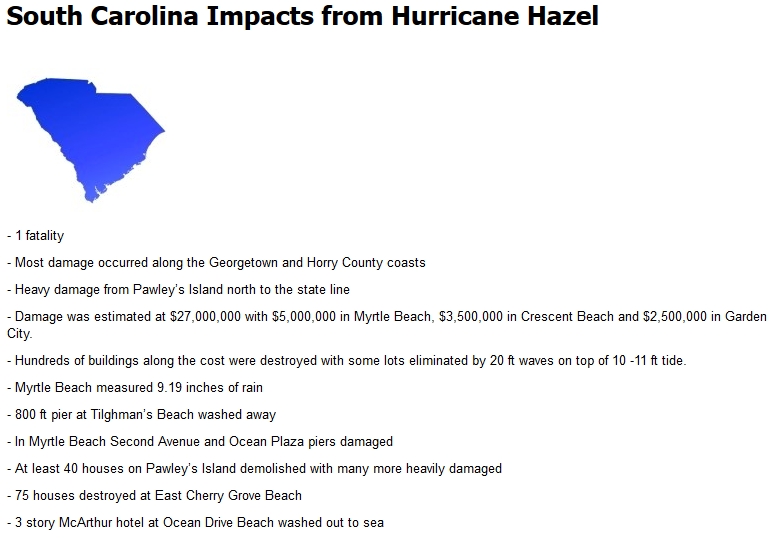
With an estimated loss of 1,200 lives and $381 million in damages, Hurricane Hazel was the deadliest and costliest storm of the 1954 hurricane season. Because of the storm's rapid movement, it traveled northward through the United States to areas that were not prepared for such an event. Besides the violent winds, much of the damage was caused by heavy rains, which in some areas fell at a rate of 12 inches in less than 24 hours. Of the estimated $281 million in damages caused by Hazel in the United States, more than half occurred in the Carolinas ($136 million in North Carolina and $38 million in South Carolina).
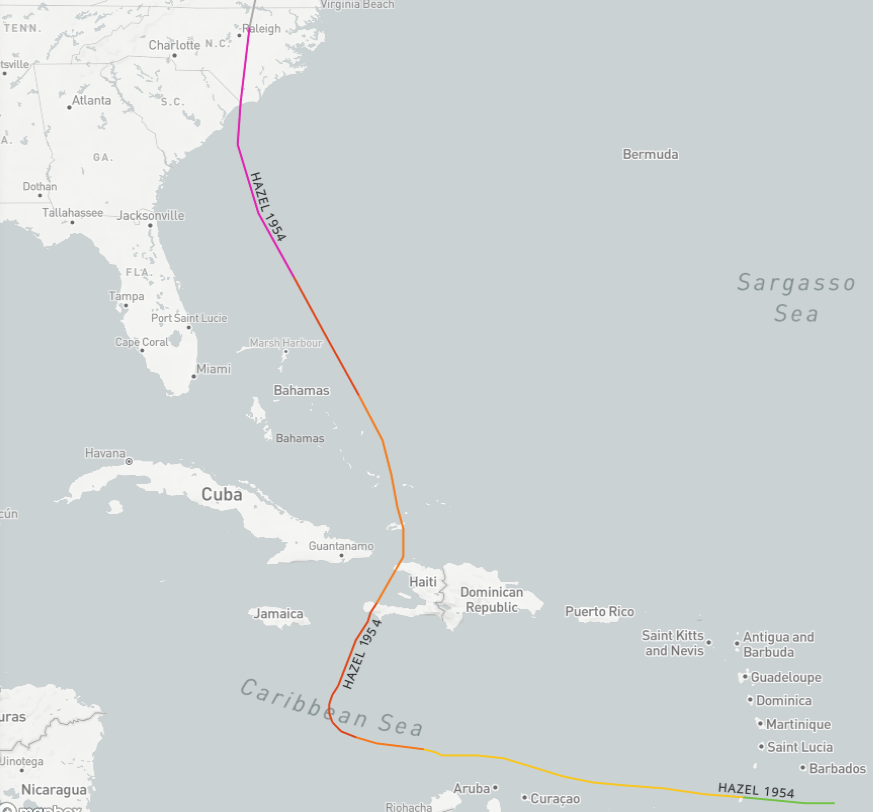
The storm made landfall near the North Carolina-South Carolina border as a Category 4 hurricane and brought with it an 18 foot storm surge and powerful winds. The coastlines of Horry County, South Carolina and Brunswick County, North Carolina received the brunt of Hazel's force and were subject to extreme flooding and wind damage. The official report from the Weather Bureau in Raleigh, North Carolina, stated that as a result of Hazel, "all traces of civilization on the immediate waterfront between the state line and Cape Fear were practically annihilated." Similar impacts were felt along the shoreline between Cape Fear and the Outer Banks. Damage was not limited to the coast. Because Hazel was travelling at a forward speed of 55 miles per hour, it maintained its strength as it moved inland, causing severe damage.
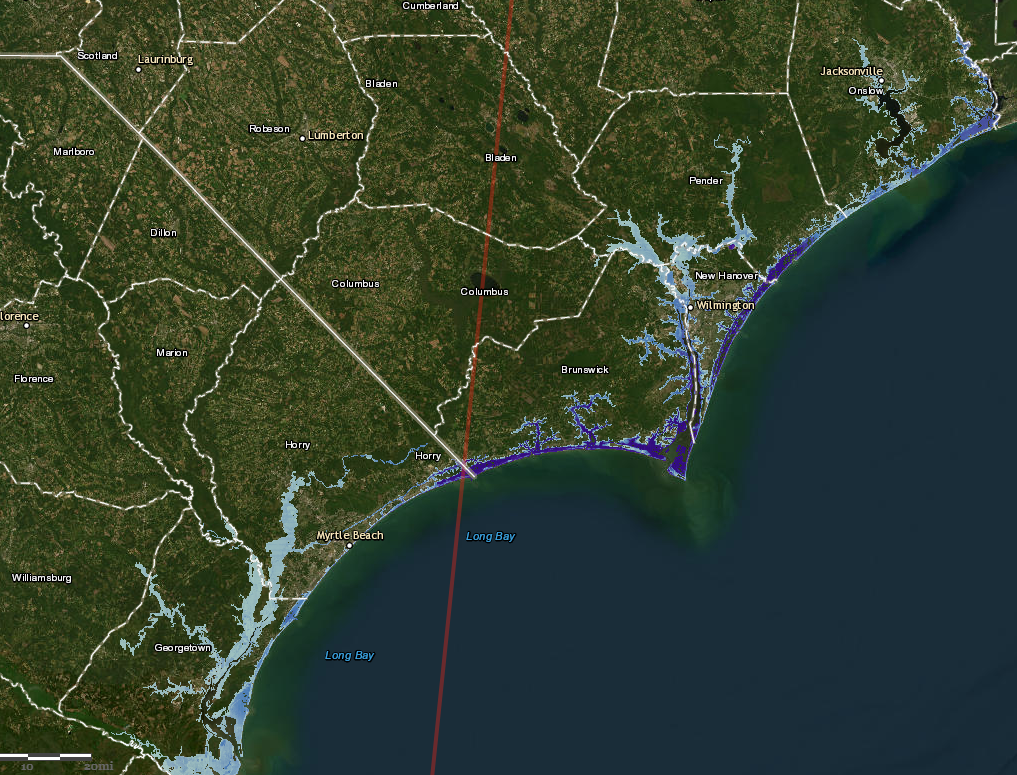
The damage inflicted by Hazel was made worse by the timing of the hurricane strike. Landfall coincided with the full moon of October, the highest lunar tide of the year, resulting in intensified storm surges. Surges of over 12 feet inundated a large area of coastline and reached as high as 18 feet at Calabash, North Carolina, producing severe coastal damage. The map shows the effects of Hazel’s storm surge on today’s landscape. The Sea, Lake, and Overland Surges from Hurricanes (SLOSH) model used current topography with the known parameters of the 1954 storm. Darker blues indicate greater inundation depth while lighter blues indicate less inundation.


 Coastal Flood
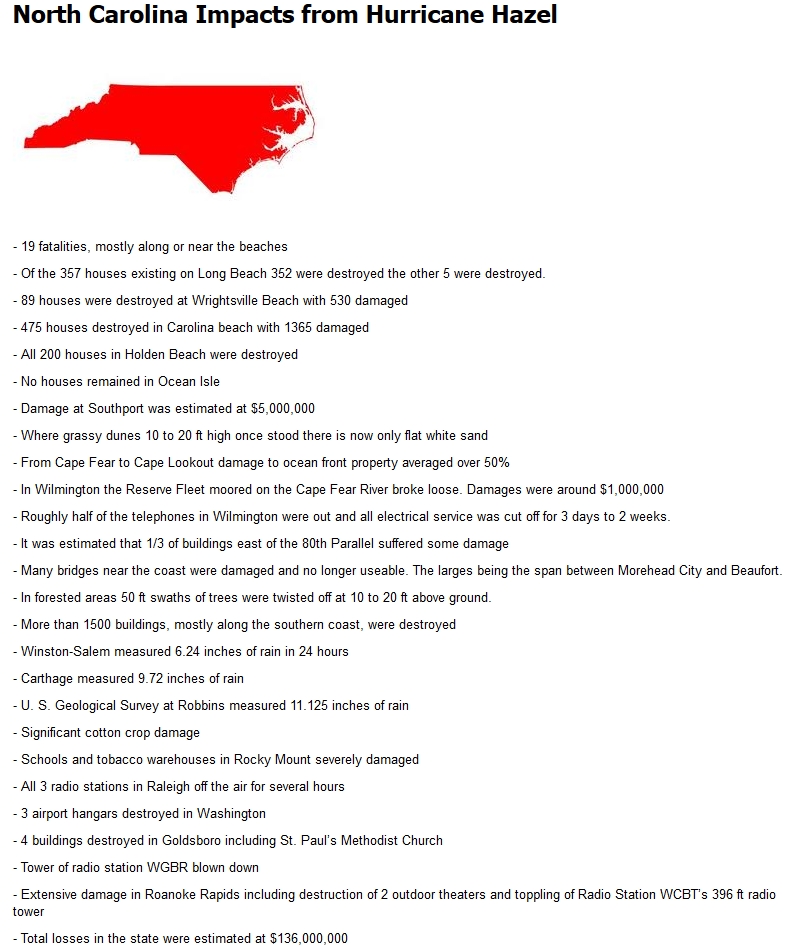