|
Hurricane Ian Brought Storm Surge Flooding in Late September Below-normal Rainfall and Drought Gripped the Carolinas Most of the Year Tied with 2021 for the Fifth Warmest Year in Wilmington Since 1875 |
January
|
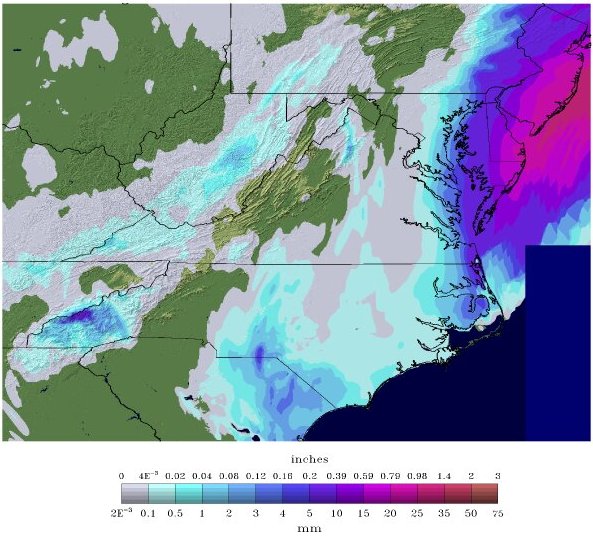
Radar loop from the morning of January 3, 2022 as a line of showers and storms produced strong winds |
The year got off to an extremely warm start with high temperatures on January 1 reaching 81 degrees in Lumberton, NC and 82 in Florence, SC. This was almost 25 degrees above normal and set a new daily record high for Lumberton. High pressure off the Southeast coast pulled a tropical airmass from the Caribbean northward across the Carolinas and well above normal temperatures continued up through the morning of January 3 when a cold front arrived. A line of quick-moving showers and thunderstorms along the front produced widespread damaging wind gusts. A number of trees were blown down across South Carolina's Pee Dee region into southeastern North Carolina. Observed wind gusts included 52 mph in Elizabethtown, 55 mph at North Myrtle Beach, and 60 mph in both Florence and Lumberton.
Low pressure developed along the Gulf Coast on January 15, and moved northeastward across the Carolinas on January 16. This system dropped widespread rain, especially along the coast where rainfall totals reached 2.06 inches in Wilmington and 2.50 inches at North Myrtle Beach.
An arctic cold front moved across the Carolinas on January 20, then stalled offshore the next day. A wave of low pressure that developed on the front pushed moisture back over the arctic air in place, leading to several inches of snow inland with up to one-third of an inch of ice near the coast. Snowfall totals 3-5 inches fell west of Interstate 95, making this the most substantial snowstorm in 20 years in Florence, SC. Arctic air lingering after the snow led to some of the coldest temperatures seen in years. Florence recorded a low of 18 degrees, and it fell to 15 in Lumberton, NC -- the coldest there since January 2018.
Not to be outdone, another arctic airmass pushed across the Carolinas on January 28-29. Enough moisture remained behind the front to produce another measurable snowfall, this time all the way down to the beaches. Snowfall totals ranged from around half an inch in Wilmington and Myrtle Beach to 3 inches in Florence. This was the first measurable snow in Myrtle Beach since 2014. Cold temperatures also lingered after this system: Wilmington's low of 19 degrees on the morning of January 30 was the coldest observed since 2019.
|
Snowfall accumulation map from January 28-29, 2022 |
Snow photo from Conway, SC taken by Angie Turner-Sellers. Additional photos from this snow event are available at https://www.weather.gov/ilm/2022Jan29snow |
February
While temperatures in January averaged 2 to 3 degrees below normal, the weather pattern flipped in February and temperatures averaged 3 to 4 degrees above normal. Only a couple of systems brought substantial rain to the area and monthly rainfall totals were one to two inches below normal.
The most significant weather event in February began to develop as high pressure moved off the coast on February 21. Warm air brought north from Florida led to several days of well above normal temperatures across the Carolinas. Three consecutive days, February 23-25, featured temperatures in the 80s in Florence, SC. Highs on February 24 and 25 both reached 86 degrees, setting new daily high temperature records and also breaking the record for the all-time warmest temperature observed during any winter season in Florence. Unusual warmth extended down the coast as well, and Wilmington set a new daily high temperature record of 82 degrees on February 23.
March
|
Radar loop from the morning of March 12, 2022 |
Well-above normal temperatures continued throughout most of March with over half of the days during the month seeing high temperatures inland in the 70s or 80s. Compared to 30-year normals, temperatures ran 3 to 4 degrees above normal this month.
Low pressure developed along the Gulf coast on March 11 and moved northeastward across the interior portions of the Carolinas on March 12. As the low strengthened, widespread strong winds developed shortly after daybreak. Near the coast wind gusts were recorded at 50 to 70 mph, with even strongest readings noted at the Frying Pan Tower well offshore. Gusts reached 68 mph at the Wilmington airport, stronger than was seen at any other point in the year including Hurricane Ian.
A line of thunderstorms trailing along a cold front brought another burst of strong winds as it moved across later that same morning. Chilly air behind the departing storm system then brought low temperatures deep into the 20s on the morning of March 13 across many portions of eastern North and South Carolina. This was the final freeze of the spring season in Myrtle Beach. Wilmington's last spring freeze occurred on the morning of March 14. Farther inland, the growing season began on March 28 in both Florence, SC and Lumberton, NC after the final occurrence of freezing temperatures there.
April
A compact area of low pressure moving across the Southeast on April 5 helped develop severe thunderstorms across northeastern South Carolina, blowing down trees in a number of locations from Oats in Darlington County to Cades and Socastee closer to the coast. A weather station in Cherry Grove, SC measured 59 mph, and on Winyah Bay near Georgetown, SC a weather station measured 73 mph.
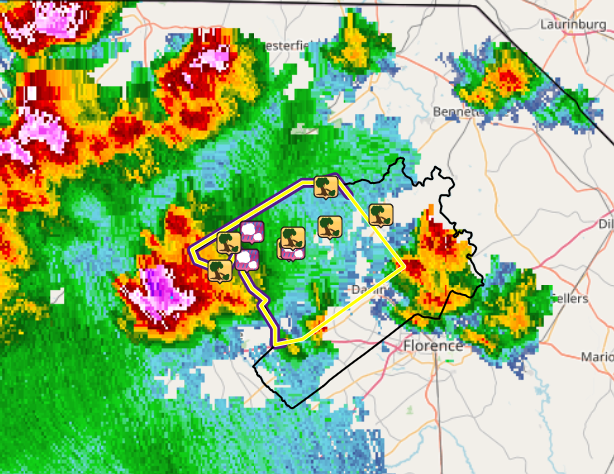
More severe storms occurred on April 7 as a cold front moved across the Carolinas. These storms dropped large hail across Horry County and as far north as Tabor City, NC. Hail up to 2.75 inches (baseball size) was reported near Galivants Ferry in western Horry County, with widespread golf ball and ping pong ball size hail reported in and near Conway, SC.
|
Radar (top) and visible satellite loop (bottom) of severe thunderstorms dropping large hail on April 7, 2022 |
|
Low pressure developed along a stalled front and brought a widespread and soaking rain to the area on April 18. Rainfall amounts ranged from a half to one inch inland to over an inch on the coast. The highest totals included 2.24 inches in Calabash, NC, and 2.31 inches in Southport. This rain was significant as moderate drought which had persisted a good portion of the winter was still ongoing, especially across southeastern North Carolina.
A period of warm weather developed April 22 and lasted through the end of the month. High temperatures were in the 80s most days, including a very warm 89 degrees in Florence on April 26. As the month ended, the National Drought Monitor summary still showed moderate to severe drought covering portions of eastern North and South Carolina.
May
Temperatures soared to 92 in Florence, SC and 93 in Lumberton, NC on May 6 -- the hottest day of the year up to this point. This heat built in behind a warm front that moved just north of the area during the day. Hot, unstable air was lifted by a cold front during the evening hours, yielding scattered severe thunderstorms that dropped 1 inch diameter hail across Clyde and Hartsville, SC. Trees were blown down in a number of locations across Darlington County, and a storm spotter reported a funnel cloud near Maxton in Robeson County, NC.
|
Storm reports (large hail and damaging winds) from May 6, 2022 across Darlington County, SC |
Another outbreak of severe thunderstorms developed during the evening of May 16 along a weak front. Wind gusts estimated near 60 mph near Council, NC blew down trees. Additional reports of downed trees were received from Nakina, NC and Green Sea, SC.
These storms were followed a few days later by inland temperatures in the upper 90s as high pressure built across the area. New daily record high temperatures were set in both Florence and Lumberton on May 19 and 20. The heat was almost as bad down at the coast where temperatures in the mid 90s were recorded in Wilmington on May 19 and 20. Nighttime low temperatures were as impressive as the daytime highs -- Wilmington's low of 77 degrees on May 21 was the warmest nighttime low temperature ever recorded so early in the year.
June
|
June 2022 Florence, SC Climate Data
|
June started off with a heat wave that brought 100 degree temperatures to the area. Lumberton reached 100 degrees on June 1 and 2, the hottest temperatures reported there since 2019. Wilmington recorded a high of 98 degrees on June 2, the hottest observed at any point in 2022. High pressure over the Carolinas was responsible for the hot weather, but as the high weakened widespread thunderstorms developed and dropped significant rainfall including 2.92 inches in Wilmington on June 3 and 2.01 inches in North Myrtle Beach on June 4.
Another heat wave developed during the middle portion of June, but this time the humidity was higher and pushed heat index values up to a sweltering 111 degrees in Wilmington on June 13. That same day the actual air temperature in Florence reached 102 degrees, the hottest temperature recorded all year and the highest measured there since 2019. North Myrtle Beach reached 97 degrees on June 14, also the hottest of the year and the hottest since 2019. Heat Advisories or Excessive Heat Warnings were issued each day June 13 through 17. All this heat pushed Florence's monthly average high temperature for June up to 94 degrees -- almost five degrees above normal and the second hottest average June high temperature since records began in 1948.
This mid-June heatwave, like the early in the month, also ended with thunderstorms. Storms became severe on June 16 and resulted in wind damage across Florence and Darlington counties and a confirmed tornado touchdown just west of Darlington, SC. This tornado had winds estimated at 85 mph and was on the ground for a total of 3.8 miles, damaging trees, buildings, and even a church cemetery between Oats and Timmonsville.
More severe thunderstorms developed on June 17, producing damage across Darlington and Robeson counties including a confirmed tornado touchdown near Tar Heel, NC. Storms spread down to the coast late in the evening with strong winds of 45 mph measured in Holden Beach, 52 mph at Springmaid Pier in Myrtle Beach, and 59 mph at Murrells Inlet, SC.
Dry air pushed southward from Canada behind these thunderstorms and led to very large day-night temperature ranges. Florence set a record low of 56 degrees on the morning of June 20 but still recorded an afternoon high of 91.
July
In a year when many areas dealt with drought and low rainfall totals for most of the year, July was the exception with plentiful rainfall that actually exceeded monthly normals in Wilmington, North Myrtle Beach, and Lumberton.
A tropical depression formed along a low pressure trough just east of Savannah, GA during the afternoon of July 1. The National Hurricane Center says the depression strengthened into Tropical Storm Colin as it made landfall at Hunting Island, just east of Beaufort, SC, during the evening of July 1. The system then moved northeastward along the South Carolina coast while remaining very disorganized.
Colin produced a few wind gusts to tropical storm force along the immediate coast of the Carolinas. Some locally heavy rainfall also occurred in showers, but no flooding reports were received.
|
A very humid airmass remained across the Carolinas behind Colin. As a weak cold front intercepted this moisture on July 4, slow-moving thunderstorms developed and flash flooding was reported along the coast south of Cape Fear. Ocean Boulevard and a portion of 24th Avenue North in North Myrtle Beach were blocked by deep floodwater around noon on July 4. Photos from local media showed vehicles stranded and flood water entering businesses. Flash flooding also developed in Surfside Beach and Garden City, SC later in the afternoon. These thunderstorms were prolific lightning producers and at least three buildings in various parts of Horry County were set ablaze during the afternoon on July 4.
Continued hot and humid weather led to more thunderstorms with heavy rain on July 8. Lumberton recorded its wettest day of the summer on July 8 when 3.36 inches was measured at the airport. More heavy rain developed across the area on July 22 and 23 creating flood problems again in North Myrtle Beach. At the North Myrtle Beach airport 2.93 inches of rain fell on July 22, the second largest daily total measured there in 2022.
After this period of wet weather ended, high temperatures rose into the mid to upper 90s each day from July 27 through the 31st. Wilmington recorded four consecutive nights with low temperatures in the 80s from July 26 through 29, breaking the all-time record for the most consecutive hot nights of three set back in July 1980. North Myrtle Beach also had three consecutive nights with 80+ degree lows July 25-27, tied for the fourth most on record there.
August
August began with hot weather including three days with highs in the upper 90s inland. Severe thunderstorms developed on August 3 and blew down trees in Florence, SC and Maxton, NC. Minor flooding also occurred where storms dropped 1.34 inches at the Florence airport, but nearly two inches fell at volunteer stations in town.
Heat spread down to the coast a week later in advance of a weak cold front when Wilmington hit 98 degrees on August 10 and North Myrtle Beach hit 91 on August 11. Both of these were the hottest temperatures of the month. After this front passed through the area, the area experienced a short break from the summer heat and humidity. Nighttime low temperatures August 13 and 14 were in the mid 60s at the coast and lower 60s inland.
Severe thunderstorms developed on August 15 as a series of upper level disturbances moved across the area. These storms blew down trees across McColl and Wallace, SC. A portion of the roof of the post office in McColl was blown off and trees were blown down along East Gibson Street.
The same upper level weather pattern allowed additional severe thunderstorms to occur August 16, this time affecting areas around Tabor City, NC and Loris, SC. Trees were blown down along Inman Road southeast of Tabor City, and baseball size hail was observed falling near Loris during the evening hours.
An area of low pressure moved across the area on August 19, producing fairly widespread heavy rainfall. Official daily totals reached 2.86 inches in North Myrtle Beach and 3.08 inches in Wilmington, however many volunteer stations recorded much higher totals including 7.08 inches in Surfside Beach, and 7.28 inches in Socastee. Flash flooding was reported in Socastee and in the Forestbrook section of Myrtle Beach.
August is normally when the Atlantic hurricane season begins to really get active. For the first time since 1997 no tropical cyclones formed in the Atlantic during August, likely a consequence of hot, dry, and dusty air blowing off the west coast of Africa suppressing thunderstorms across the tropical Atlantic.
September
Warm and humid air covered the Carolinas for the first week of September. A cold front pushed through on September 8 allowing dry and cool weather to temporarily build overhead. High tides on September 3 associated with the Full Moon led to minor coastal flooding along the beaches, including a measured tide level of 6.83 feet at Wrightsville Beach, NC, almost a foot above flood stage.
|
Astronomical tides (blue) versus observations (green) at Wrightsville Beach, NC September 8-9, 2022 |
As the front moved back onshore September 10, the returning tropical airmass allowed multiple waterspouts to develop along the coast. Spotters reported waterspouts visible from Litchfield Beach, SC and Calabash, NC during the morning hours. While rainfall totals September 10 and 11 averaged from a little over half inch inland to almost two inches on the coast, substantially larger totals occurred across southern New Hanover County, NC (up to 4.43 inches near Halyburton Park) and in Conway, SC (4.40 inches in the Oak Glenn neighborhood).
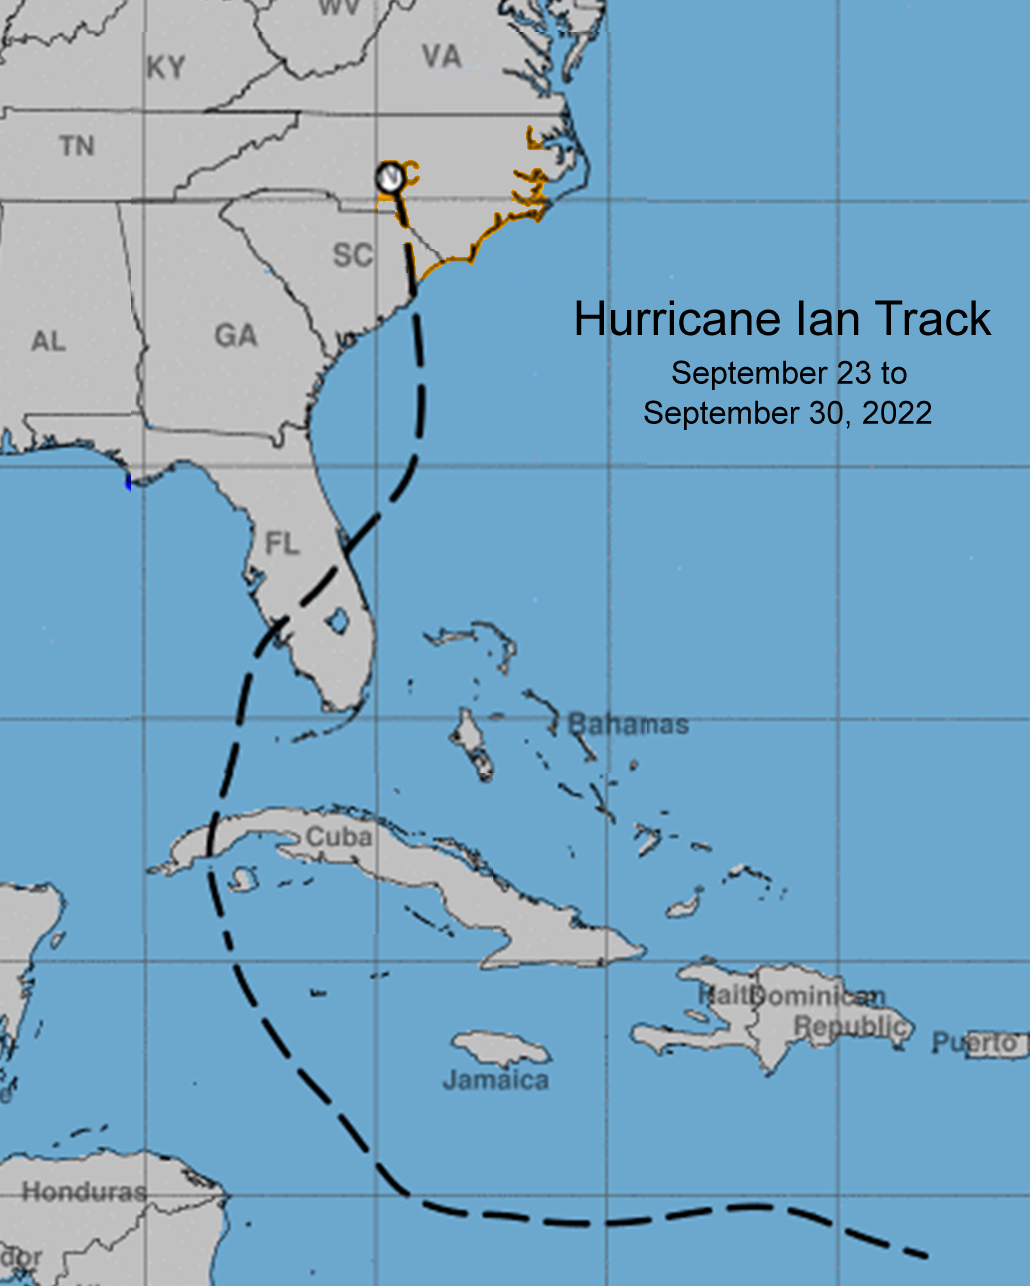
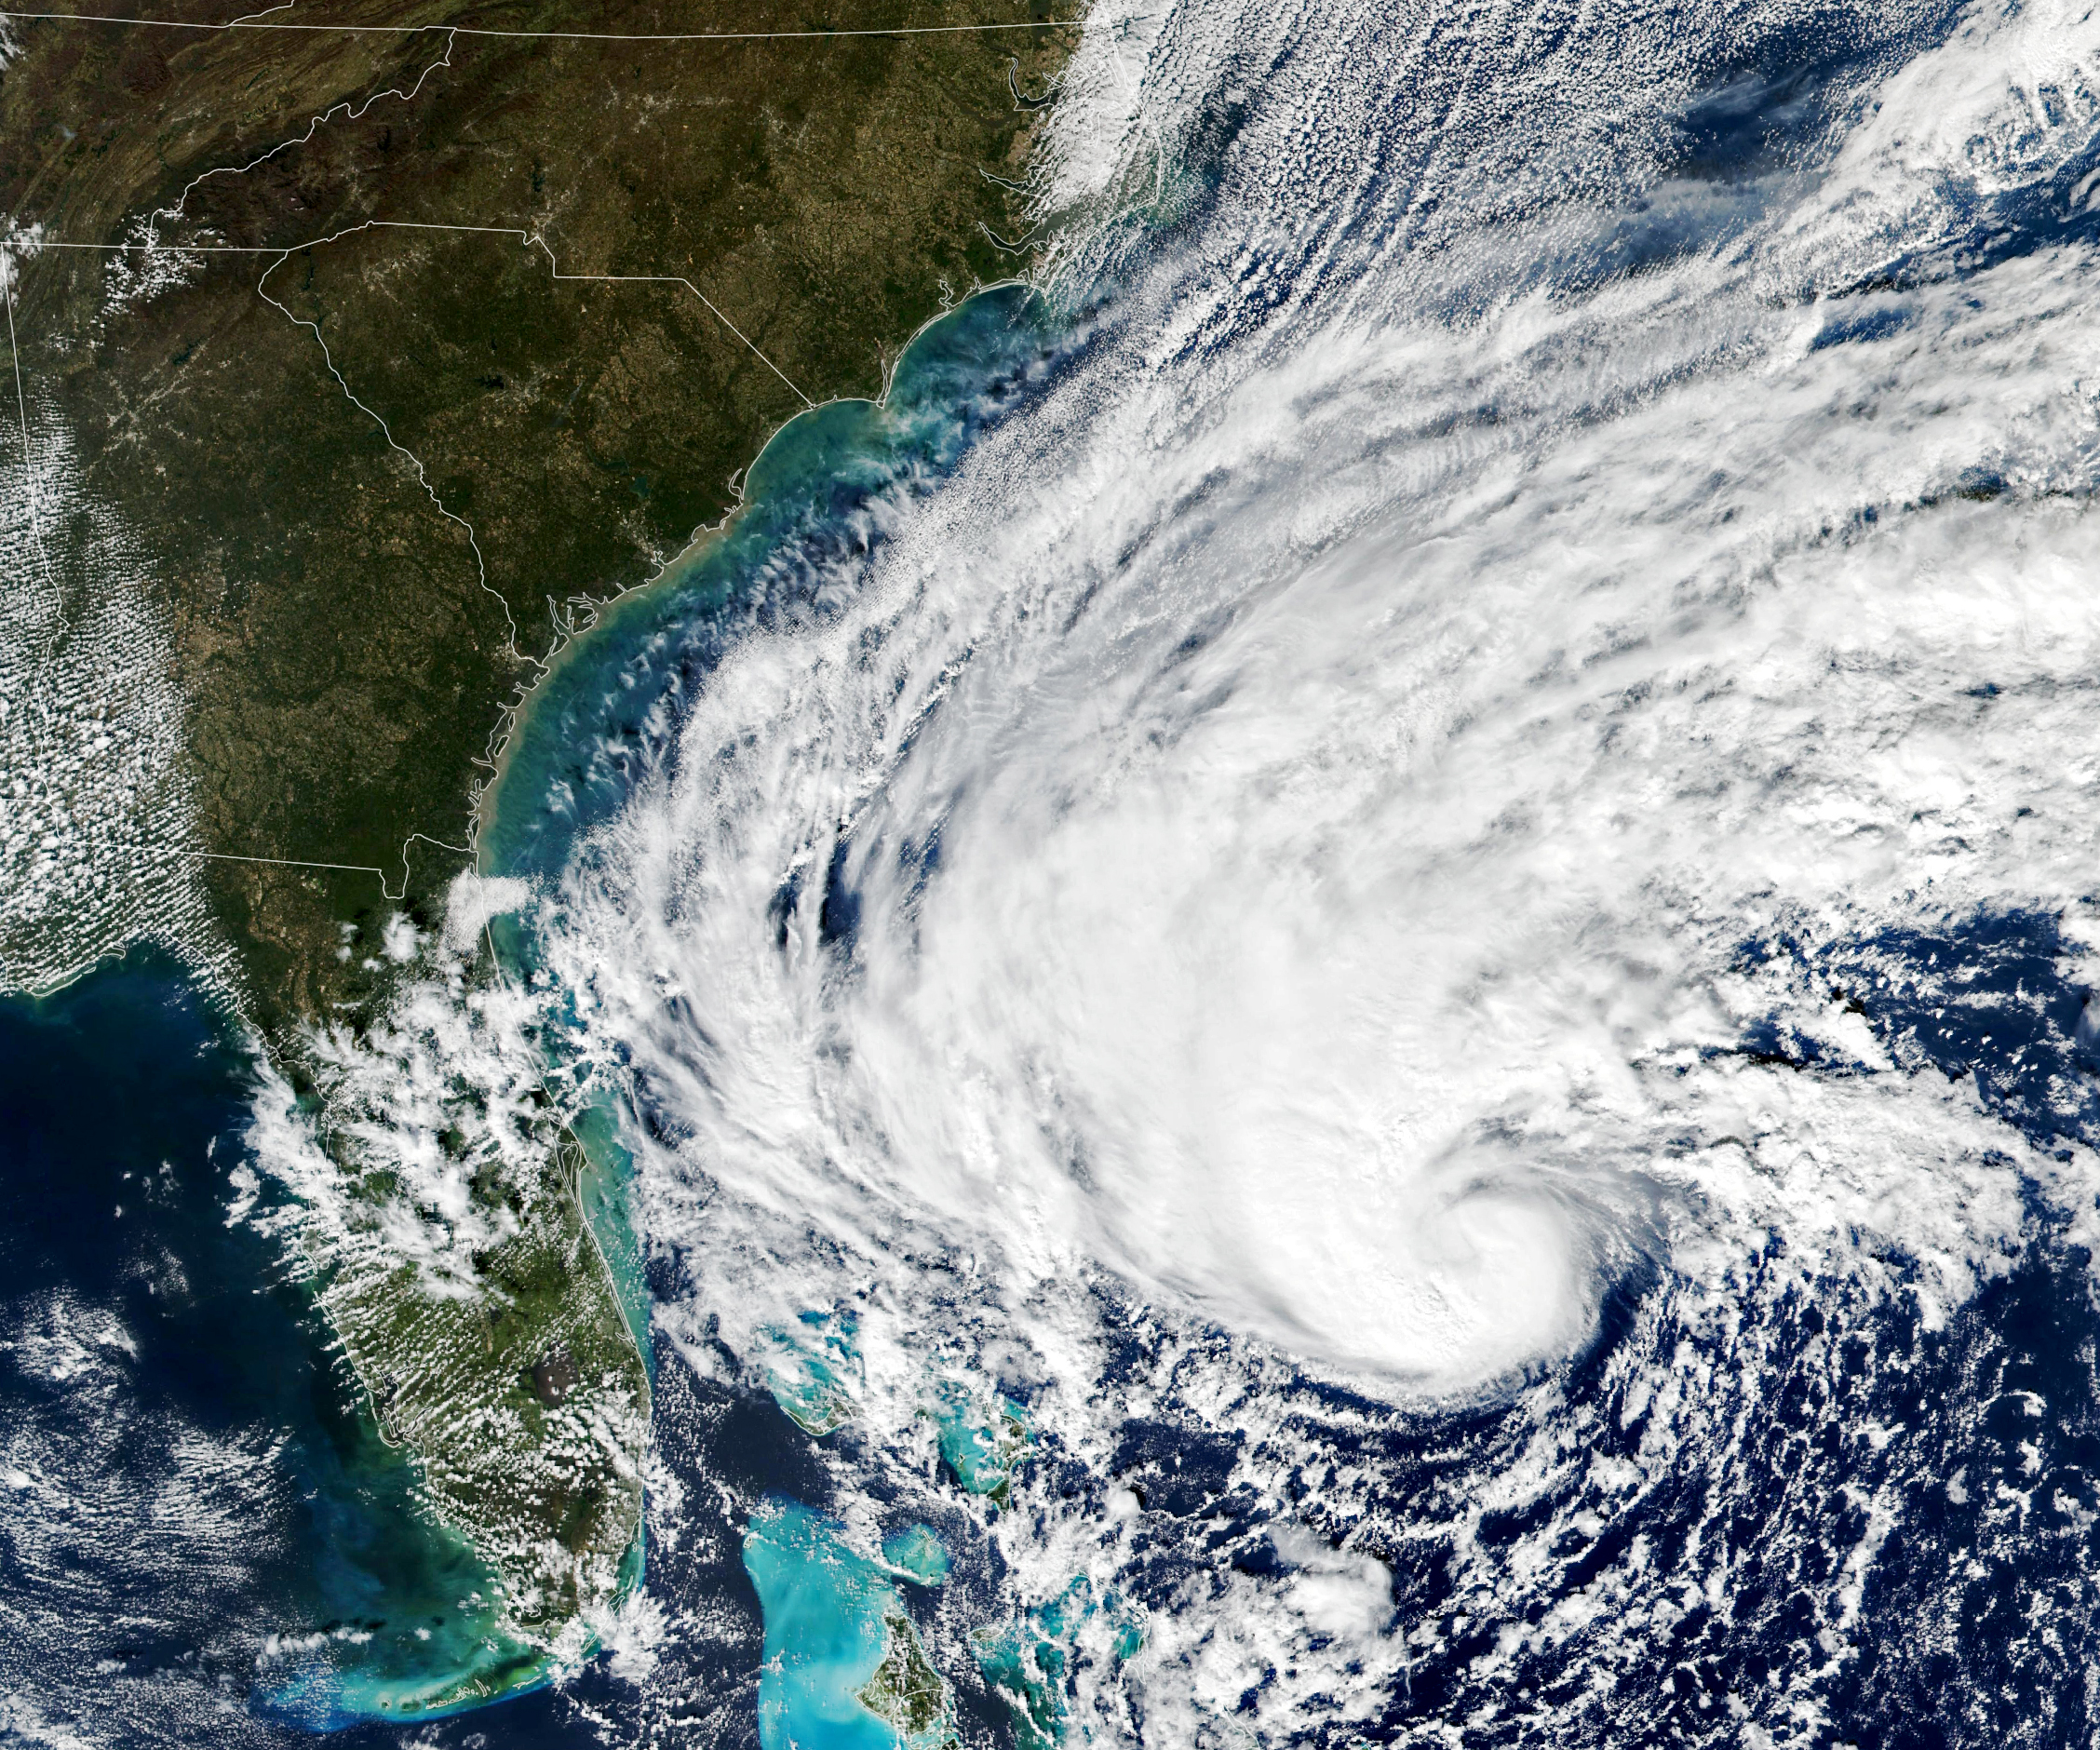
By far, the largest weather story of September was the landfall of Hurricane Ian. Ian was a category four major hurricane when it made its first U.S. landfall south of Tampa, FL on September 28. Ian weakened to tropical storm strength as it moved across Florida, emerging off the east coast on September 29. Ian restrengthened to a category 1 hurricane before its final landfall on September 30 near Georgetown, SC. The hurricane produced wind gusts in the 60-80 mph range and caused a substantial storm surge along the Grand Strand beaches, devastating coastal homes and businesses in Murrells Inlet, Pawley's Island, Litchfield Beach, and Garden City. Apache Pier and Second Avenue Pier in Myrtle Beach were damaged, and most of the Pawleys Island Pier collapsed. Observed water levels were four to six feet above astronomical tides.
|
Visible satellite and radar animation of Hurricane Ian making landfall on the South Carolina coastline on September 30, 2022. (above) Track of Hurricane Ian between September 23 and September 30, 2022. (at right) |
|
Ian's steady movement northward across the Carolinas limited rainfall totals to less than six inches and no significant freshwater flooding occurred. As Ian pushed farther inland, cool air wrapped completely around the storm's center quickly turning Ian into a post-tropical cyclone.
Detailed information about Hurricane Ian and its impact on the eastern Carolinas is available at https://www.weather.gov/ilm/HurricaneIan
October
Small amounts of rain fell on October 13th and during the last few days of the month, otherwise October experienced very dry weather. Monthly rainfall totals were only about 15 percent of normal. Near normal rainfall during summer plus rain from Hurricane Ian had erased drought conditions, however by the end of October the National Drought Monitor again classified portions of southeastern North Carolina as "abnormally dry."
An unusual early-season cold snap arrived on October 18 with temperatures running 10 to 18 degrees below normal through October 21. The first freezing temperatures of the fall season occurred in Florence on October 19, and in Lumberton on October 20. This is about nine days earlier than normal in Lumberton and 22 days earlier than normal in Florence.
November
Well above normal temperatures occurred during the first ten days of November, including highs in the 80s for four consecutive days November 4 through 7. This was due to a large ridge of high pressure across the Mid Atlantic states producing sinking air and mild onshore winds. Lumberton's high of 86 on November 7 set a new daily record high temperature for the date and was only one degree away from the hottest November temperature ever measured there. Wilmington reached 84 degrees on November 6 and 7, setting new daily high temperature records both days.
The biggest weather story of November was Hurricane Nicole. Nicole formed from a non-tropical area of low pressure near Puerto Rico and became a subtropical storm on November 7 while hundreds of miles east of the Bahamas. The system became fully tropical on November 9, then struck the Florida East Coast on November 10 as a category 1 hurricane with 75 mph winds. Nicole weakened as it moved northward through Georgia and western North Carolina on November 11. Across the eastern Carolinas, Nicole's impacts included 30 to 40 mph wind gusts, up to 1.50 inches of rain, along with rough surf and large seas offshore.
|
Tropical Storm Nicole as seen by the Suomi NPP satellite on November 8, 2022. Image provided by NASA's Earth Observatory website: https://earthobservatory.nasa.gov/images/150586/nicole-approaches-florida |
Nicole's rain was over half of what fell the entire month and moderate drought continued to plague portions of the eastern Carolinas.
A chilly Canadian airmass built in a few days after Nicole moved through the Carolinas. Morning low temperature dipped into the 30s on November 14. A second shot of even colder air arrived on the 17th, bringing freezing temperatures all the way down to the coast. Wilmington recorded its first freeze of the fall season on November 18, and Myrtle Beach followed on the 19th -- both very near the long term average dates.
Hurricane Season ended on November 30. This season had 14 named storms, 8 hurricanes, and 2 major hurricanes (Fiona and Ian) which was overall near normal activity.
December
The first two-thirds of December experienced changeable but overall mild weather as a series of weak weather systems swept across the eastern United States. Freezing nighttime temperatures were recorded inland between December 1-2, 13-14, and 18-19, but along the coast no freezes occurred in Wilmington or Myrtle Beach.
The biggest weather story of December was the Christmas cold snap. A powerful arctic cold front moved off the coast during the morning of December 23. Strong winds gusting between 45 and 55 mph developed behind the front as cold air poured across the Carolinas. Temperatures fell into the teens for several nights including Christmas. This was the coldest Christmas morning most of the area had seen since 1989.
|
Wilmington, NC
High temp on Dec 24 was the coldest daily high observed since January 2018. |
Florence, SC
|
North Myrtle Beach, SC
|
Lumberton, NC
|
|
Lowest temperatures observed between December 24-28 during the Christmas arctic outbreak of 2022. |
Very cold temperatures continued up through the morning of 28th before the arctic airmass modified and temperatures bounced back to near normal.
December ended on a warm note as southerly winds produced by low pressure in the Great Lakes brought subtropical air northward from the Bahamas. However the National Drought Monitor continued to indicate moderate drought conditions across portions of eastern North and South Carolina.
2022 City Climate Summaries
Wilmington, North Carolina
     Avg Hi/Dep   Avg Lo/Dep   Avg T/Dep   Warmest   Coolest   Precip/Dep
JAN   56.6/-0.6    33.4/-2.9   45.0/-1.8   78/2nd    19/30th   4.14/+0.33
FEB   64.3/+4.0    40.3/+1.9   52.3/+3.0   82/23rd   28/15th   1.37/-2.10
MAR   71.0/+4.5    47.2/+3.1   59.1/+3.8   84/3rd    25/13th   2.43/-1.54
APR   75.4/+0.8    52.0/-0.6   63.7/+0.1   86/26th   40/20th   3.27/+0.20
MAY   84.2/+3.1    65.7/+4.6   75.0/+3.9   95/20th   47/+9th   1.12/-3.42
JUN   89.1/+2.1    69.1/-0.2   79.1/+0.9   98/2nd    56/20th   4.83/-0.84
JUL   90.4/+0.4    75.7/+2.7   83.0/+1.5   96/28th   69/11th   7.59/+0.73
AUG   89.1/+0.8    73.3/+1.6   81.2/+1.2   98/10th   65/14th   6.71/-1.45
SEP   85.7/+1.8    66.9/+0.2   76.3/+1.0   94/22nd   49/24th   5.15/-3.54
OCT   75.1/-1.0    53.8/-1.8   64.5/-1.4   85/16th   37/20th   0.59/-4.07
NOV   71.0/+3.6    49.8/+5.0   60.4/+4.3   84/7th    30/18th   1.97/-1.59
DEC   60.5/+0.2    38.3/-0.8   49.4/-0.3   80/7th    20/26th   2.17/-1.52
--------------------------------------------------------------------------
ANN   76.0/+1.6    55.5/+1.1   65.7/+1.3   98        19       41.34/-18.81

Number of days with Temperatures...
90 degrees or higher:  58 (13 more than normal)
32 degrees or lower:   41 (4 more than normal)

Heating degree days: 2059 (267 fewer than normal)
Cooling degree days: 2451 (318 more than normal)

Number of days with precipitation...
0.01" or greater: 115 (7 fewer than normal)
0.10" or greater:  65 (14 fewer than normal)
0.50" or greater:  22 (14 fewer than normal)
1.00" or greater:  13 (5 fewer than normal)

Thunderstorms occurred on 54 days.
A total of 0.5 inches of snow and sleet fell across 4 days.

Average wind speed: 7.7 MPH
Maximum 2-minute wind speed: 47 mph on March 12 (Non-tropical low pressure)
Maximum 5-second wind gust: 68 mph on March 12 (Non-tropical low pressure)
Florence, South Carolina
     Avg Hi/Dep   Avg Lo/Dep   Avg T/Dep   Warmest   Coolest   Precip/Dep
JAN   55.8/-1.3    32.0/-4.0   43.9/-2.7   82/23rd   18/30th   3.95/+0.87
FEB   66.1/+5.3    40.4/+1.8   53.2/+3.5   86/25th   27/14th   2.20/-0.80
MAR   72.4/+4.1    46.2/+1.9   59.3/+3.0   85/3rd    24/13th   3.94/+0.75
APR   77.5/+0.8    50.1/-2.0   63.8/-0.6   89/26th   35/10th   3.26/+0.26
MAY   86.7/+3.2    64.7/+3.8   75.7/+3.5   98/19th   49/9th    2.14/-1.57
JUN   94.0/+4.8    70.3/+1.3   82.2/+3.1  102/13th   56/20th   2.56/-2.05
JUL   91.2/-0.8    73.7/+1.3   82.5/+0.3   98/31st   68/11th   5.12/-0.68
AUG   88.9/-1.4    71.0/-0.4   80.0/-0.9   99/1st    61/14th   3.80/-1.06
SEP   85.4/+0.0    64.6/-1.2   75.0/-0.6   97/22nd   46/24th   6.19/+1.66
OCT   74.2/-2.5    49.6/-4.7   61.9/-3.6   84/16th   32/19th   0.48/-2.94
NOV   68.8/+1.8    48.1/+4.6   58.5/+3.2   85/7th    28/21st   2.92/+0.29
DEC   57.0/-2.4    36.2/-2.1   46.6/-2.3   77/7th    14/26th   2.69/-0.78
--------------------------------------------------------------------------
ANN   76.5/+0.9    53.9/+0.0   65.2/+0.5  102        14       39.25/-6.05

Number of days with Temperatures...
90 degrees or higher:  82 (12 more than normal)
32 degrees or lower:   46 (6 more than normal)

Heating degree days: 2242 (92 fewer than normal)
Cooling degree days: 2428 (171 more than normal)

Number of days with precipitation...
0.01" or greater: 112 (1 more than normal)
0.10" or greater:  65 (8 fewer than normal)
0.50" or greater:  25 (5 fewer than normal)
1.00" or greater:  12 (exactly normal)

Snow or sleet fell on 3 days.

Average wind speed: 6.9 MPH
Maximum 2-minute wind speed: 45 mph on May 3 (Thunderstorm)
Maximum 5-second wind gust: 59 mph on January 3 (Severe thunderstorm)
North Myrtle Beach, South Carolina
     Avg Hi/Dep   Avg Lo/Dep   Avg T/Dep   Warmest   Coolest   Precip/Dep
JAN   54.1/-1.6    33.4/-3.3   43.7/-2.5   69/9th    19/30th   4.36/+1.35
FEB   61.7/+3.5    42.0/+2.4   51.8/+2.9   75/18th   31/14th   1.43/-1.75
MAR   67.2/+2.5    48.0/+2.6   57.6/+2.6   77/7th    26/13th   3.23/-0.36
APR   72.0/+0.2    52.2/-1.1   62.1/-0.4   78/6th    38/10th   3.01/+0.24
MAY   79.8/+1.1    65.4/+3.3   72.6/+2.2   87/31st   47/9th    1.72/-1.24
JUN   85.9/+1.1    69.8/-0.5   77.8/+0.3   97/14th   57/20th   3.94/-0.13
JUL   86.8/-0.8    75.6/+1.9   81.2/+0.6   92/28th   70/11th  10.91/+5.51
AUG   85.1/-1.4    72.6/+0.1   78.8/-0.7   91/11th   65/15th   6.48/+0.23
SEP   82.4/-0.8    66.8/-0.9   74.6/-0.9   91/6th    49/24th   5.95/-0.70
OCT   71.7/-3.9    52.6/-3.7   62.1/-3.9   81/16th   36/20th   0.74/-3.46
NOV   68.5/+2.1    50.3/+4.7   59.4/+3.4   81/7th    31/19th   2.59/-0.70
DEC   57.6/-1.7    38.1/-1.9   47.9/-1.7   72/15th   17/24th   1.91/-1.19
--------------------------------------------------------------------------
ANN   72.7/+0.0    55.6/+0.4   64.1/+0.1   97        17       46.27/-2.20

Number of days with Temperatures...
90 degrees or higher:  18 (3 fewer than normal)
32 degrees or lower:   32 (2 fewer than normal)

Heating degree days: 2237 (106 fewer than normal)
Cooling degree days: 2032 (29 more than normal)

Number of days with precipitation...
0.01" or greater: 111 (11 fewer than normal)
0.10" or greater:  70 (1 fewer than normal)
0.50" or greater:  30 (1 fewer than normal)
1.00" or greater:  13 (exactly normal)

Thunderstorms occurred on 55 days.
Snow fell on 1 day.

Average wind speed: 7.9 MPH
Maximum 2-minute wind speed: 43 mph on January 3 (Non-tropical low pressure)
Maximum 5-second wind gust: 58 mph on September 30 (Hurricane Ian)
Lumberton, North Carolina
     Avg Hi/Dep   Avg Lo/Dep   Avg T/Dep   Warmest   Coolest   Precip/Dep
JAN   53.6/-1.0    31.1/-4.2   42.4/-2.5   81/1st    15/23rd   4.20/+1.65
FEB   64.1/+5.5    39.9/+2.5   52.0/+4.0   84/25th   27/15th   1.29/-2.77
MAR   70.9/+5.1    45.5/+2.4   58.2/+3.7   84/3rd    25/13th   1.96/-1.30
APR   76.4/+1.7    50.6/-0.1   63.5/+0.8   88/26th   36/10th   2.48/-0.37
MAY   86.7/+4.2    62.6/+3.1   74.6/+3.6   99/19th   44/10th   0.79/-2.62
JUN   91.9/+3.1    68.4/-0.3   80.2/+1.3  100/2nd    55/20th   3.49/-1.43
JUL   90.8/-0.2    73.7/+1.4   82.3/+0.7   97/29th   67/11th   5.85/+1.24
AUG   89.2/+0.1    71.0/+0.1   80.1/+0.1   97/3rd    61/14th   4.78/+0.01
SEP   86.7/+2.5    63.6/-1.2   75.2/+0.7   96/22nd   44/24th   5.45/+0.52
OCT   74.8/-1.1    50.4/-2.1   62.6/-1.6   85/17th   32/20th   0.37/-2.29
NOV   69.4/+3.5    46.8/+4.4   58.1/+4.0   86/7th    25/21st   1.78/-1.17
DEC   56.3/-1.2    35.9/-1.6   46.1/-1.4   74/7th    16/26th   2.11/-1.20
--------------------------------------------------------------------------
ANN   75.9/+1.8    53.3/+0.4   64.6/+1.1  100        15       34.55/-8.07

Number of days with Temperatures...
90 degrees or higher:  83 (16 more than normal)
32 degrees or lower:   51 (exactly normal)

Heating degree days: 2376 (233 fewer than normal)
Cooling degree days: 2338 (251 more than normal)

Number of days with precipitation...
0.01" or greater:  99 (19 fewer than normal)
0.10" or greater:  53 (18 fewer than normal)
0.50" or greater:  20 (8 fewer than normal)
1.00" or greater:  11 (1 more than normal)
|
Radar-estimated precipitation totals for 2022 |
Radar-estimated precipitation departures from normal for 2022 |
Research and Page Author: Tim Armstrong
Last modified: January 1, 2023


 Coastal Flood