Preliminary Event Overview
The first significant winter storm of the season struck just before the Thanksgiving holiday, impacting Wisconsin from late Tuesday evening November 26th through Wednesday November 27th. The storm developed over the Central Plains early Tuesday, then quickly moved northeast to Lake Michigan by early Wednesday afternoon. Note the rapidly developing clouds in the water vapor satellite animation over Iowa and Wisconsin just northeast of the approaching upper-level circulation (Figure 1). The associated surface low pressure system tracked southwest to northeast across Wisconsin early Wednesday (Figure 2) with a band of heavy snow setting up northwest of the surface low track. The precipitation moved into central and east-central Wisconsin Tuesday evening and quickly expanded northward across the remainder of the state (Figure 3). Mainly rain fell across southern and east-central Wisconsin, while heavy wet snow, occasionally mixed with sleet, fell across central and northern sections of Wisconsin. The wet, heavy snow accumulating on trees and power lines, along with strong winds circulating around the storm, caused widespread power outages across much of northern Wisconsin. As of 1 pm Wednesday, over 40,000 residence were impacted (Figure 4). By midday Wednesday, a swath of 6 to 12 inches had fallen from Eau Claire to Eagle River, Wisconsin (Figure 5). Nearly 14 inches of snow was reported a few miles southeast of Eagle River in extreme southeast Vilas County! In addition to the snow and sleet, 1 to 2 inches of rain, strong winds and abnormally high lake levels contributed to localized flooding in susceptible areas adjacent to the lake and bay, especially in Oconto, Door and northern Brown counties. The storm impacted a large area of the central United States, from Wyoming and Colorado northeast to Wisconsin and Upper Michigan. As of early afternoon Wednesday, the fresh snow cover produced from the storm can clearly be seen in the enhanced GOES 16 satellite image (Figure 6). The animation shows what the satellite was "seeing" three days earlier around noontime November 24, compared to the same time three days later on November 27. Clouds from the departing storm were still obscuring the freshly fallen snow over Iowa, Minnesota and Wisconsin.

Figure 1 (above) - Water Vapor Loop of Upper-level Circulation
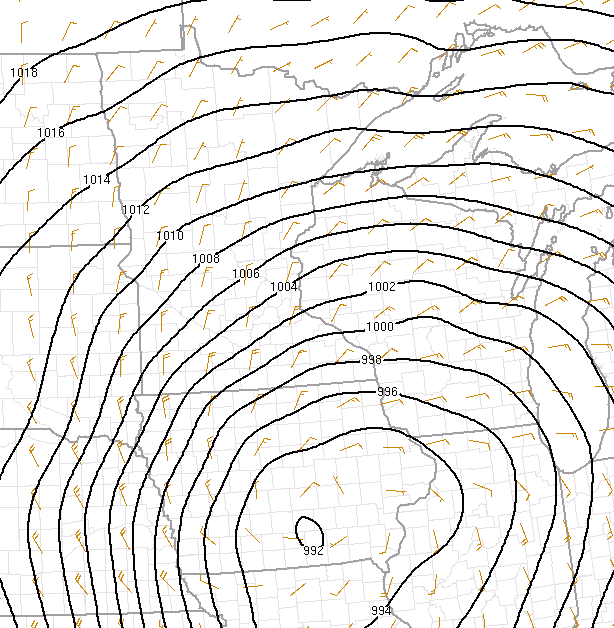
Figure 2 (above) - Surface Pressure Analysis Showing Low Track Across Wisconsin

Figure 3 (above) - Composite WSR-88D Radar Loop of Precipitation.

Figure 4 - Map showing percentage of customers without power as of 1 pm Wednesday.
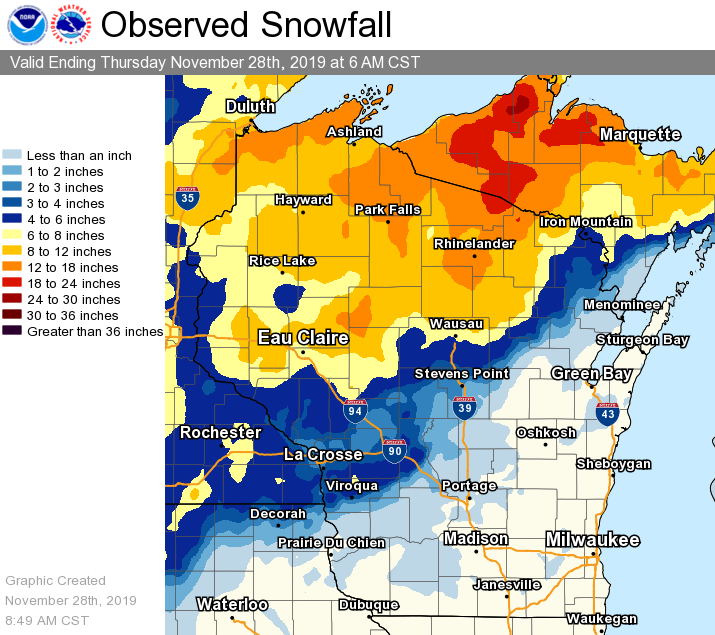
Figure 5 - Preliminary estimate of storm total snowfall.

Figure 6 - Enhanced satellite image. Swath of new snow cover in greenish color.
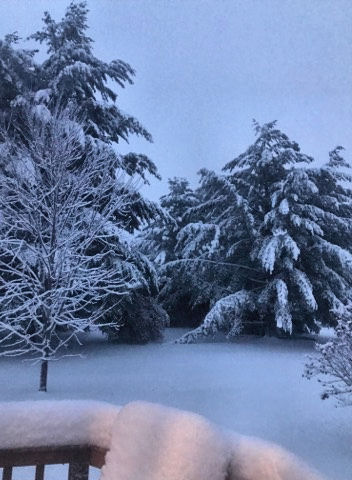
Photo from Merrill, Wisconsin.
** This overview will be updated as new information becomes available.

