December 13-15 2022 Winter Storm
Event Overview and Impacts
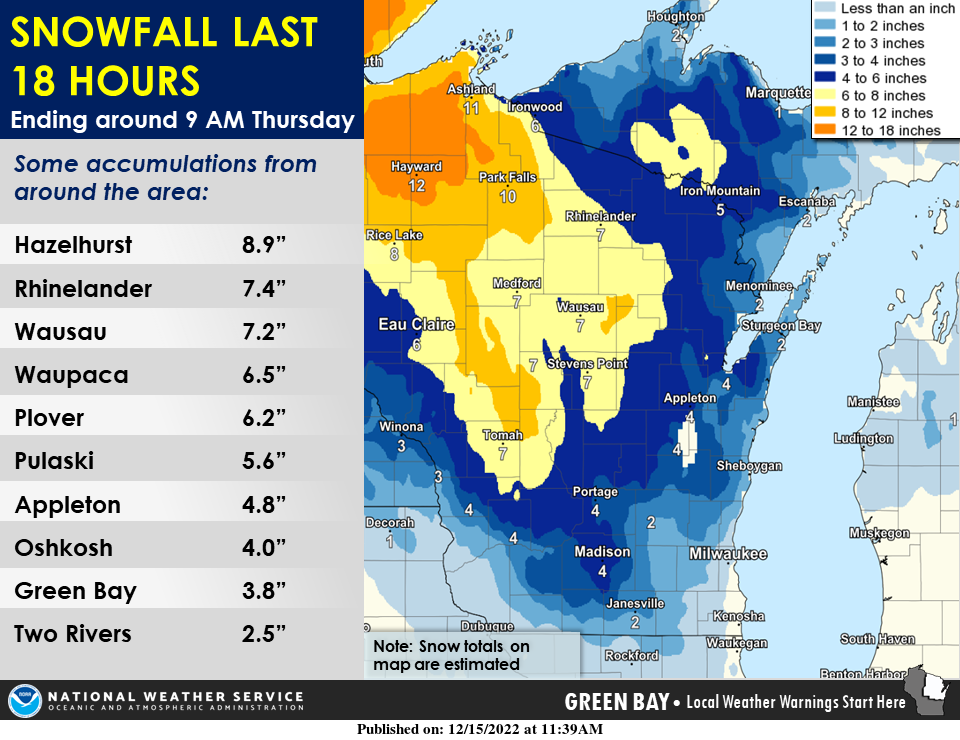
The first significant winter storm of the winter season brought a variety of heavy winter precipitation to north-central and northeast Wisconsin. The initial wave of precipitation mainly impacted central and north-central Wisconsin late Tuesday night, December 13th into Wednesday morning, December 14th. Up to 0.20 inch of ice accumulation was reported in parts of Wood, Portage, Marathon, Lincoln and Vilas counties by midday Wednesday. Many roads became ice covered and treacherous (Figure 1A) before they could be treated, while numerous tree branches were snapped due to the combination of the ice accumulation and strong winds that gusted to over 35 mph (Figure 1B). A few power poles were also snapped which caused scattered power outages. The second significant wave of precipitation arrived early Wednesday evening, December 14th and pushed north across the area overnight into Thursday morning, December 15th. This second wave brought brought a mixture of rain, freezing rain, and sleet initially that then quickly changed over to heavy wet snow around midnight. During an approximate 6 hour period ending around 6 am Thursday, December 15th, a swath of 6 to 8 inches fell over much of central and north-central Wisconsin (Figure 2). Lesser amounts fell further to the east with generally 1 to 4 inches reported east of Interstate 41. The snow fell at a rate of 1 to 2 inches per hour after midnight, accompanied by an occasional flash of lightning and clap of thunder! In fact, there were several daily precipitation records that were broken at several locations across the forecast area on December 15 (Figure 1C).
Figure 1A (Below) - Road conditions (Courtesy WI DOT) during Wednesday morning commute.
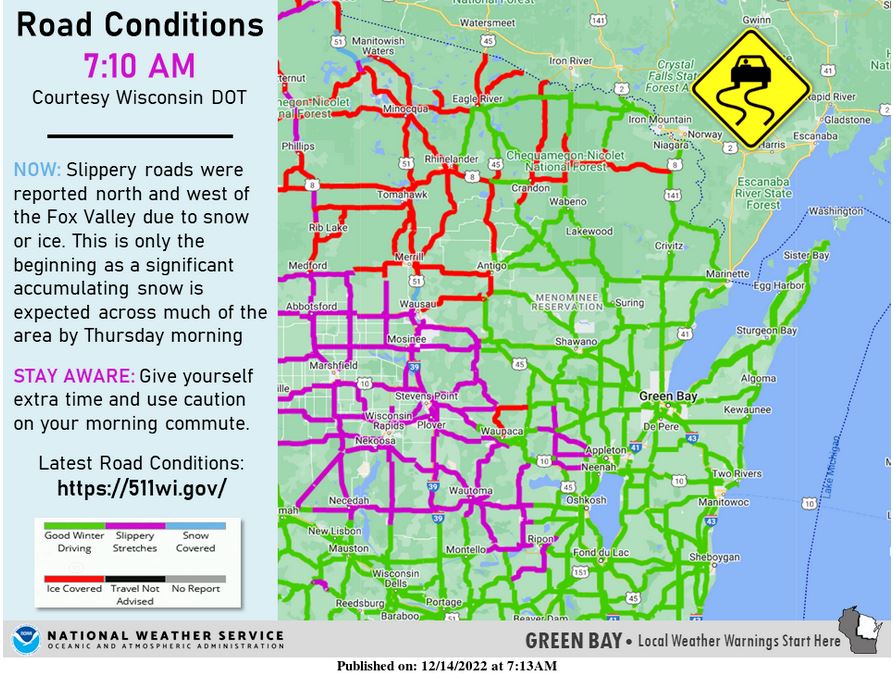
Figure 1B (Below) - Peak Wind Gusts
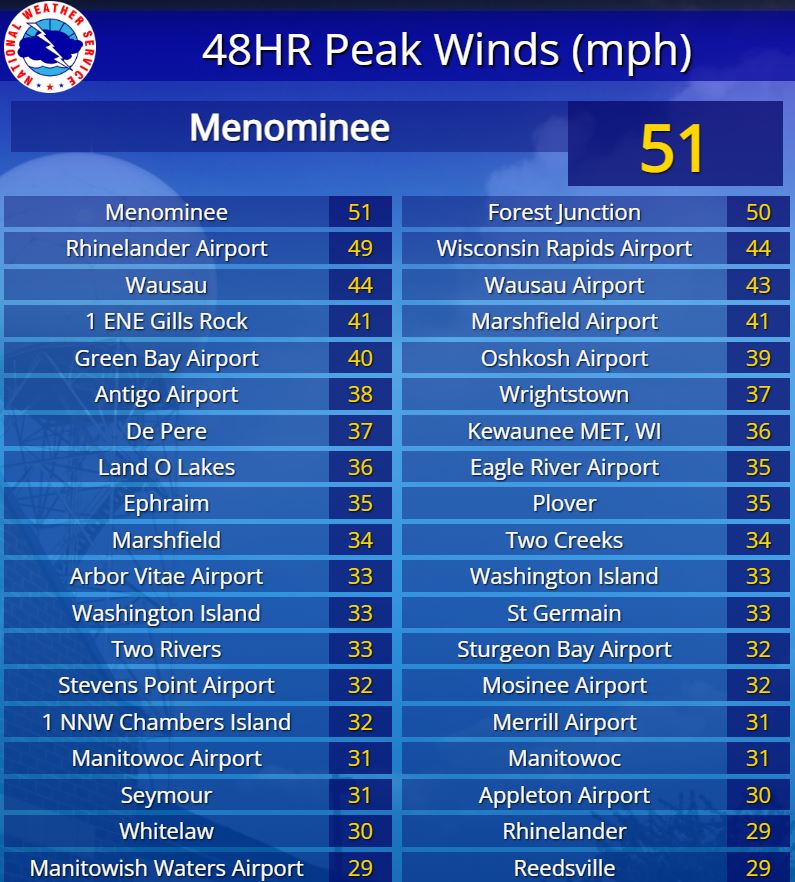
Figure 1C (Below) - December 15 Daily Snowfall and Precipitation Records
.JPG)
Figure 2 (Below) - Preliminary Storm Total Snowfall as of 9 am Thursday December 15.
Click here for a list of snowfall reports from across the forecast area.
Brief Meteorological Overview
This was a very large, slow moving, and expansive weather system that impacted a large part of the central and northern United States from Tuesday, December 12 through Thursday, December 15. The storm rapidly intensified as it crossed the Rocky Mountains and slowly drifted east out over the High Plains early on December 13th. Note the impressive cyclonic circulation that developed over eastern Colorado and then slowly moved northeast into Nebraska and South Dakota (Figure 3). Several bands of moderate to heavy precipitation can be seen developing to the east of the circulation, then wrapping north and northwest around the circulation center. To the northwest of this circulation, very heavy snow and blizzard conditions were reported over parts of northeast Colorado, northwest Nebraska and western South Dakota as the circulation moved out into western Nebraska during the afternoon of Tuesday, December 13th (Figure 4).
Figure 3 (Below) - GOES 16 Water Vapor Animation showing the life-cycle of the winter storm. GLM Lightning data overlaid.
Figure 4 (Below) - Enhanced composite imagery showing strengthening circulation over the high plains. High and/or thick ice clouds are orange while lower-level cloud layers composed of water are grayish/bluish colored.
Storm Evolution and Impacts over the Western Great Lakes and Northeast Wisconsin
The primary weather feature that ultimately brought the burst of heavy wet snow to much of the forecast area late Wednesday night was actually a strong secondary short wave disturbance that developed over the southern United States and then rapidly moved northward toward Wisconsin between 6 pm Wednesday and 6 am Thursday. This disturbance can be seen pivoting northward on the eastward flank of the slow-moving upper-level low (Figure 5). Note the flareup and expansion of cold cloud tops in the GOES 16 Water Vapor animation (Figure 3) observed to the west of an intense the severe squall line (note line of lightning flashes moving east across the southern Mississippi Valley accompanying the squall line). These clouds quickly expanded north and west as they approached Wisconsin toward the end of the animation (Figure 3). These enhanced clouds can also be seen in the GOES 16 enhanced infrared image animation (Figure 6). Note the rapid transition to deeper orange and red-enhanced cloud tops as they swept north across Wisconsin early Thursday morning. This was during the period when the heaviest snowfall (and highest hourly snowfall rates) occurred. In concert with the strong lift ahead of the shortwave impulse, there was also just enough elevated instability over Wisconsin to generate some thunder snow! We can see the occasional light flashes in the GOES-16 Geostationary Lightning Mapper (GLM) data that was superimposed over a mid-level water vapor image animation in Figure 7.
One of the many forecast challenges during this phase of the storm, as it pertained to Wisconsin, was determining when the mixed rain, sleet, and freezing rain would transition to heavy snow late Wednesday night. This was important because the timing of the transition impacted how much snow will fall. The sooner (later) the transition, the more (less) snowfall. There were various factors that would impact the ultimate precipitation type observed at the surface. In this event, the strong shortwave impulse approaching the forecast area, caused strong upward motion (in an initially above freezing low-middle levels of the atmosphere) which contributed to strong cooling (dynamic cooling) in these levels. However, this was somewhat offset by the horizonal advection of relatively warmer (above freezing airmass) that was blowing northwest toward eastern Wisconsin from Lower Michigan (note wind barbs in Figure 8 below). In addition, given it is early in the winter season, Lake Michigan is still relatively warm, thus it can keep temperatures warmer (above freezing) at the surface near Lake Michigan, especially east of Highway 41. Figure 8 is an illustration of one deterministic forecast model's depiction (NAM) of how the temperatures in the lower part of the troposphere were going to evolve. Note that the temperatures at this level (850 mb ~ 5000 ft AGL) started out a few degrees above freezing over much of the forecast area, then were forecast to rapidly cool to below freezing (transition to dark blue colors). Closer to the Lake Michigan, the cooling was much less dramatic. Taking a look at the preliminary snowfall totals from the event (Figure 2), we indeed see a notable increase in the snowfall amounts as you go westward away from Lake Michigan. This just illustrates that early in the Winter season, living near the Great Lakes can be a real forecast headache as the conglomerate warming effects of the lakes can sometimes be quite strong and may not always be resolved adequately by numerical forecast model guidance.
Figure 5 (Below)- 500 MB Height, Wind, and Temperature Analysis (00Z to 12Z) Thursday, December 15. The strong embedded shortwave disturbance is denoted by the red line segment in the animation. Note that the upper-level low pressure center (L) moved very little during this period. The associated surface low pressure centers are shown in Figure 5A.
Figure 5A (Below) - Accompanying Surface low pressure evolution. Note the development of a second low pressure center that moves north from Tennessee to southwest Wisconsin. This second low pressure center was associated with the upper-level disturbance shown in Figure 5 above
Figure 6 (Below) - GOES-16 Enhanced IR imagery showing rapid cloud top expansion and cooling over Wisconsin ahead of strong short-wave impulse shown if Figure 5. The accompanying radar animation also shows the areal expansion and increase in intensity of precipitation band as it surged northward into Wisconsin Wednesday night into Thursday morning.
Figure 7 (Below) - GOES-16 Mid-Level Water Vapor Image Animation with GLM Lightning Data (00Z to 12Z Thursday). Accompanying GRB WSR-88D radar data is also shown.
Figure 8 (Below) - NAM model forecast evolution of 850 MB (~5000 Feet AGL)temperatures between 00Z and 12Z Thursday. Darker blue colors indicated significant cooling where temperatures at that level dropped below freezing. Light green colors indicate where temperatures are a few degrees above freezing. White dashed line is the freezing line (0 degrees C). Winds barbs (kts) are also overlaid along with the height of the 850 mb surface (solid black lines).
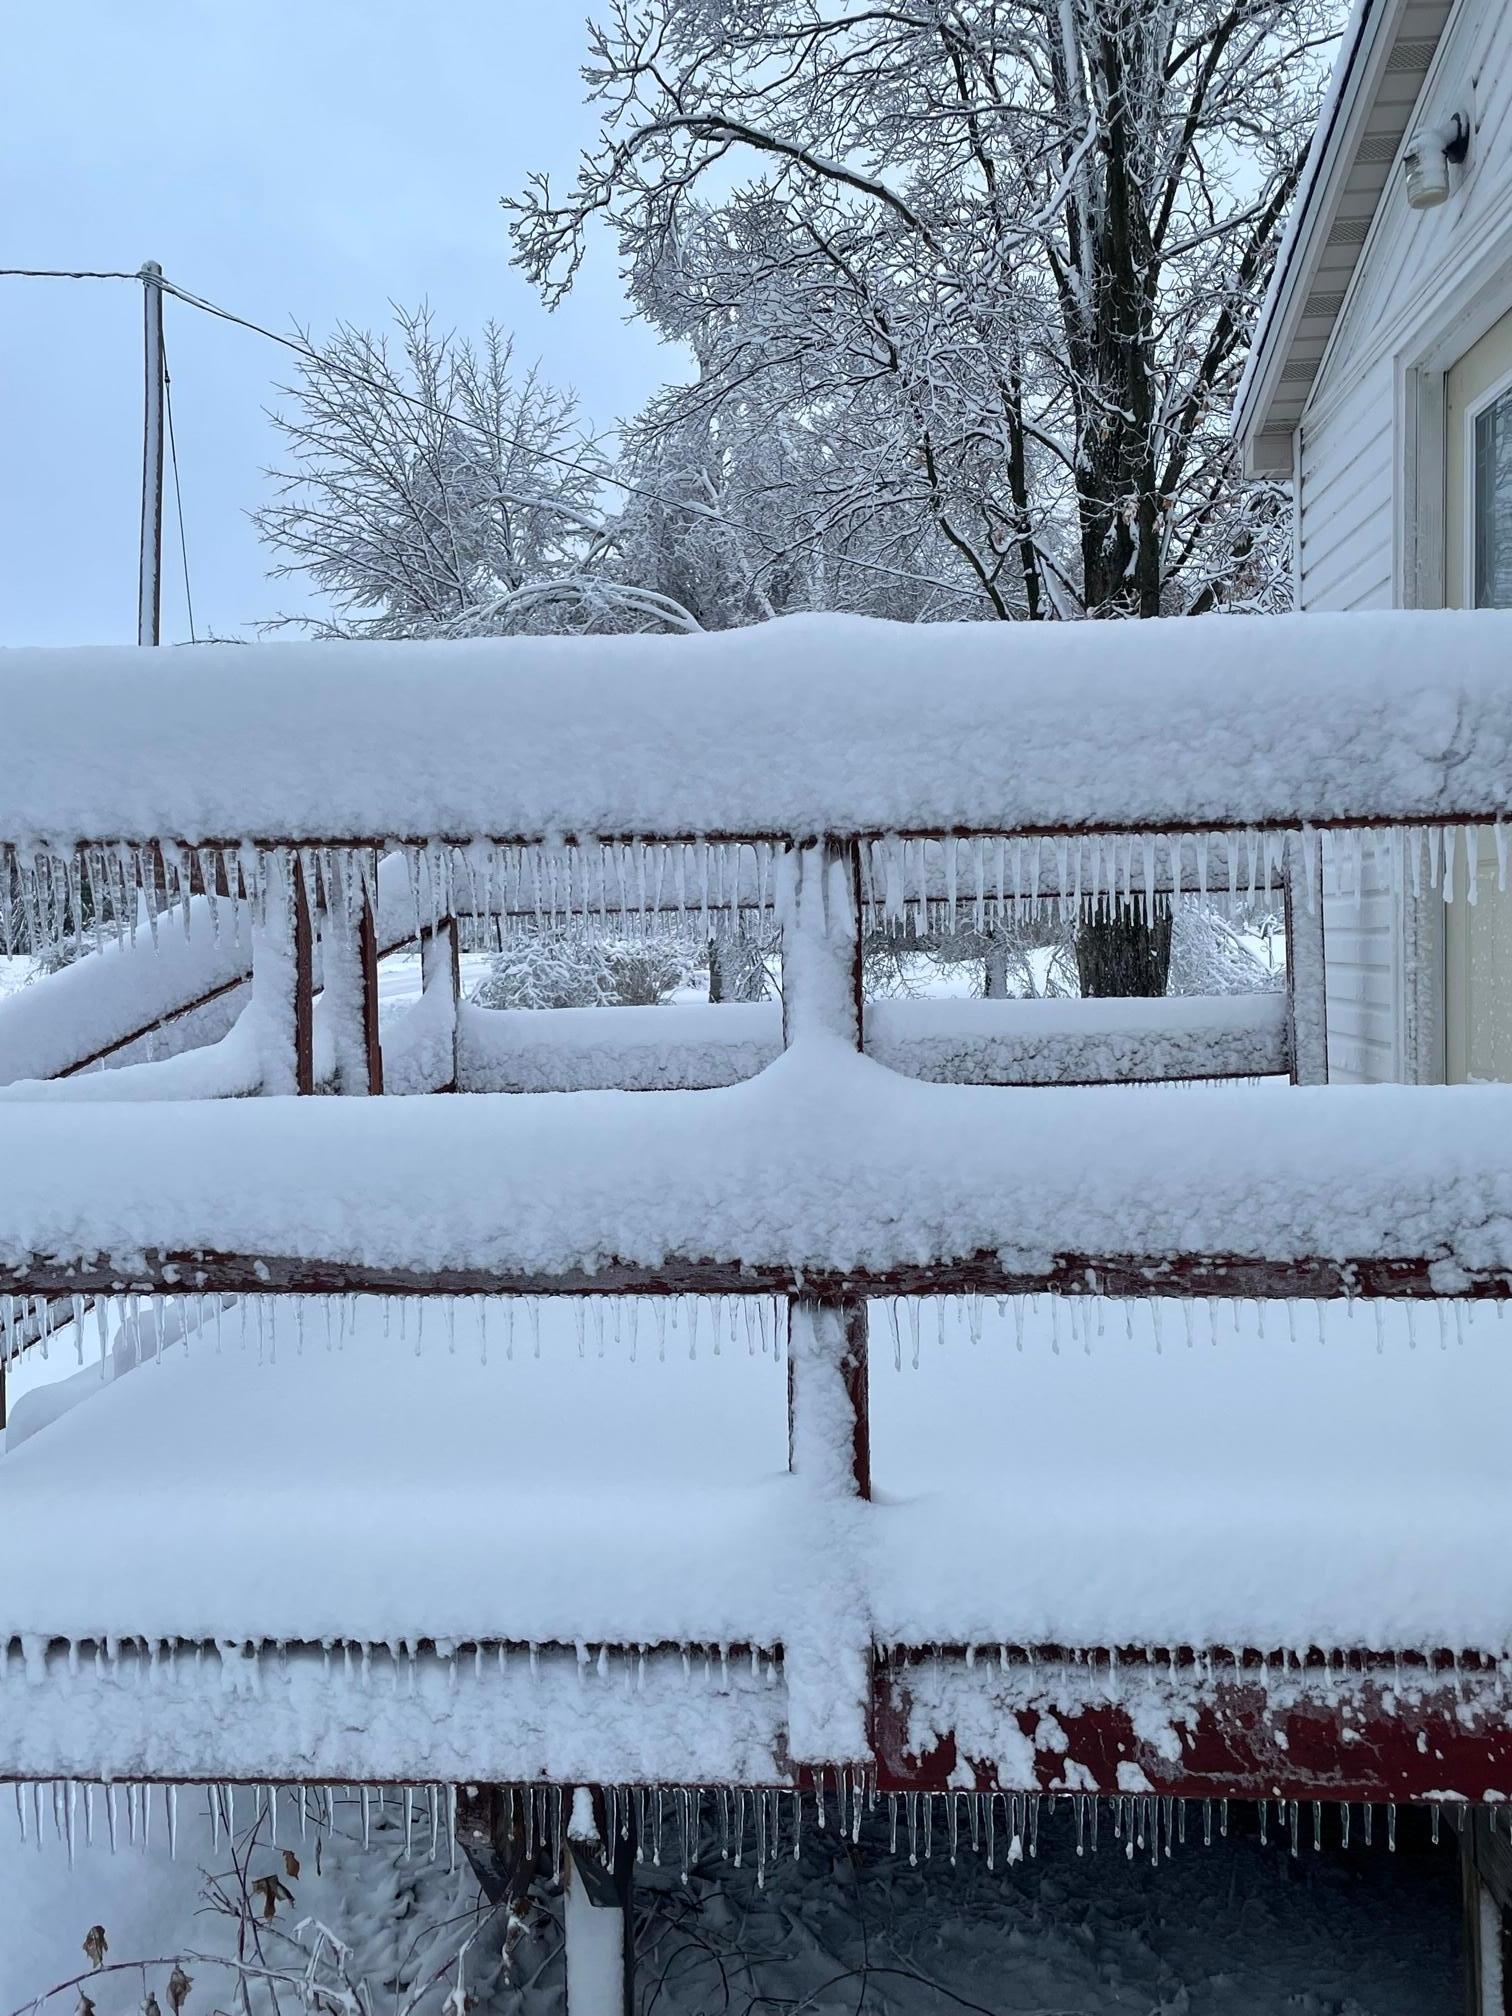
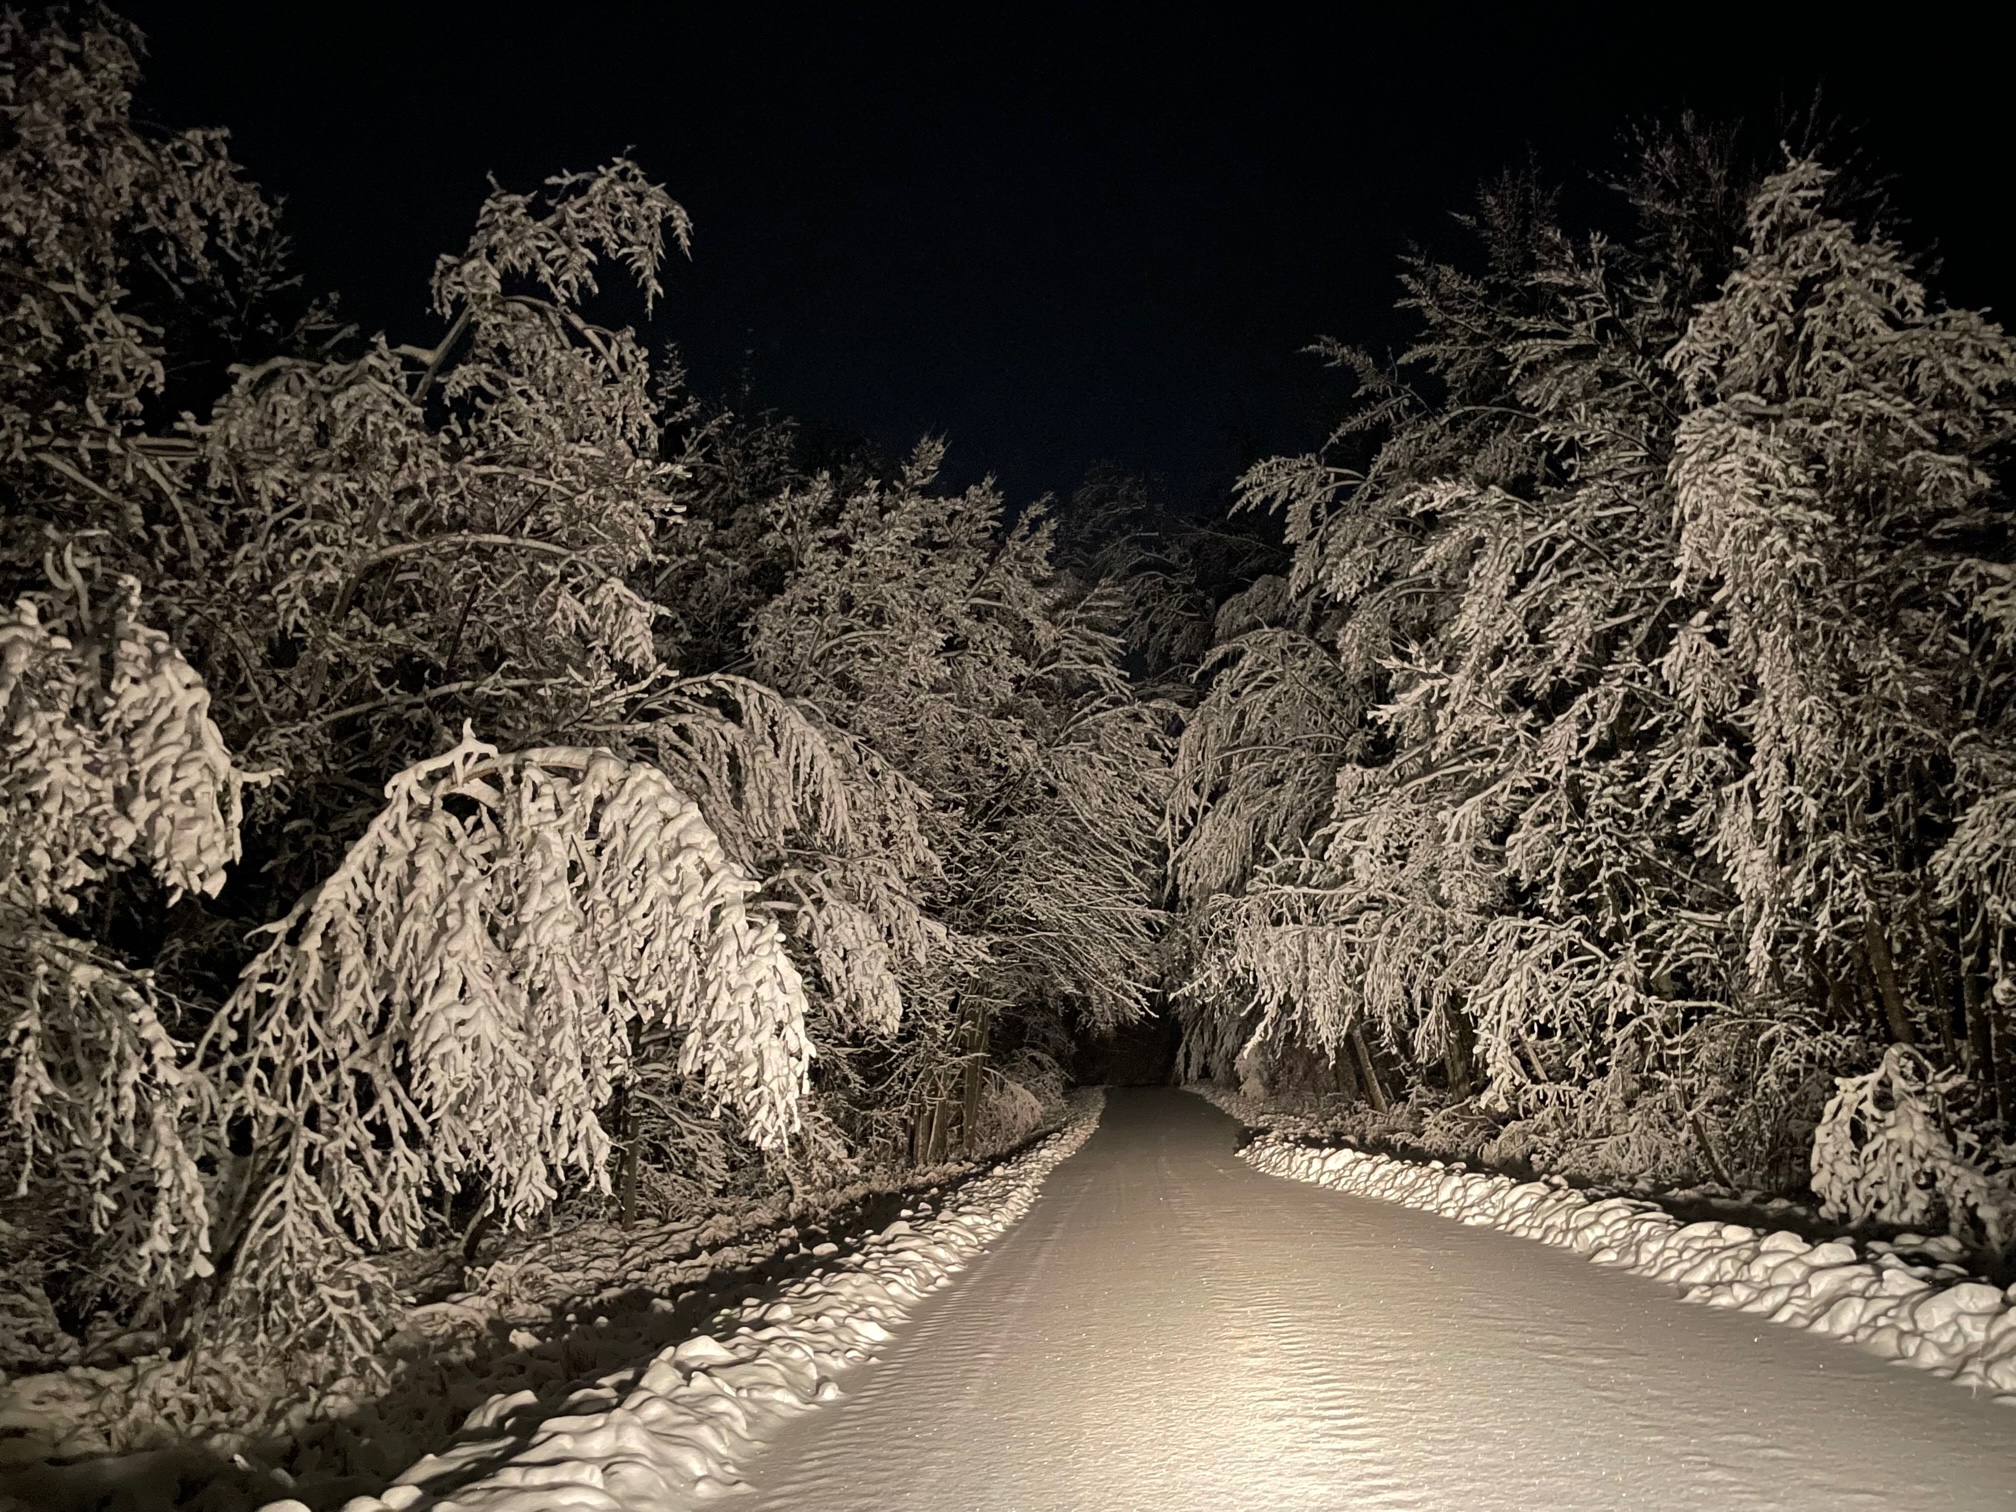
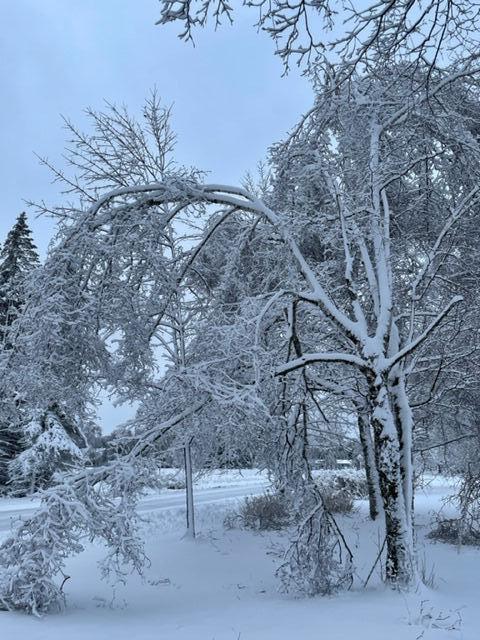
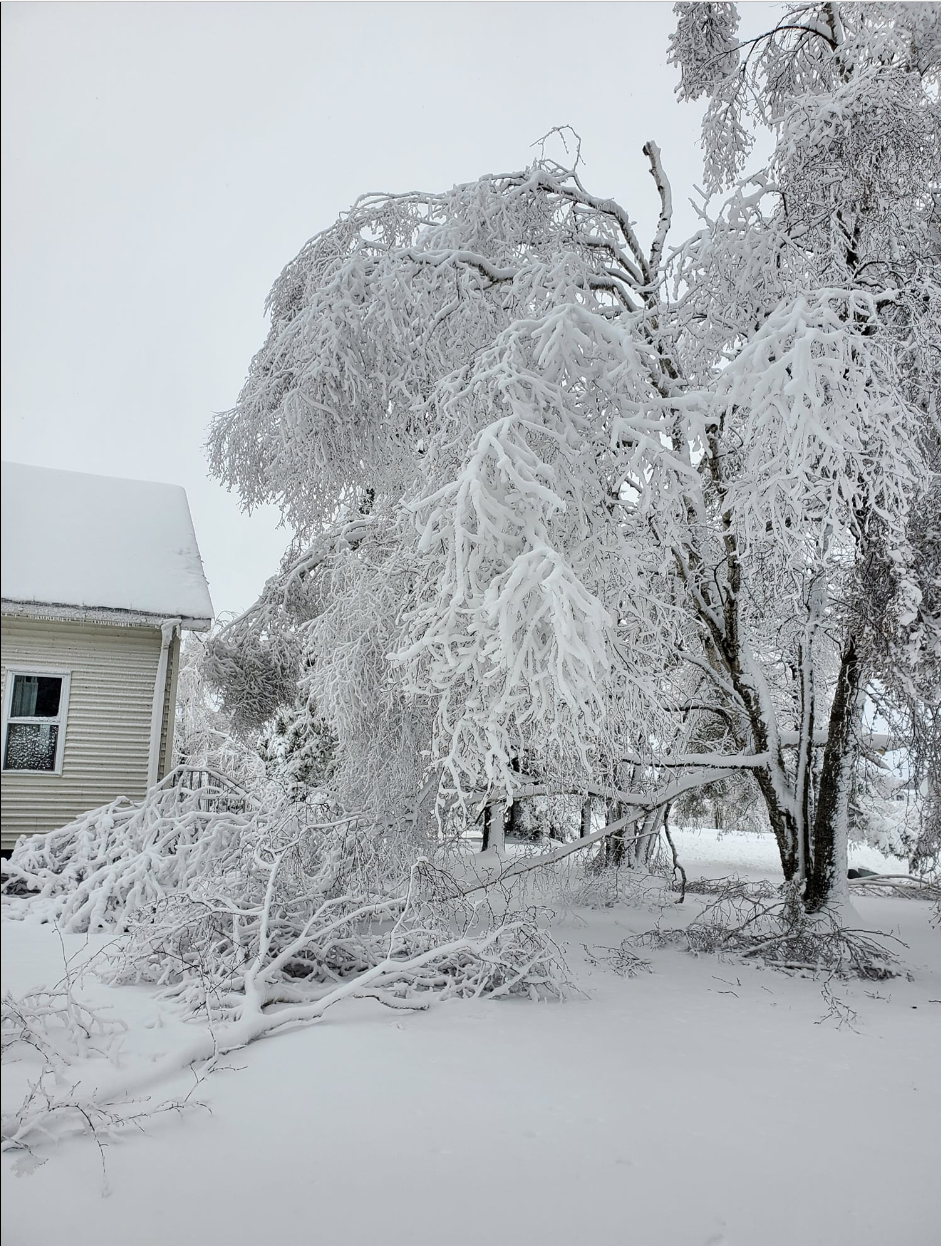
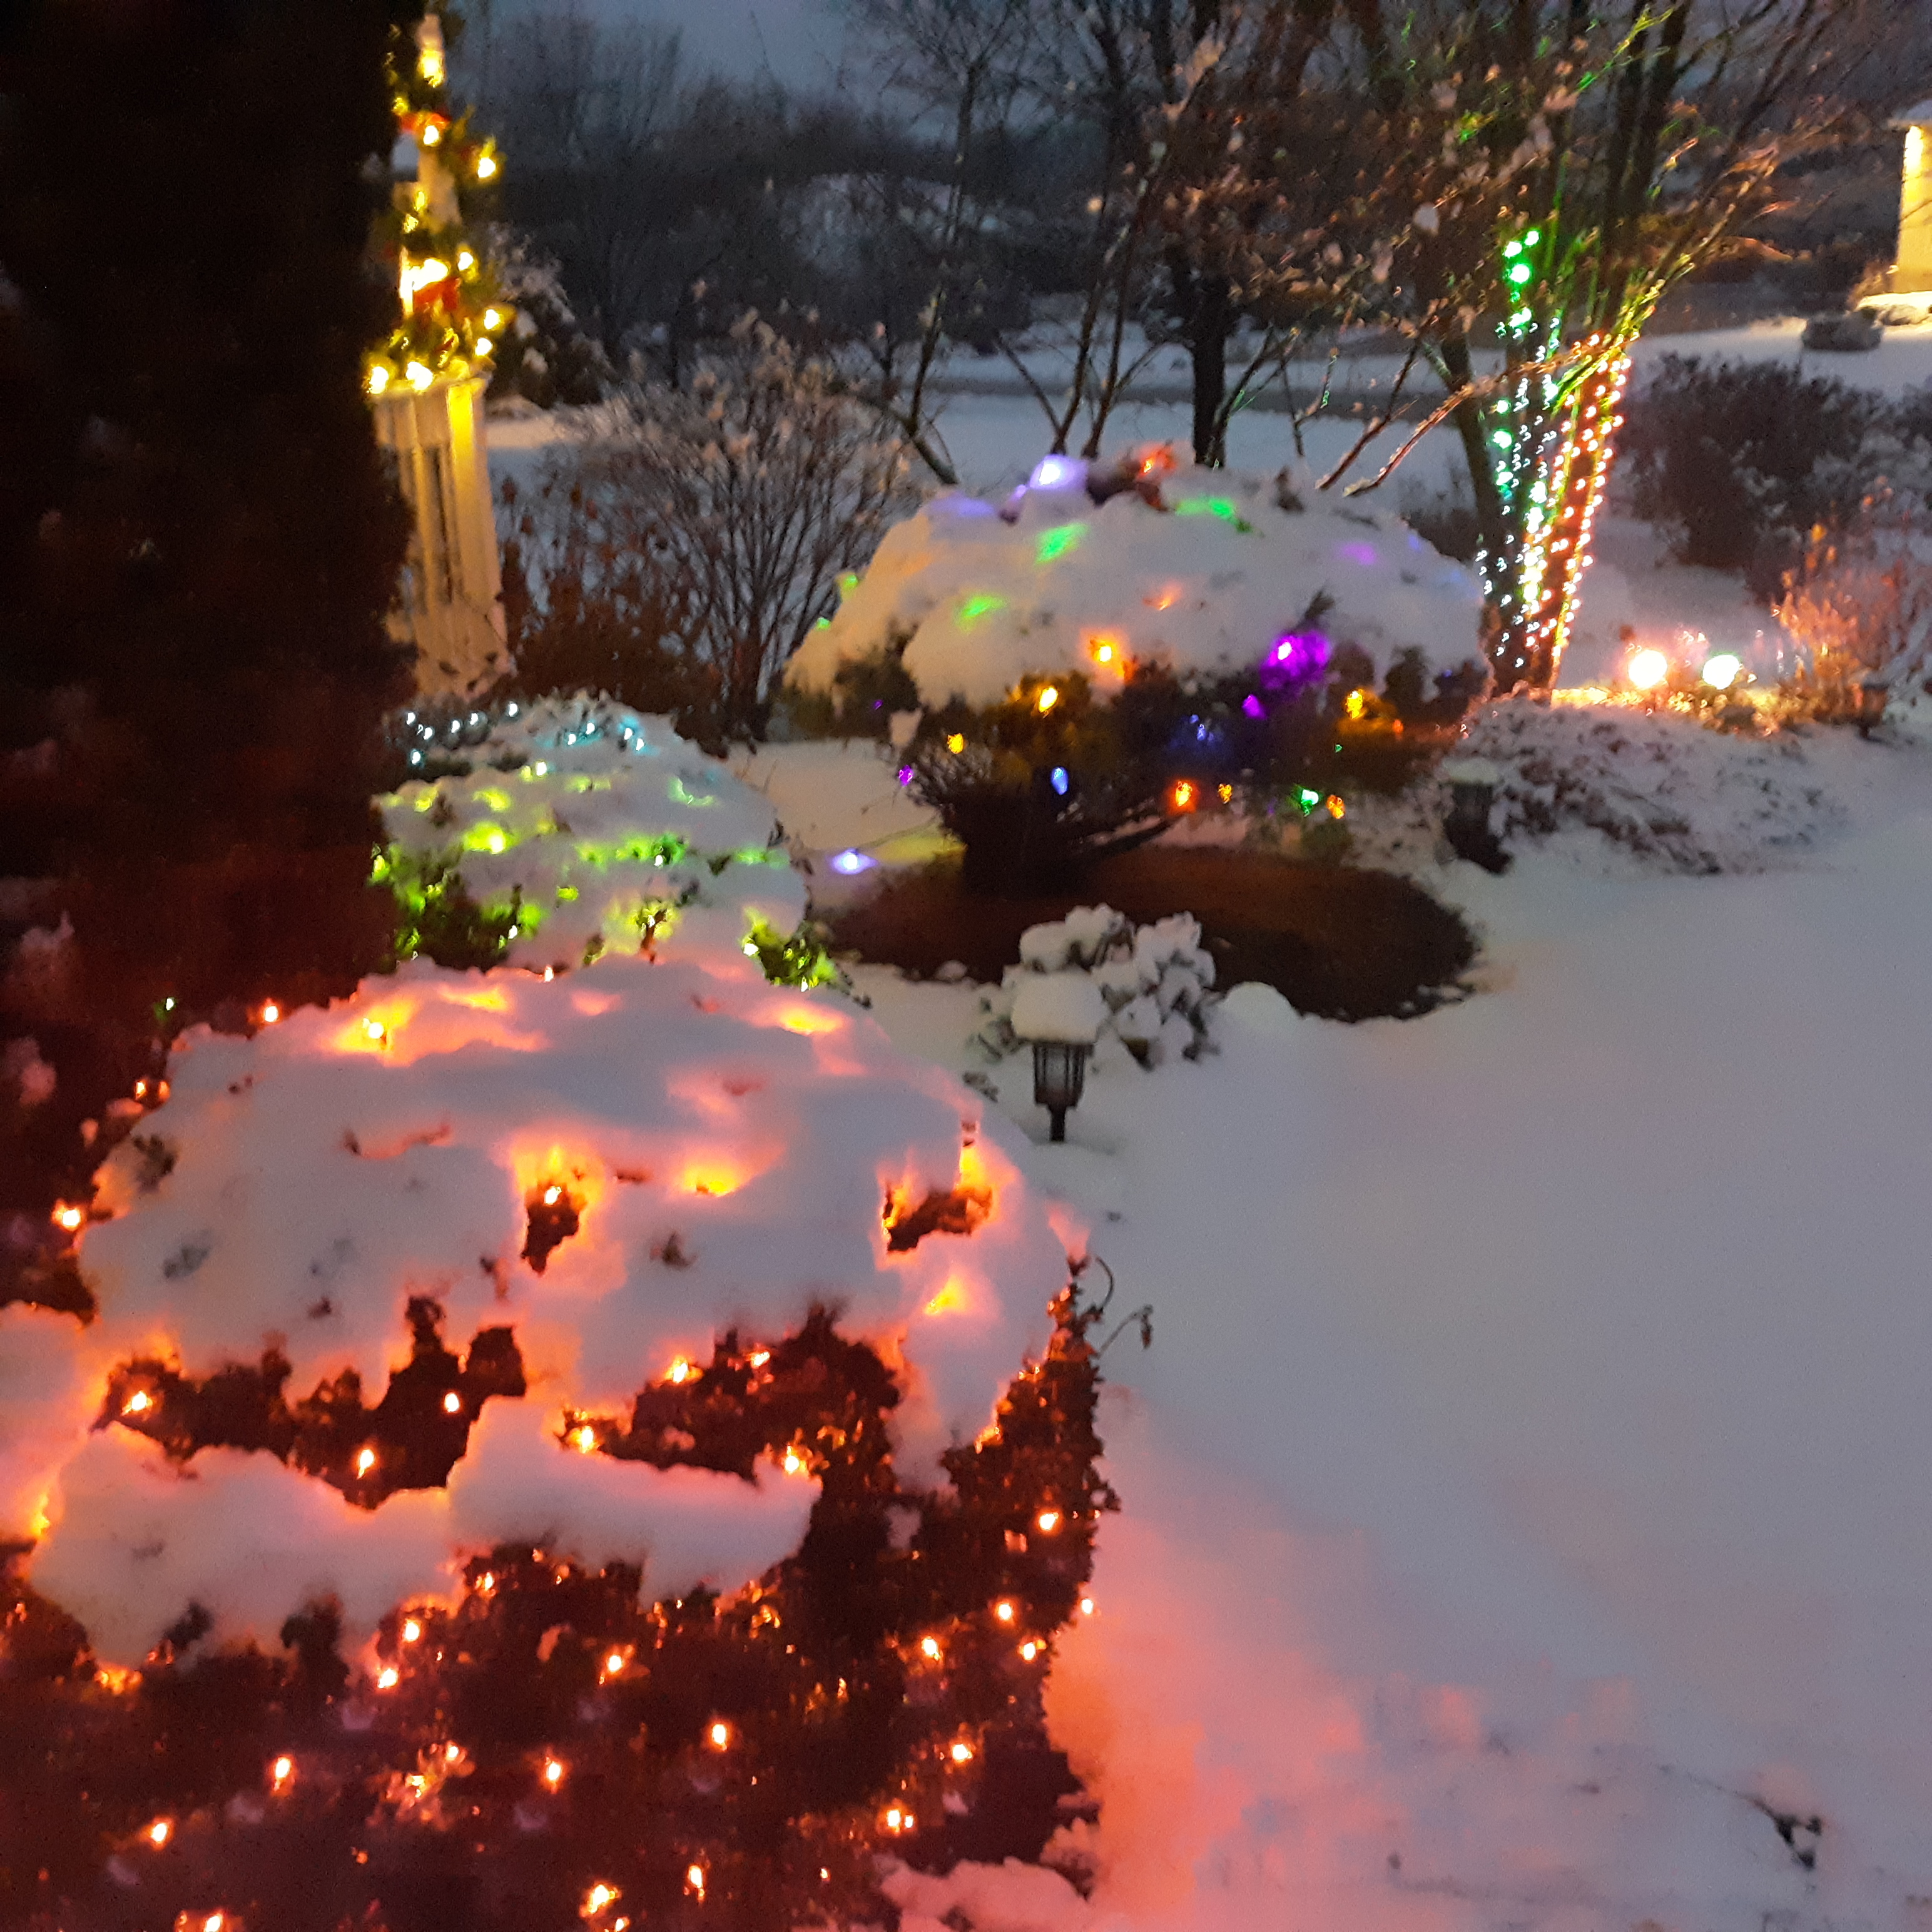
A Few Photos Of the Snow and Ice Across Northeast Wisconsin from the Storm
This summary is very preliminary and may be updated as new information becomes available.
Updated 12/16/22

