The April 12, 2022 Hail Storm
Event Overview
During the early afternoon hours of Tuesday April 12, 2022, an isolated severe thunderstorm developed in far northern Iowa and moved northeast into southeast Minnesota. The storm intensified and then turned east, dumping a swath of large hail from just north of La Crosse to near Green Bay between about 3:30 pm and 6:45 pm CDT. The hail ranged in size from 0.75 to 1.75 inches in diameter with many locations reporting hail that completely covered the ground. The storm finally weakened as it moved out over Lake Michigan by 7 pm.
Figure 1 (above). WSR-88D radar composite of isolated severe storm that moved from Iowa to eastern Wisconsin.
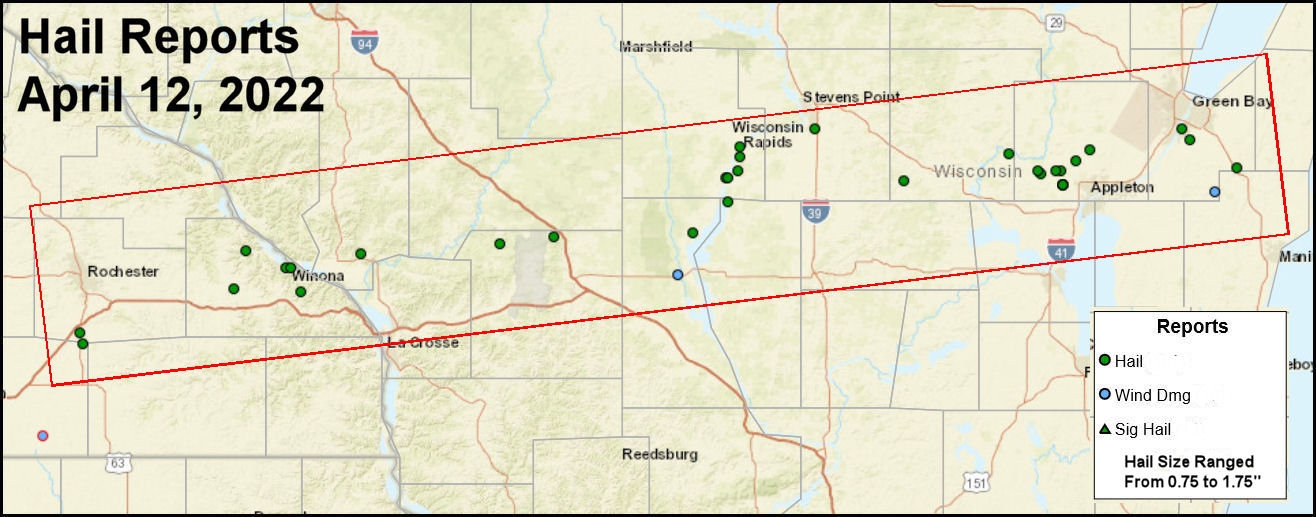
Figure 2 (above). Preliminary hail reports between 130 pm and 7 pm. Green dots are the hail reports.
Environment
Two key ingredients that contributed to the formation and maintenance of the long-lived severe hail storm were very rapid northward transport of moisture aloft and rapid increase in the mid-level winds.
The storm developed well north of a surface warm front that was situated from northeast Nebraska to southwest Iowa. The storm was strongly elevated. This means the primary inflow of relatively moist and unstable air feeding the storm was located above a cool surface-based stable layer north of the surface frontal boundary (Figure 3). The heavy black arrow in Figure 3 denotes the approximate path of the storm which remained well north of the frontal boundary during its lifecycle.
As mentioned earlier, the storm first developed over extreme northern Iowa around noontime Tuesday. Figure 4 is a RAP analysis of low-level moisture transport roughly 4000 feet above the ground. The red colors indicate where the greatest moisture was located. The arrows denote the magnitude and direction in which the moisture was being transported. The longer the arrow, the stronger the northward moisture transport (moisture flux). The storms developed in the region of very strong northward moisture transport near the Minnesota-Iowa border. This allowed the atmospheric layer above the cool surface airmass (north of the warm front) to rapidly destabilize. This elevated layer of unstable air continued to surge northward and fed the isolated severe thunderstorm that raced across Wisconsin during the afternoon.
The other key ingredient was the strength of the mid-level winds. The winds at approximately 9000 feet above the ground are shown in Figure 5. The brown colored shades indicated winds near this level were in the 65-70 knot range. The winds over east-central Wisconsin increased rapidly from 25 knots to 65 knots during the afternoon. The strong winds created a favorable wind shear environment that help to maintain a very strong updraft in the storm that could support large hail.
In summary, the combination of rapid northward transport of moisture (and instability), in concert with rapidly increasing mid-level winds, created a very favorable environment to support and sustain vigorous thunderstorm updrafts that could support large hail.
Figure 3 (above). 3 pm surface pressure analysis (black lines) with warm front denoted in red and cold front
denoted in blue. Surface wind barbs (light brown) are overlaid.
![]()
Figure 4 (above). Moisture transport at roughly 4000 feet above the surface. The animation is from 1 pm to 6 pm.
Shaded area denotes notable moisture at that level and the arrows indicate the direction and strength of the moisture
transport. The longer the arrow, the stronger the moisture transport.
Figure 5 (above). RAP analysis of winds at approximately 9000 feet above the ground. The animation is from 1 pm to 6 pm.
The light brown solid lines denote the temperature lapse rate in the 700-500 mb layer greater than 7 deg/km. It is an indicator
of strong instability aloft. The leading edge of that instability was pushing north into east-central Wisconsin during the day.
Satellite Perspective
The satellite animation shown in Figure 6 below is a a special type of imagery (sandwich product) the combines the visible and infrared wavelengths to help highlight cloud features during the daytime. Thick middle and upper-level clouds are in yellowish tones and dark orange tones indicate very deep clouds associated with thunderstorms. The black rectangle denoted in the animation in Figure 6 highlights the area where the hail storm first developed. Note how quickly the storm developed and expanded as it entered Wisconsin from the southwest. Note that there were initially two thunderstorm complexes, The northern storm weakened rapidly, while the southern storm (that had more direct access to the strong flux of moisture and instability) strengthened and persisted as it moved east across Wisconsin. Also note rapidly developing storms over northwest Iowa near the surface warm front that formed later in the afternoon.
The satellite animation in Figure 7 (below) is zoomed imagery over Wisconsin and shows the evolution of the storm as it moved from La Crosse to near Green Bay. The more textured region in the southern portion of the thunderstorm cloud shield is the location of the strongest updrafts in the storm. These are referred to as overshooting tops. Note also in the visible part of the imagery (white shades), we can also see an extensive low-level stratus deck in the wake of the thunderstorm. We can also see some bumpy lines of shallow convective-looking clouds orientated SW-NE that might suggest a flow of elevated instability feeding the storm. Finally, Figure 8 is a very high temporal resolution (rapid scan) visible satellite animation. There are many interesting features in this high resolution animation including rapidly forming convective towers being initiated along the warm front over southwest Iowa, thunderstorms also trying to fire along the cold front in Nebraska, wavy low-level stable clouds (billow clouds) over the northern half of Iowa indicative of a more stable airmass north of the warm front, and of course the lone elevated hail storm located much further away over Wisconsin. The storms that developed over eastern Nebraska and Iowa later in the day, produced widespread damaging winds, large hail and even a few tornadoes.
Figure 6 (above). Goes-16 enhanced imagery (sandwich product). Animation is from 10 am to 6 pm.

Figure 7 (above). Same as Figure 6 except over Wisconsin. Animation from 4 pm to 6 pm.
Figure 8 (above). High temporal (approximately 1-2 minute) visible imagery. Animation from 3:45 pm - 5 pm.
Radar Overview
This was an interesting long-lived isolated storm. During its lifecycle, the storm appeared to morph between supercell and quasi-linear characteristics. The radar animation in Figure 9 below best illustrates this somewhat odd morphology as it moved east of La Crosse. As the storm approached the Green Bay area (Figure 10), it appeared to transition to more of a classic bowing line segment. Regardless of the reflectivity morphology, the storms primary impact was large hail. There were a couple isolated reports of some minor wind damage with this storm but given the elevated nature of the storm, it was a bit more challenging for the storm to transport strong winds to the surface. Often times, classic hail storms will exhibit a large hail spike in the reflectivity data. The hail spike extending several miles to the southwest of the storm (Figure 11), emanated from the primary elevated hail core in the storm updraft region.
Figure 9 (above). NWS La Crosse radar view of the storm as it passed just north of the city of La Crosse.

Figure 10 above). NWS Green Bay radar perspective of hail storm as it passed between Appleton and Green Bay.

Figure 11 (above). NWS Green Bay radar view of a large hail spike emanating from the storm's hail core aloft.
Photos
Below are just a couple of photos of 0.50" to 1" hail stones covering the ground in the East De Pere area near Ledgeview. The photos were taken around 625 pm (Courtesy of Gene Brusky).


