Overview
|
Thunderstorms developed along a diffuse SW to NE orientated surface trough located just west of the Fox Valley during the late afternoon of Tuesday August 10, 2021. A very unstable airmass was also in place near the surface trough, along with sufficient vertical wind shear to sustain scattered severe thunderstorms. The initial storms developed rapidly, producing a brief EF-1 tornado with maximum estimated wind speeds of 90 mph in Outagamie County northwest of Black Creek. The tornado dissipated 13 minutes later after traveling just over 2 miles. No injuries or fatalities were reported. The storms quickly grew upscale, organizing into a quasi-linear system as they moved across the Green Bay and Fox Valley areas producing scattered straight-line wind damage and torrential downpours. Rainfall rates of 1-2 inches per hour created localized urban flooding in and around the Green Bay area into the early evening hours.
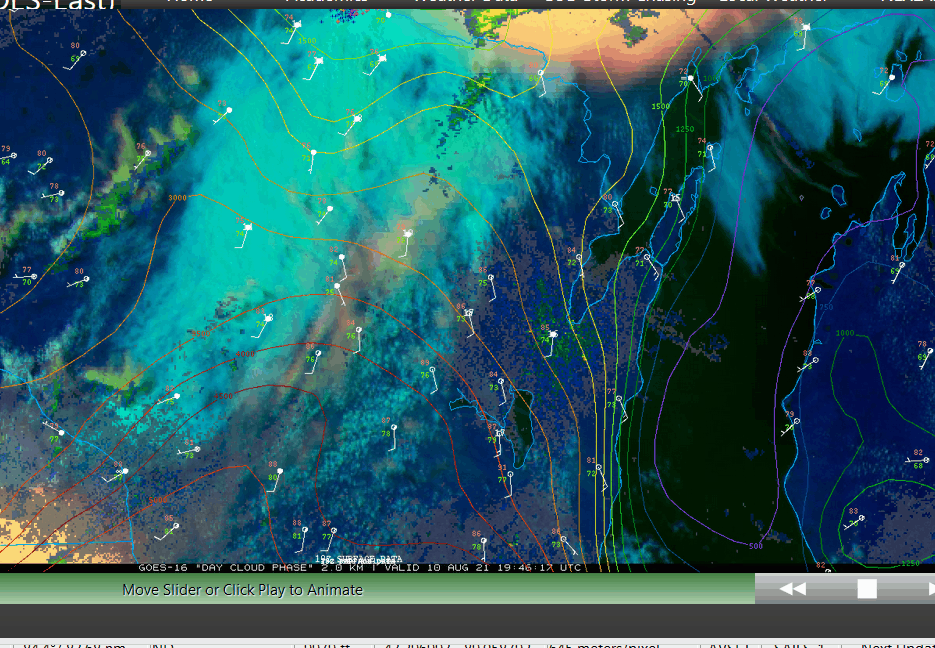
Environmental Overview During the late morning and early afternoon hours, the atmosphere destabilized rapidly along a SW-NE orientated surface trough situated just west of the Green Bay and Fox Valley areas. Note the broad confluence/convergent pattern in the near surface wind flow characterized by WSW flow over central Wisconsin and SE flow over eastern Wisconsin (Image 3 below). In this region surface-based CAPE (measure of atmospheric buoyancy) was increasing to 4000 to 4500 J/kg. Also note the more agitated cumulus clouds starting to grow in this area, especially west of the Green Bay area. The developing storms are just starting to turn yellowish-orange in color indicating that they are growing tall enough to generate ice crystals in the middle and upper portions of the cloud to initiate electrical activity. The last frame in the animation is at 436 pm CDT, about 85 minutes prior to the tornado.
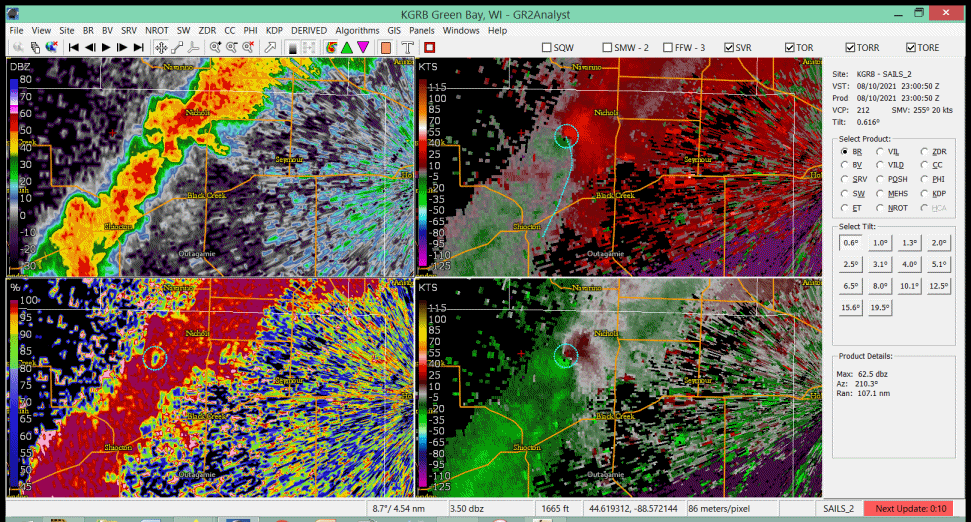
Radar Evolution In the discussion below, because the storms evolved close to the NWS Green Bay Doppler Radar (15-25 nm), we are able to discern details of the storm evolution that otherwise would not be resolvable at much further ranges from the radar. The radar animation below (image 4) illustrates the time period up to the time of tornadogenesis (~ 6 pm CDT 8/10/21). The storm in the dotted circle is the initial supercell storm that had persistent mid-level rotation (upper-right panel). The dotted line denotes a fine-line feature approaching from the west. This feature can be thought of as a region of near-surface localized convergence and enhanced near surface vorticity. Thunderstorm initiation often occurs along such fine-lines. In fact you can see a new cell develop just to the north of Navarino in the upper-left panel below. As the fine-line (dotted line) nears and becomes collocated with the mid-level mesocyclone (dotted circle), we see a very rapid tightening of the circulation (tornadogenesis). By the last frame of the animation, a tornado is already on the ground just south of Nichols. This illustrates that it is not enough to have a mid-level mesocyclone to get a tornado. The mesocyclone also needs to become co-located with a near-surface source of vorticity (analogous to that shown below) that can be ingested into the storm updraft at low-levels. The atmosphere was so unstable that the updraft stretched the near surface vorticity upward rapidly, resulting in a rapid tightening and strengthening of the circulation (like an ice skater with arms initially outstretched, brings their arms in close to their body, thereby increasing their spin!). The resulting circulation became very deep, and immediately became evident through nearly the depth of the storm. A tornadic debris signature was also associated with the tornado, reaching a height of nearly 8000 Ft AGL! Fortunately, the tornado was brief.
The radar animation below (Image 5) shows the evolution of the tornadic storm from shortly after tornadogenesis through its dissipation. This radar animations shows how quickly the tornadic storm got cutoff from its low-level inflow as strong cool outflow quickly undercut the circulation leading to its demise. Inbound radial velocities are denoted by the green colors. The NWS Green Bay radar is located on the far right side of the images. The blue dotted line in the animation below denotes the leading edge of the cool thunderstorm outflow. As this outflow congeals, note how the character of the storm quickly evolved from a semi-discrete line of storms to a more continuous line of convection approaching the Green Bay area. The advancing gust front produced isolated to scattered straight-line wind damage along its path from near Green Bay to the lakeshore. Given the tremendous amount of moisture in the atmosphere on this day, the storms were also very efficient rainfall producers, generating rainfall rates of 1-2 inches per hour. The high rainfall rates led to urban and low-land flooding in parts of Brown County a little later in the evening.
|
Tornado:
|
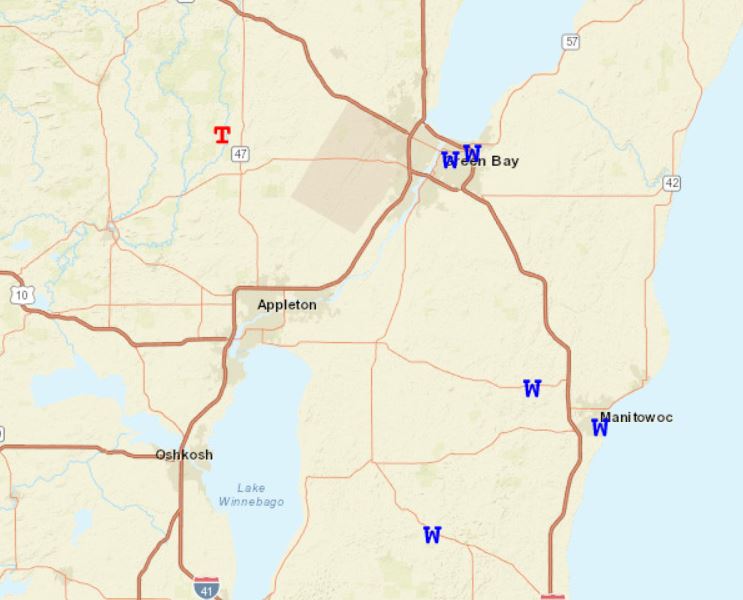
Tornado - NW of Black Creek
Track Map 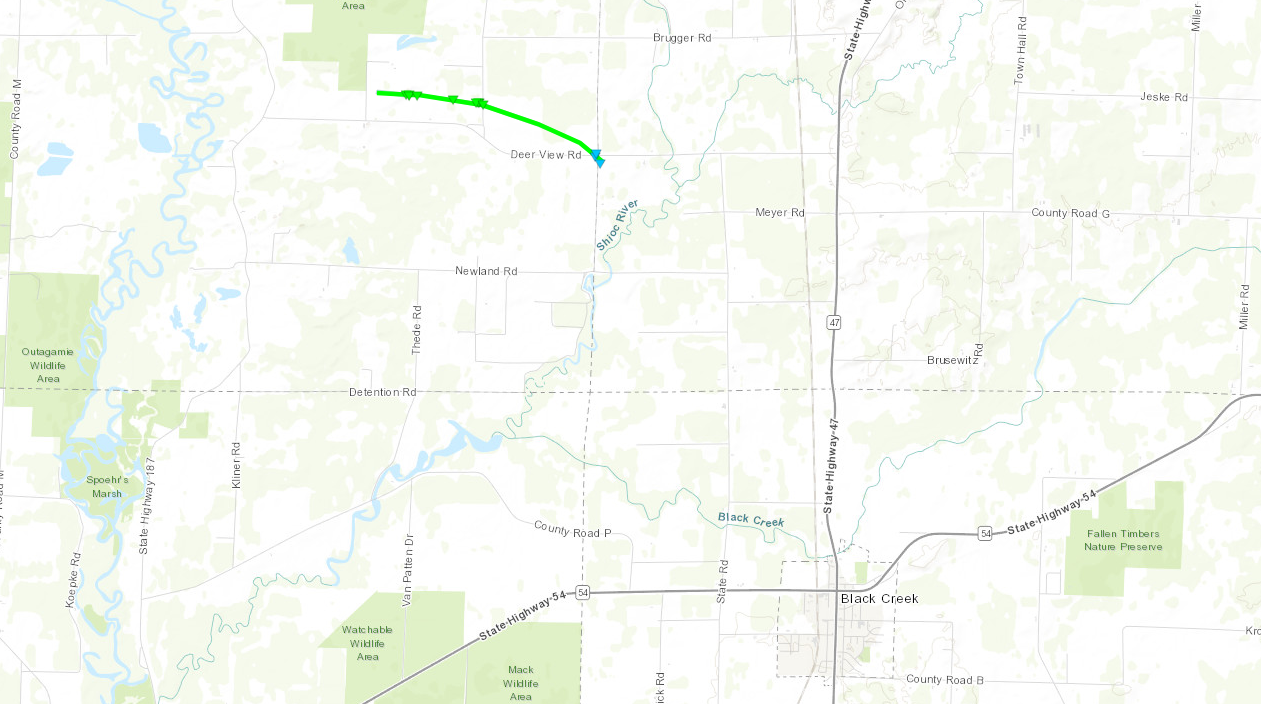 
|
||||||||||||||||
The Enhanced Fujita (EF) Scale classifies tornadoes into the following categories:
| EF0 Weak 65-85 mph |
EF1 Moderate 86-110 mph |
EF2 Significant 111-135 mph |
EF3 Severe 136-165 mph |
EF4 Extreme 166-200 mph |
EF5 Catastrophic 200+ mph |
 |
|||||
Photos
Photos from the NWS Damage Survey
 |
 |
| EF-1 Tornado- House Damaged (NWS Green Bay Damage Survey) |
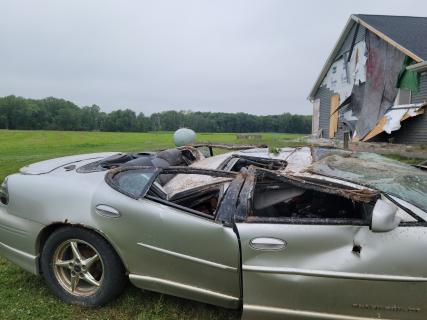
EF-1 Tornado- Car Flipped (NWS Green Bay Damage Survey) |
 |
 |
| EF-1 Tornado- Tree Uprooted (NWS Green Bay Damage Survey) |
EF-1 Tornado- Tree Branches Snapped (NWS Green Bay Damage Survey) |
 |
Media use of NWS Web News Stories is encouraged! Please acknowledge the NWS as the source of any news information accessed from this site. |
|


.gif)