|
Burlington Halloween Climatology
Period of Record 119 Years: 1904-2023
Missing: 1907
Temperature Information
| Record High |
85°F (1950) |
| Record Low |
10°F
(1905, 1991, & 1993) |
| Coldest High Temperature |
14°F (1991) |
| Warmest Low Temperature |
46°F (1995) |
Average High
(Period of Record) |
59.2°F |
Average Low
(Period of Record) |
30.5°F |
30 year Normal High
(1992-2023) |
61.1°F |
30 year Normal Low
(1992-2023) |
32.2°F |
|
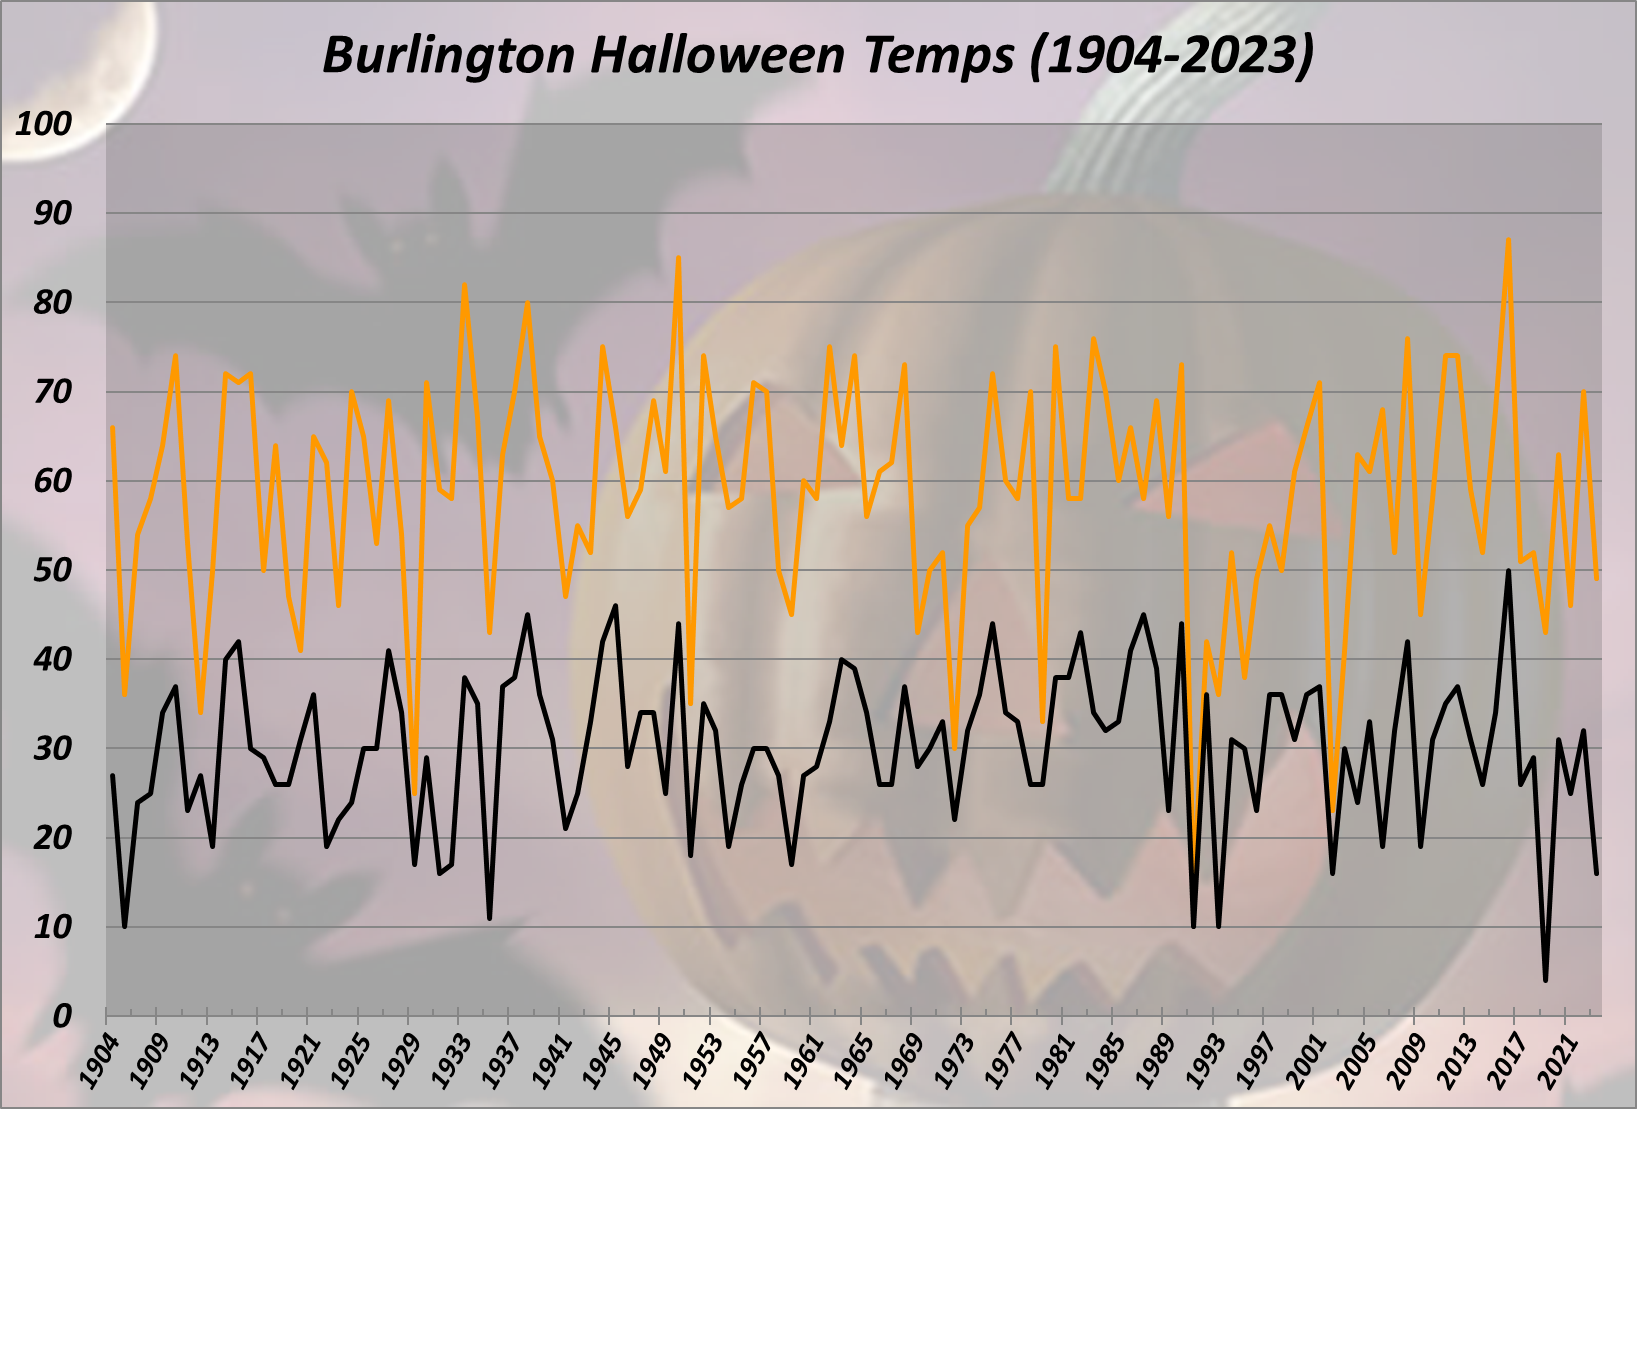
(Click image for a larger version)
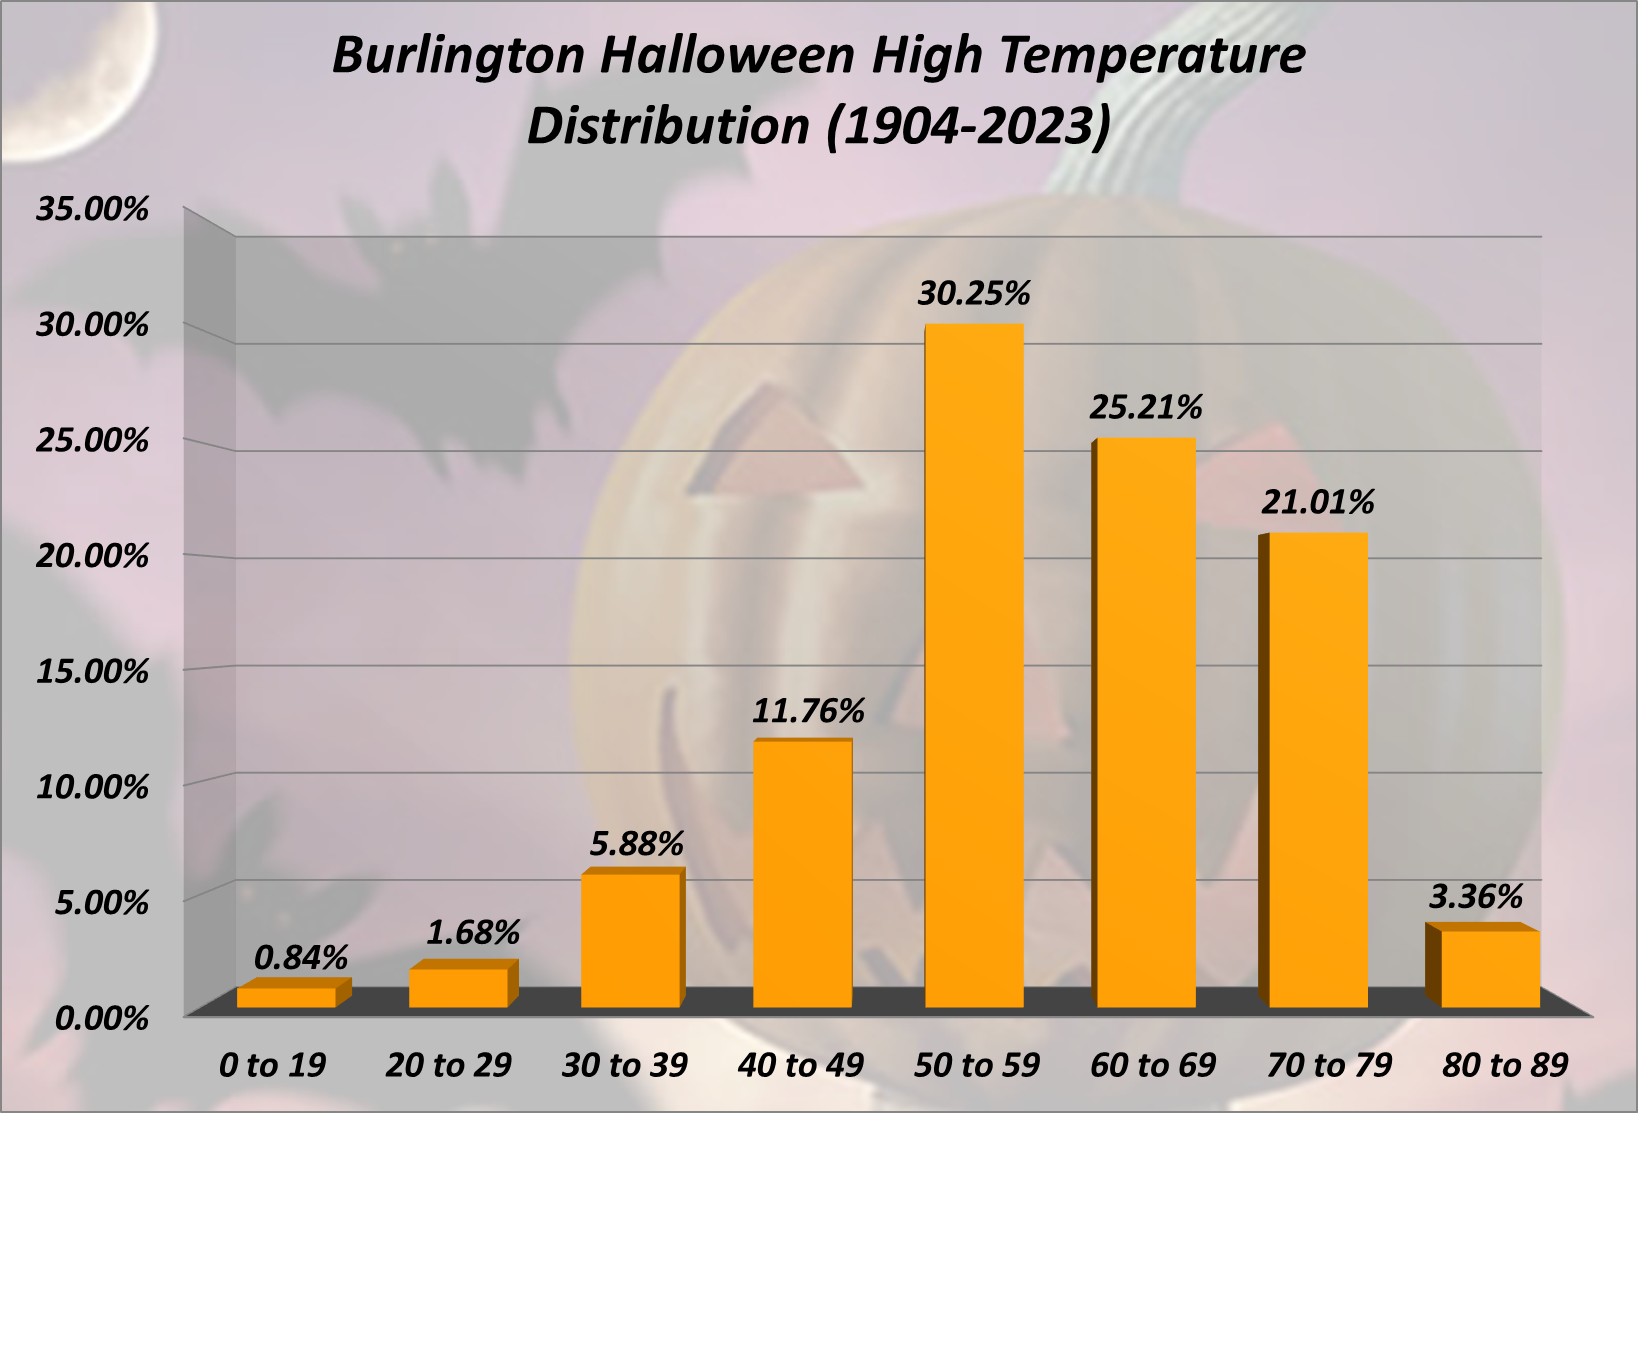
Distribution of High Temperatures in 10 Degree Fahrenheit Ranges
(Click image for a larger version)
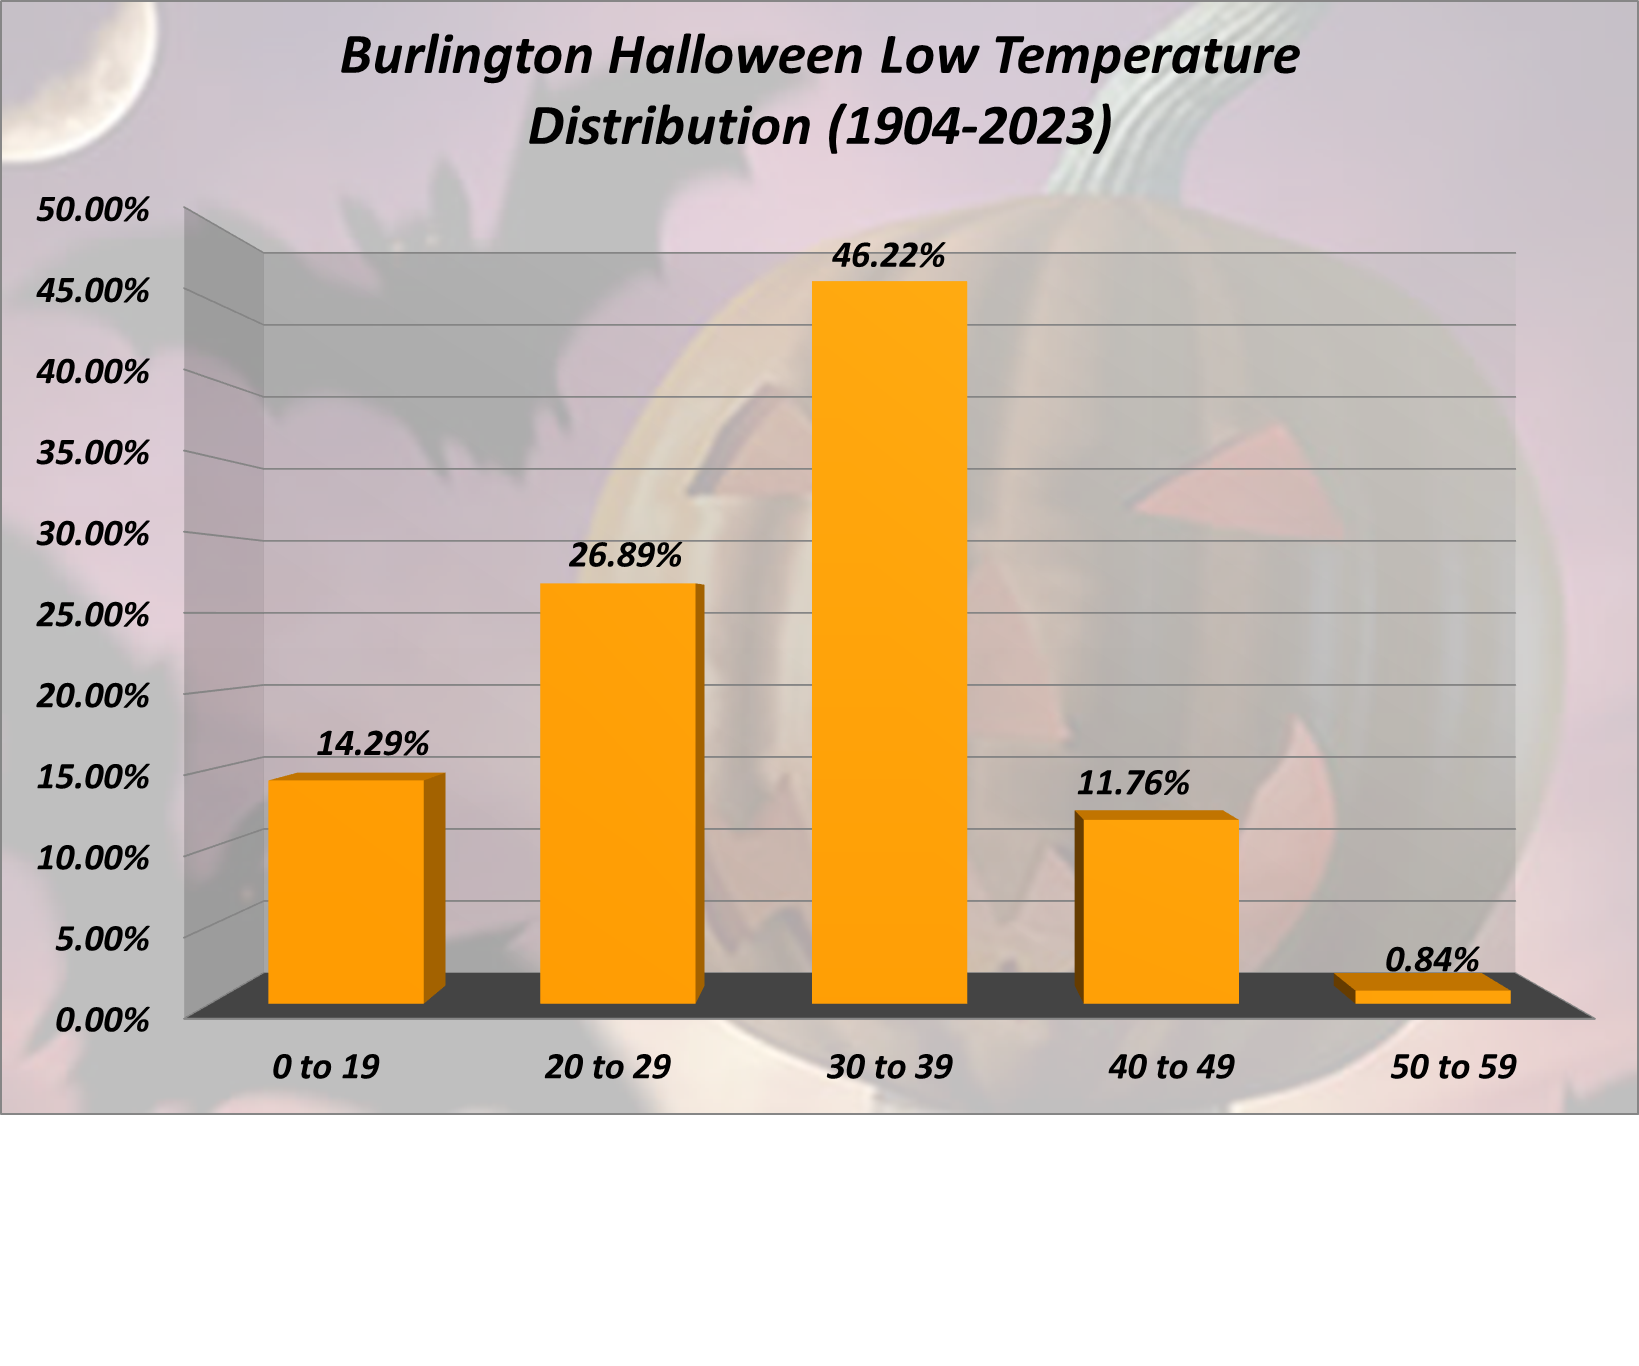
Distribution of Low Temperatures in 10 Degree Fahrenheit Ranges
(Click image for a larger version)
Precipitation Information
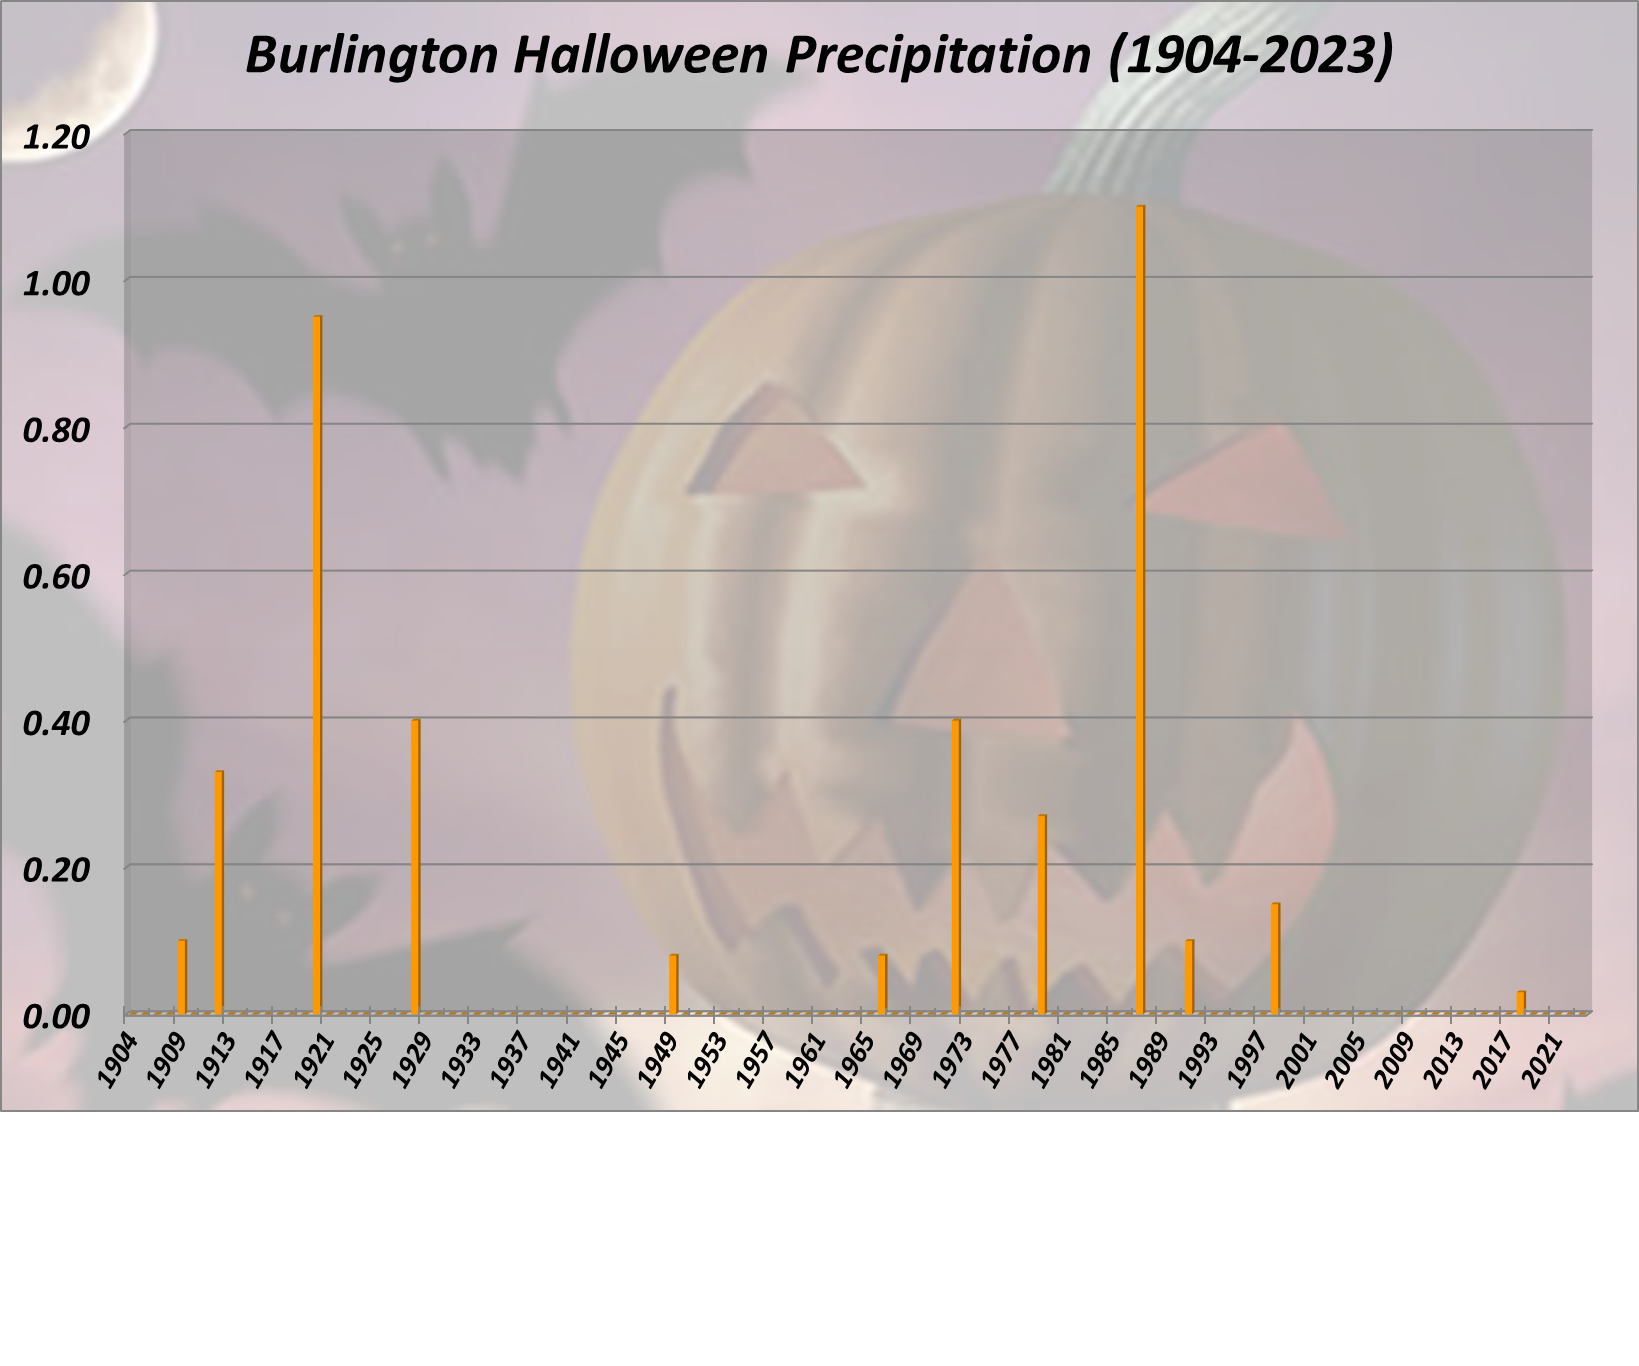
| Greatest Precipitation |
1.10” (1987) |
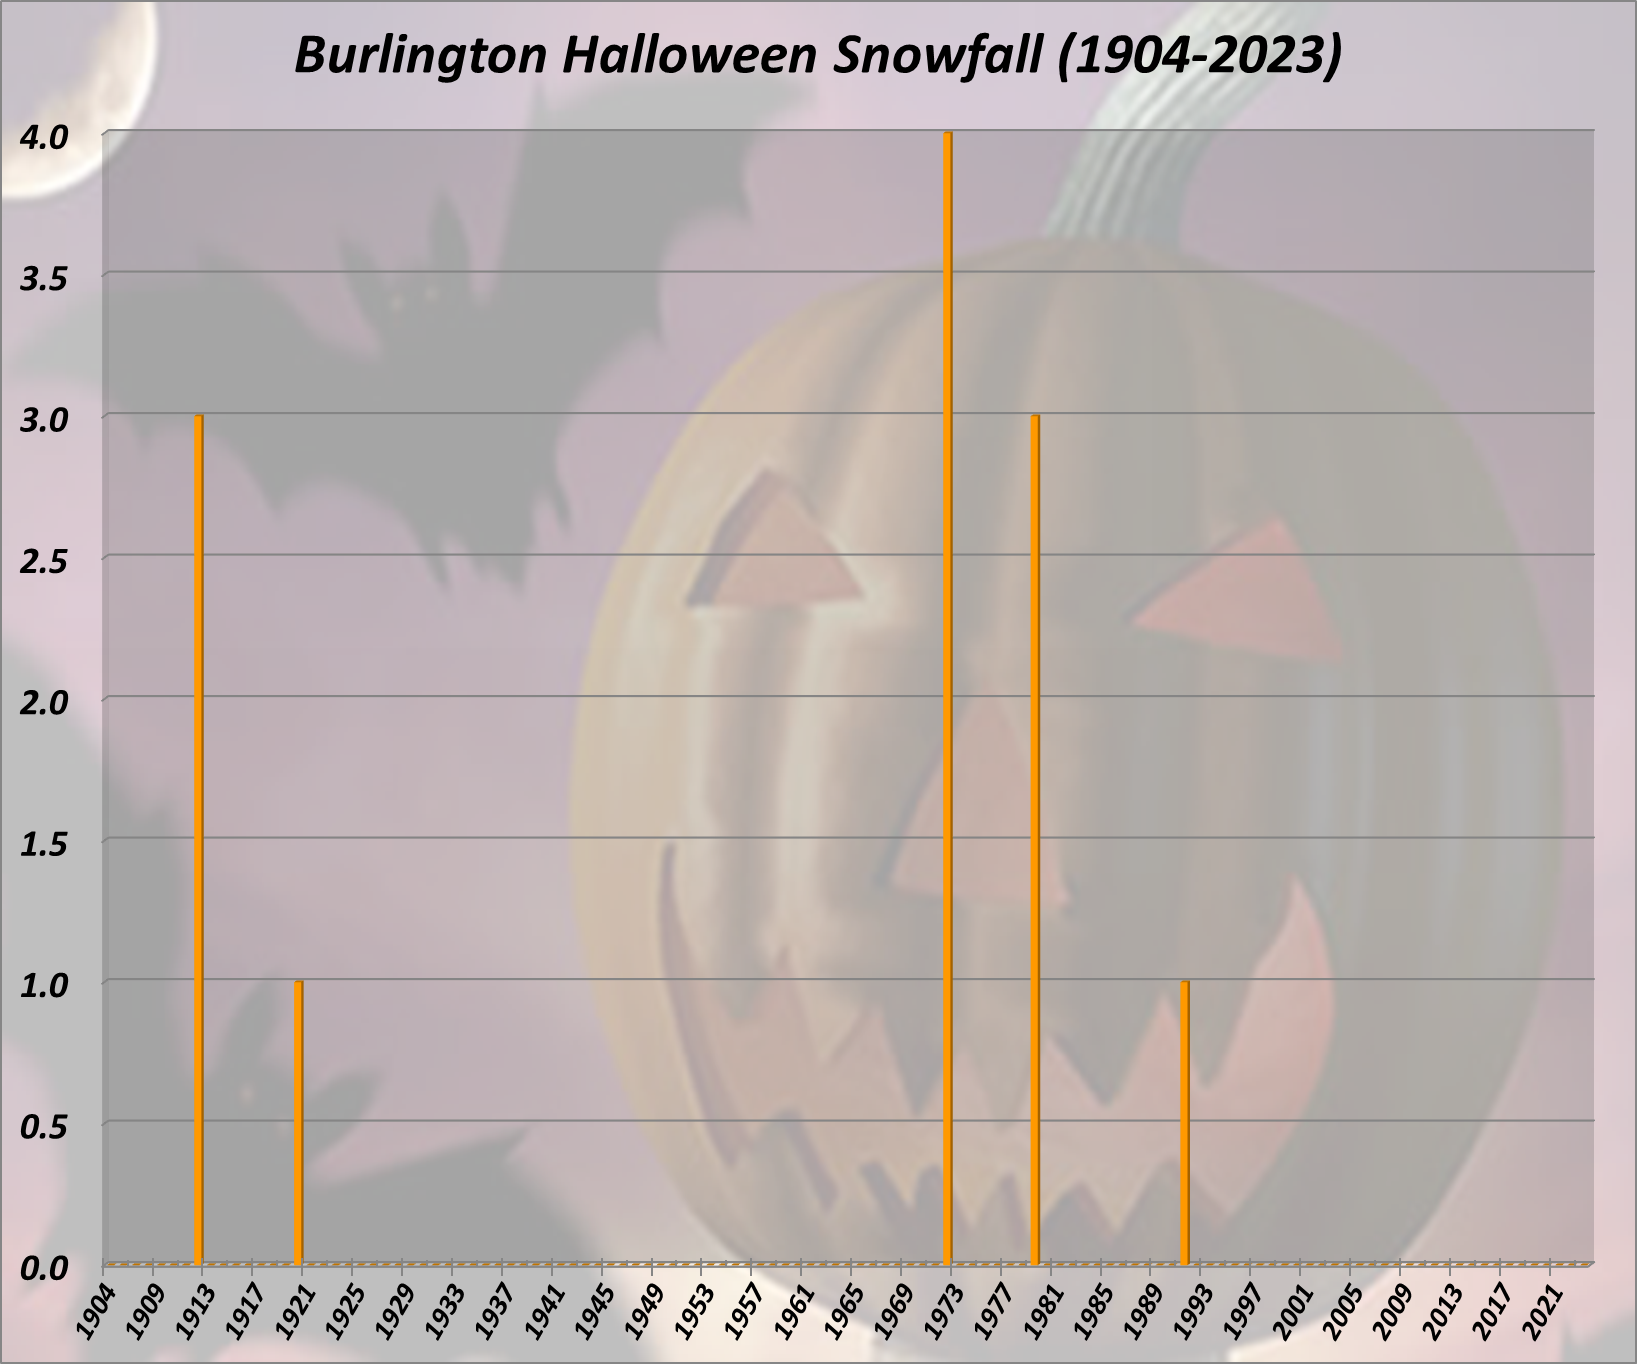
| Greatest Snowfall |
4.0” (1972) |
| Precipitation |
19 of 119 years
16% |
Measurable Precipitation
(more than a Trace) |
11 of 119 years
9.2% |
| Snowfall |
6 of 119 years
5.0% |
Measurable Snowfall
(more than a Trace) |
5 of 119 years
4.2% |
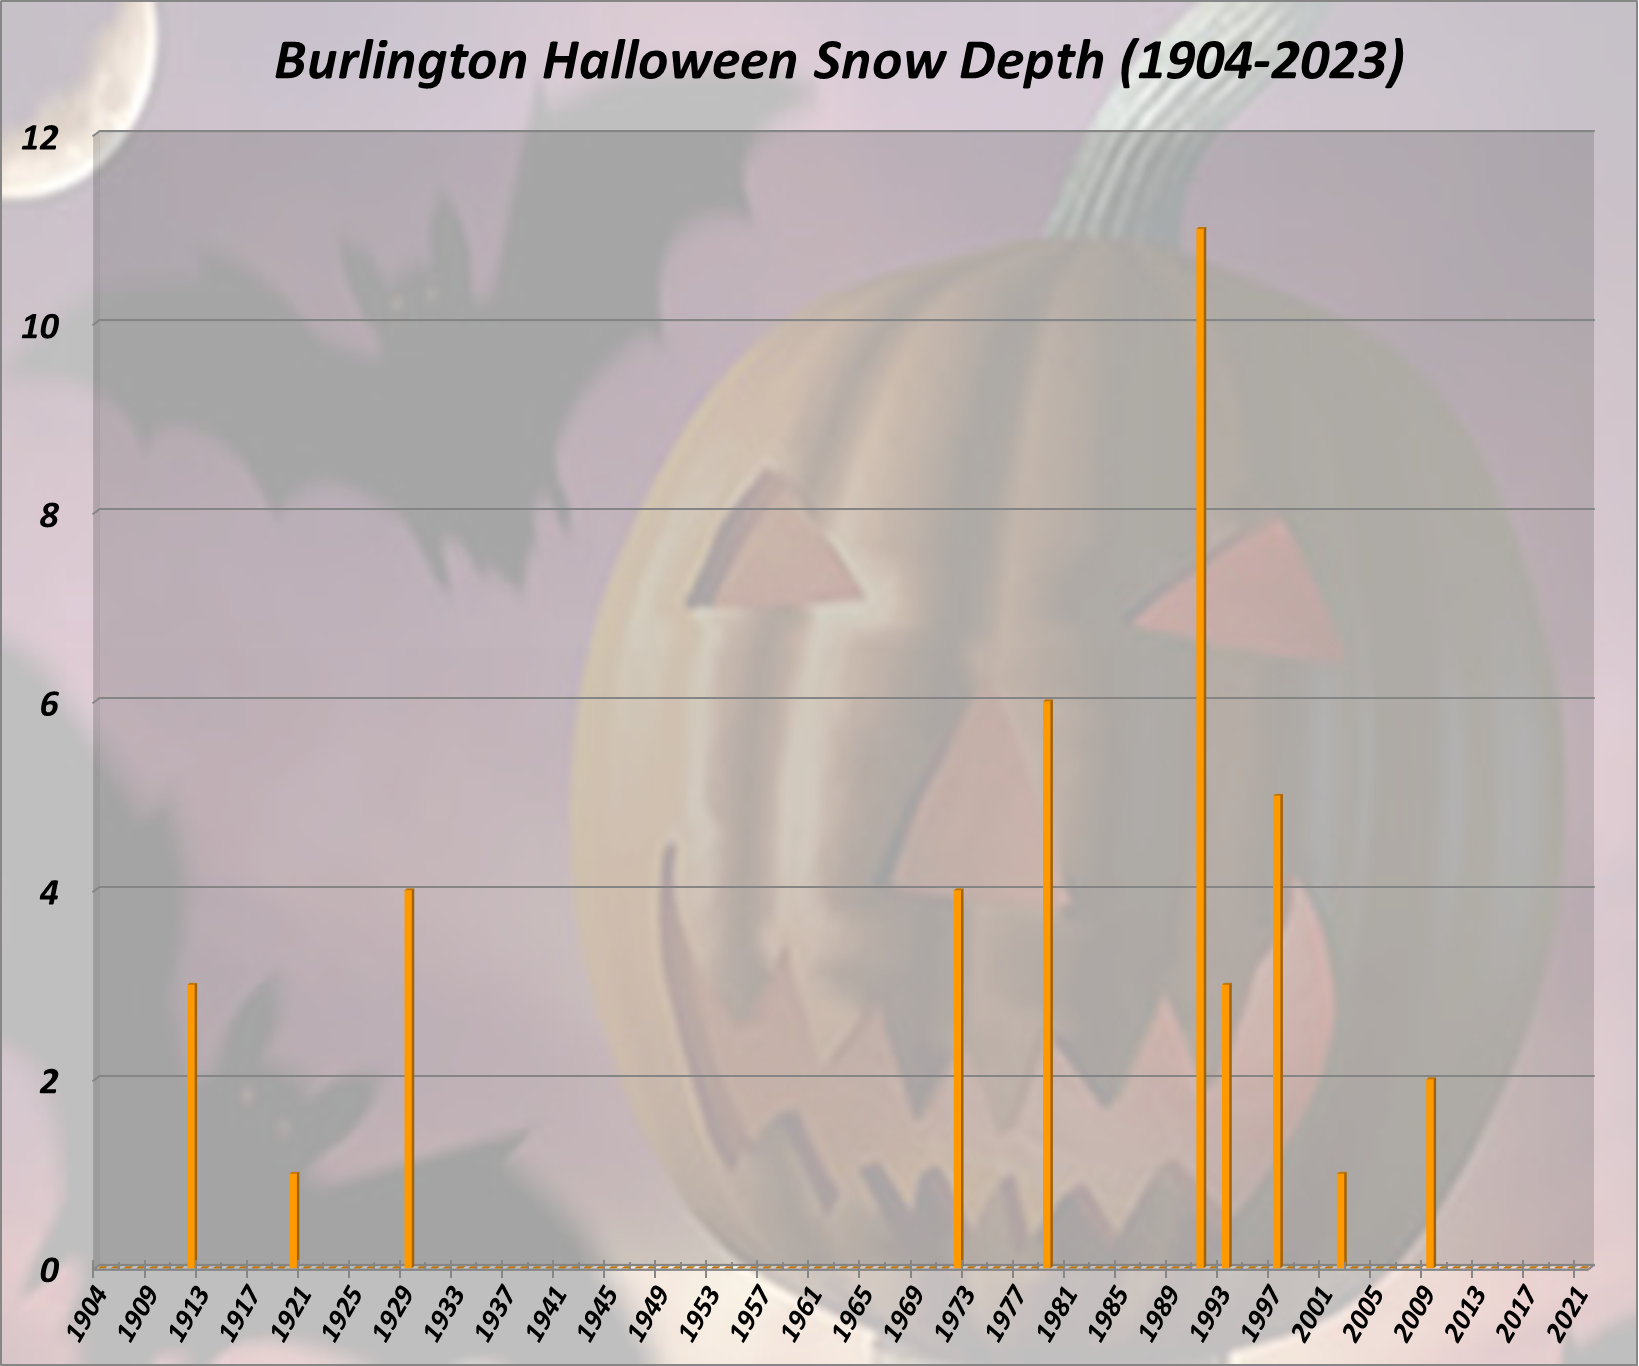
| Greatest Snow Depth |
11” (1991) |
“White” Halloween
(Snow Depth of 1” or more) |
10 of 119 years
8.4% |
|
(Click image for a larger version)
(Click image for a larger version)
(Click image for a larger version)
GOODLAND HALLOWEEN DAY CLIMATOLOGY
HILL CITY HALLOWEEN DAY CLIMATOLOGY
MCCOOK HALLOWEEN DAY CLIMATOLOGY
For additional holiday climate studies, return to the main menu
Updated November 18th, 2023
NWS Goodland
|