The purpose of these experimental probabilistic snowfall and ice accumulations products is to provide customers and partners a range of snowfall possibilities, in complement to existing NWS deterministic snowfall graphics, in order to better communicate forecast uncertainties during winter weather events.
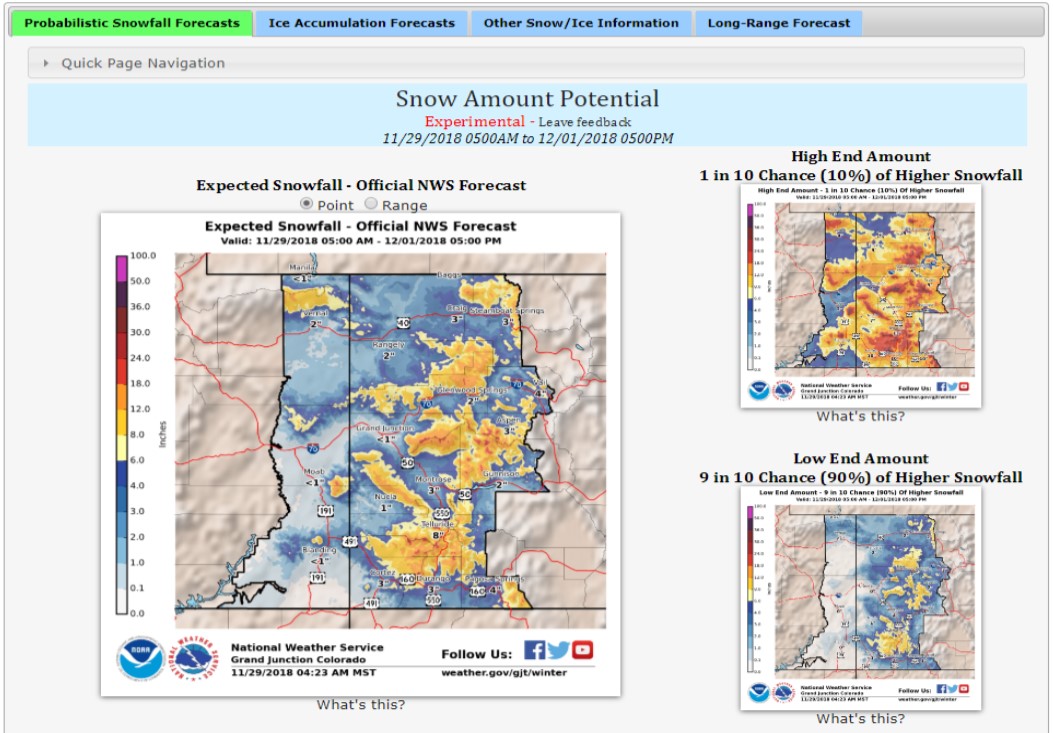
The target audiences for these experimental products are customers and partners such as emergency managers, state and local officials including school superintendents, DOT, media and the general public. After the first set of graphics showing the Snow Amount Potential, we provide you graphics that show snowfall threshold amounts in inches with color curve probabilities from zero to 100 percent, and finally a text-based range potential and exceedance probability table for specific locations.
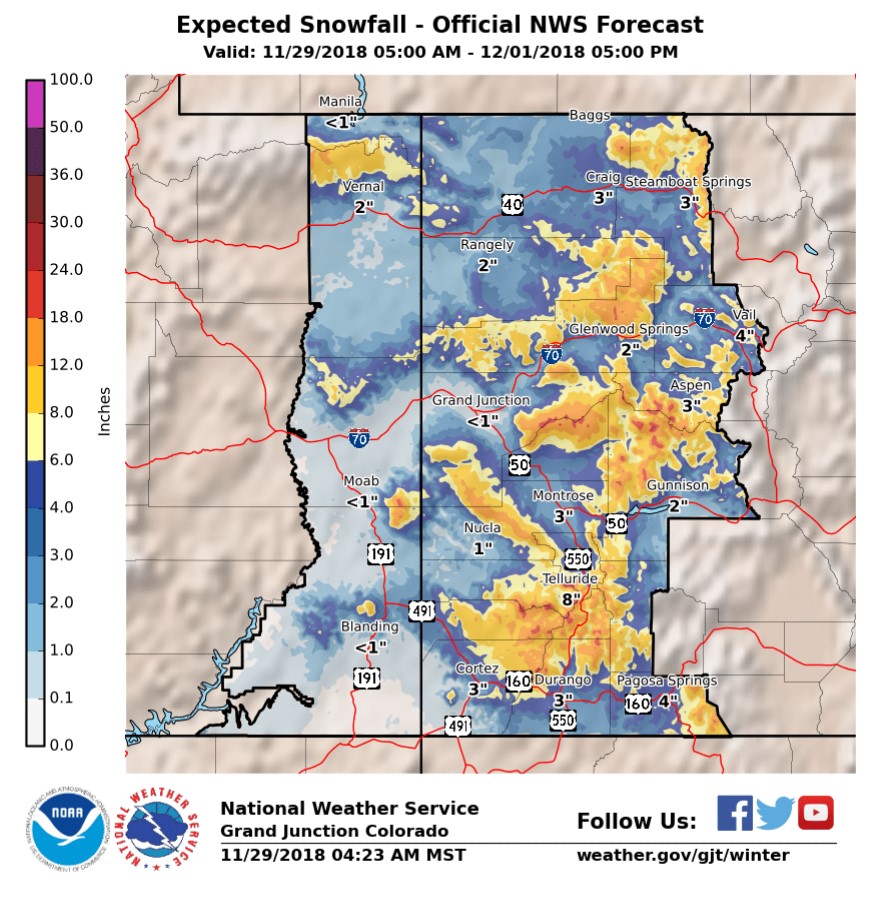
This is the official or “expected” snowfall forecast graphic. Below, we will illustrate that while we deliver an “expected” snowfall forecast, there is still a range of possibilities that are important to consider when making your decisions.
The format for the first probabilistic snowfall graphics is:
· Official Forecast (shown above)
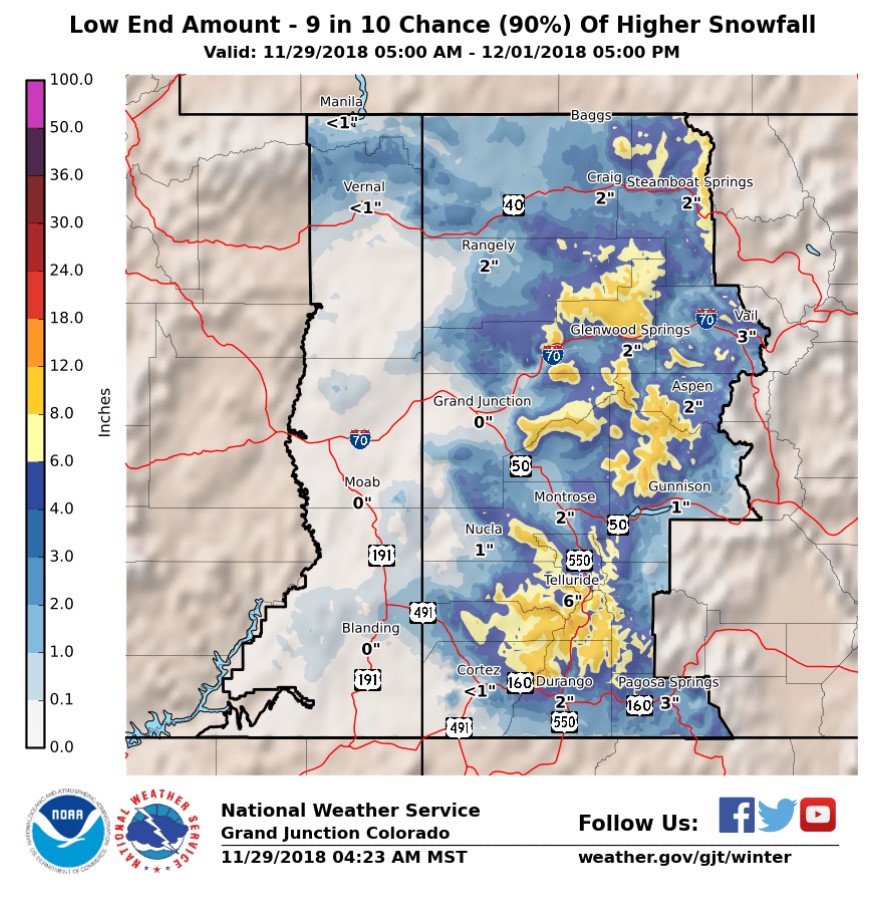
· Low End Amount - 9 in 10 Chance (90%) of Higher Snowfall (below)
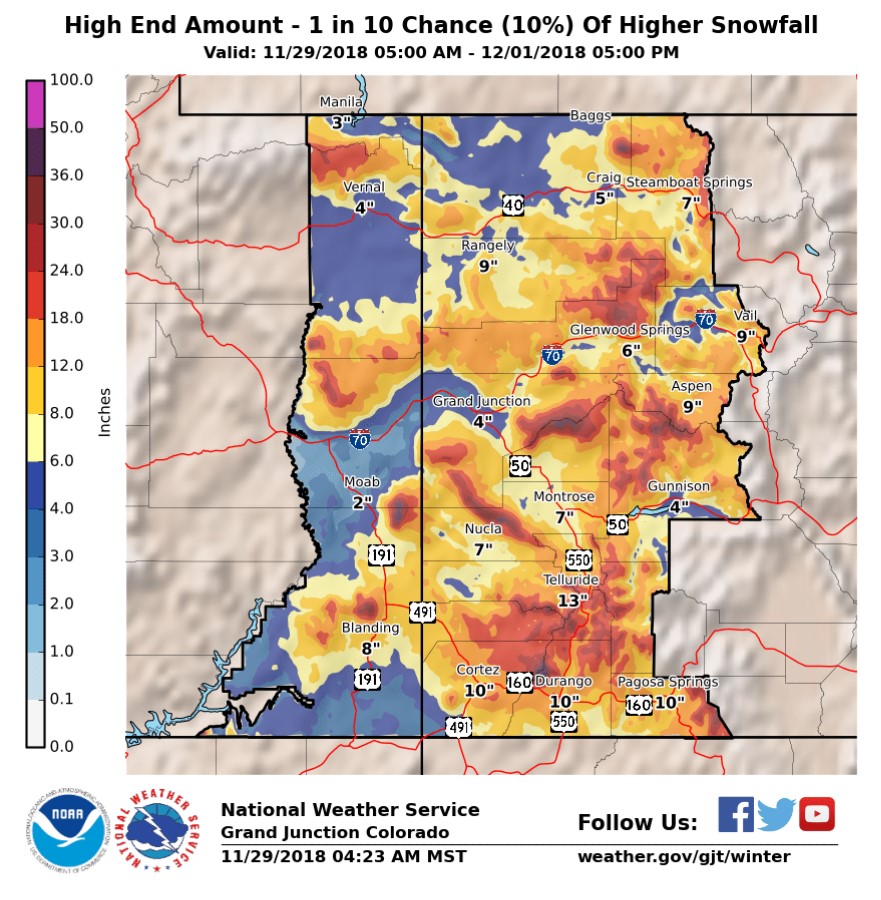
· High End Amount - Only a 1 in 10 Chance (10%) of Higher Snowfall (second photo below).
These graphics help you understand the range of possibilities while also giving you what we think has the best chance of occurring (official forecast).
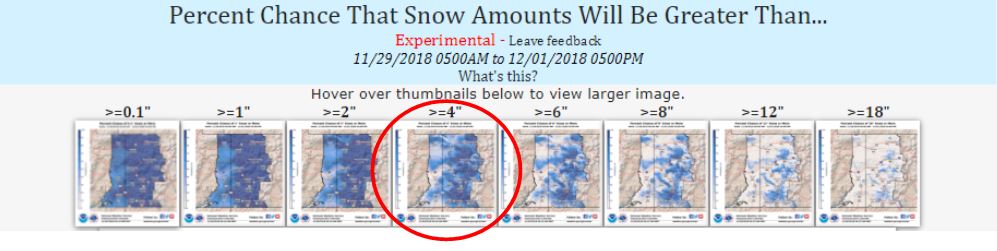
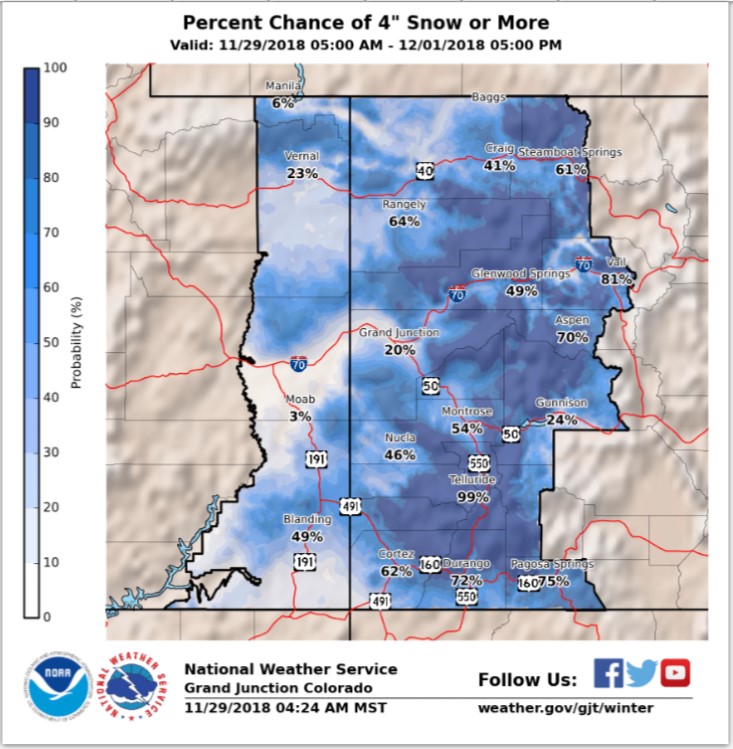
The next graphic shows the probabilities of exceeding certain snowfall threshold amounts in inches with color curve probabilities from zero to 100 percent in eastern Utah and western Colorado.
In this example, clicking on the thumbnail picture with the >= 4” threshold displays an enlarged image of that frame below, for the period ending at 5 PM December 1, 2018. For Grand Junction, there is a 20% chance of exceeding 4” of snowfall during the labeled period. For Durango, the chance of exceeding 4” of snowfall is 72%.
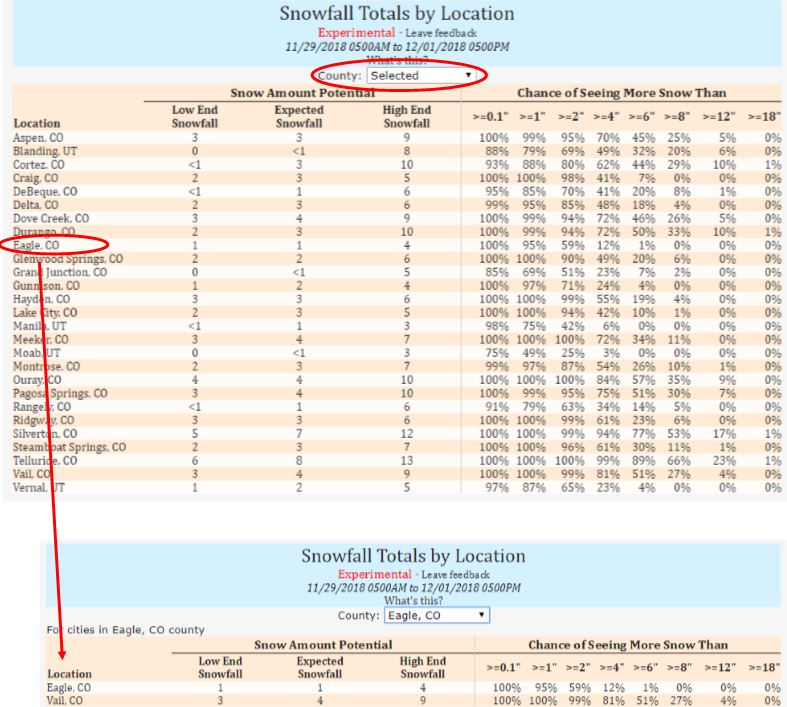
The final product is a text-based exceedance probability table for cities in eastern Utah and western Colorado. A wide range between minimum and maximum snow amounts indicates large uncertainty in the forecast. Conversely, a narrow range indicates high confidence in the forecast.
Selecting a county displays a list of specific cities within that county and shows the probability of snow amounts exceeding a particular threshold for each location. The table can be switched to portray the probability of snow amounts falling within specific range bins as well, as shown below:
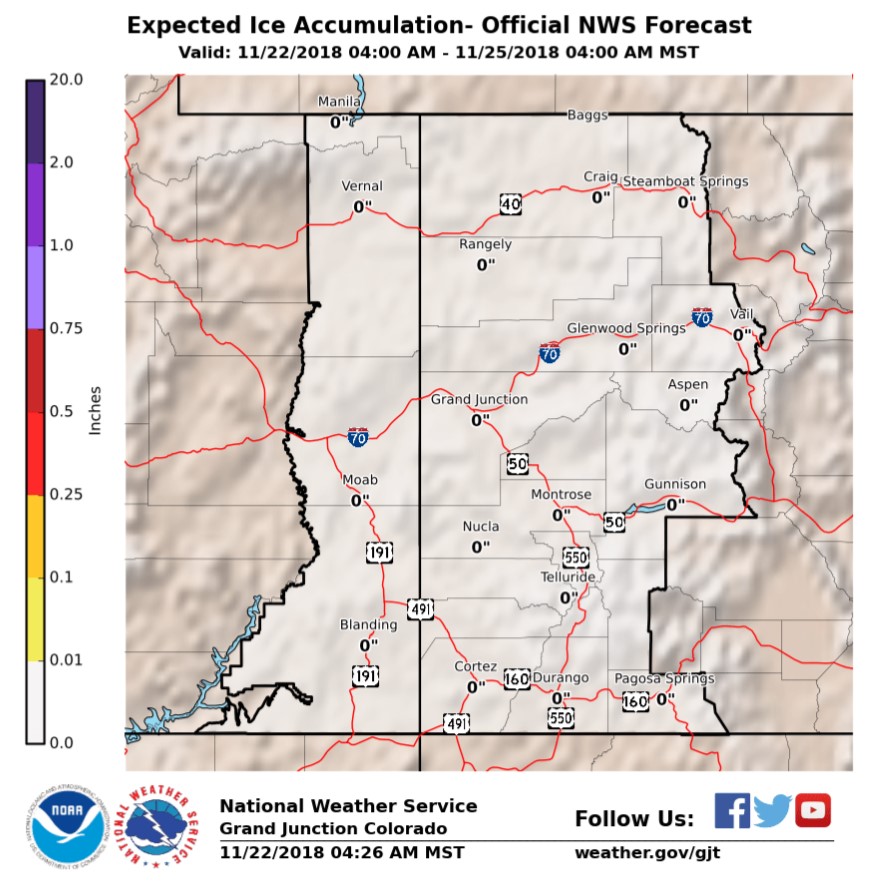
There is an “Expected Ice Accumulation” graphic as well. Usually, this will show “zeros” for eastern Utah and western Colorado, but there are instances where light ice accumulation could be forecast.
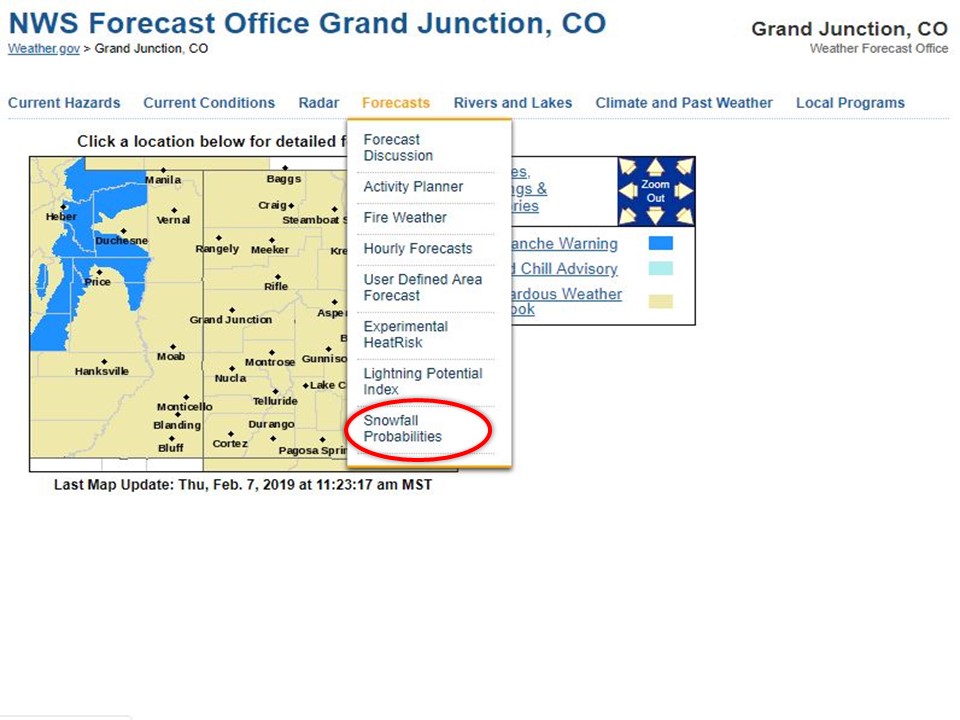
Where can you find the Snowfall Probabilities Experimental Product? A link is found in the Forecasts menu above the clickable map near the top of our NWS Grand Junction, Colorado website homepage. “Snowfall Probabilities” is at the bottom of the sub-menu that pops up.
If you have any additional questions on how to use or interpret the new probabilistic snowfall and ice accumulation forecasts, don’t hesitate calling us at 970-243-7007 or email us at wxgjt@noaa.gov.

