
Dry and windy conditions will bring widespread fire weather concerns to the northern/central Plains and portions of the Southwest into the southern Plains. Severe thunderstorms with large hail and damaging wind gusts are possible over the central Plains today into this weekend. Rain and high elevation snow is expected over parts of the Cascades and Northern Intermountain Region through Saturday. Read More >
The Winter of 2019 will be remembered by most who live in Colorado as one of epic proportions. Not only did the majority of mountain areas see above normal snowpack for the season, but the amount of moisture helped to significantly reduce the extreme drought conditions during the summer of 2018 practically eliminating the drought conditions across the state by Spring of 2019. This above normal snowpack saw a dramatic increase from February through March as a series of Pacific storms pummeled the state, resulting in heavy wet snow on top of an already deep snowpack. This resulted in a significant avalanche cycle in the mountains of Colorado where pretty much every avalanche path ran, including newly discovered paths and paths that haven’t ran in a very long time.
This very active weather pattern was driven by several atmospheric river events, resulting in higher amounts of moisture and warmer temperatures. An atmospheric river is a flowing column of water vapor in the atmosphere that is responsible for producing significant amounts of rain and snow, especially when directed towards mountains. Another reason for the increase in snowfall was a very active pattern of the Madden Julian Oscillation which, when combined with atmospheric river activity, leads to an increase in enhanced lift and orographic snowfall in the mountains.
One to three feet of snow fell with each storm event in the mountains, with some areas seeing storm totals greater than three feet. Among the more notable of the hundreds of avalanches that occurred from mid February to mid March was a natural avalanche that occurred on Interstate 70 over Vail Pass during the March 6 to 8 storm event, which was measured at 6 feet deep. After mitigation was completed, this brought more snow down, resulting in a total depth of 15 feet with a path about 100 feet wide covering both east and westbound lanes. The avalanche danger was very high, resulting in the closure of Red Mountain Pass in the San Juan Mountains of Southwest Colorado from March 3rd through March 22nd. Extensive mitigation on Red Mountain Pass on March 10th brought down 40 to 60 feet of snow onto Highway 550, practically filling the Colorado Department of Transportation snow shed. To put in perspective how historic this natural avalanche cycle was, 1000 avalanches were reported to the Colorado Avalanche Information Center (CAIC) during the two week period during the first half of March 2019. 87 of these 1000 were of the class D4 or greater during this two week period. Only 24 avalanches of D4 or greater occurred from 2010 to 2018.
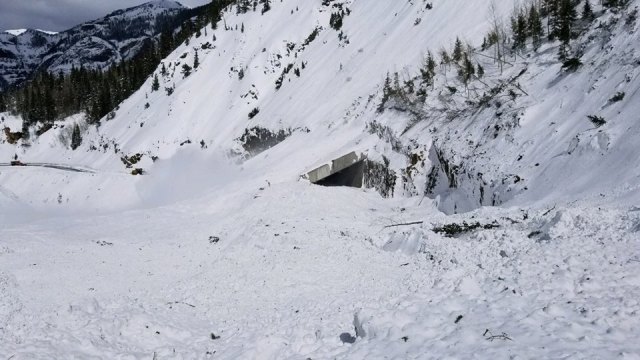
Photo of the buried snow shed on Highway 550 near Red Mountain Pass after avalanche mitigation brought down a total of 60 feet of snow. (Credit: CAIC/CDOT)
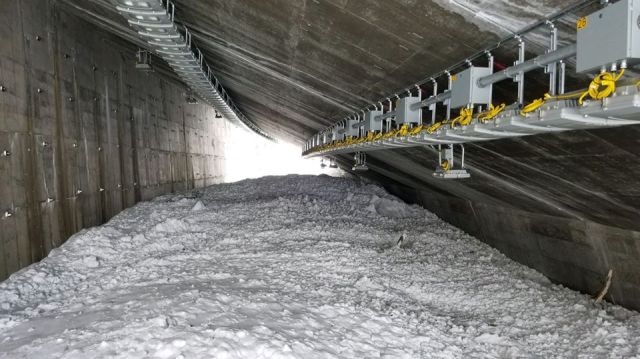
Photo from inside the snow shed on Highway 550 near Red Mountain Pass after avalanche mitigation brought down a total of 60 feet of snow. (Credit: CAIC/CDOT)
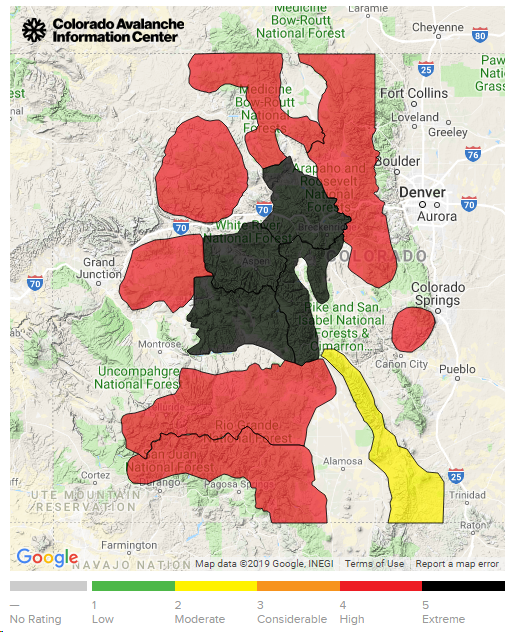
Map showing the avalanche danger as of March 7, 2019 from High to Extreme. (Source: CAIC)
Graphic showing the snowpack levels across the state of Colorado for Water Year 2019 (dark blue) compared to average (red) and previous few years. Notice the sharp increase from mid February through mid March. (Source: USDA)
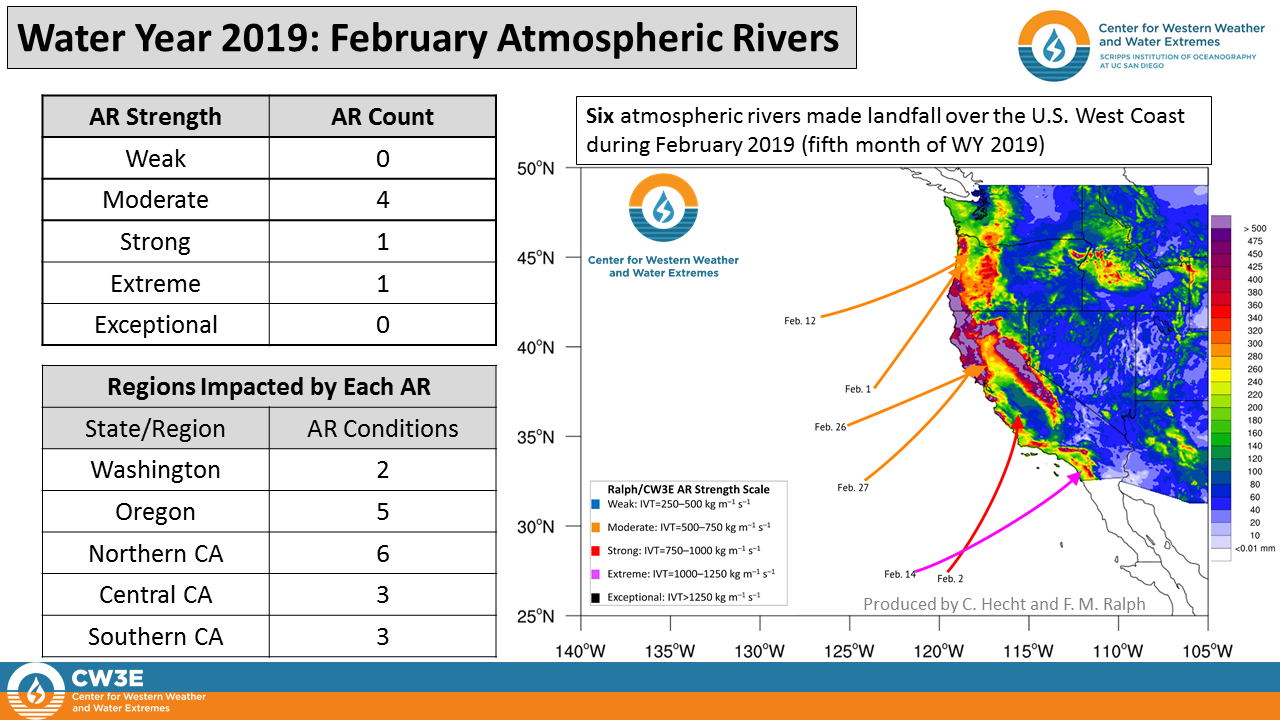
Graphic showing the atmospheric river events from February 2019, including the extreme AR event in mid February that brought significant snow to the Colorado mountains. (Source: Center for Western Weather and Water Extremes)
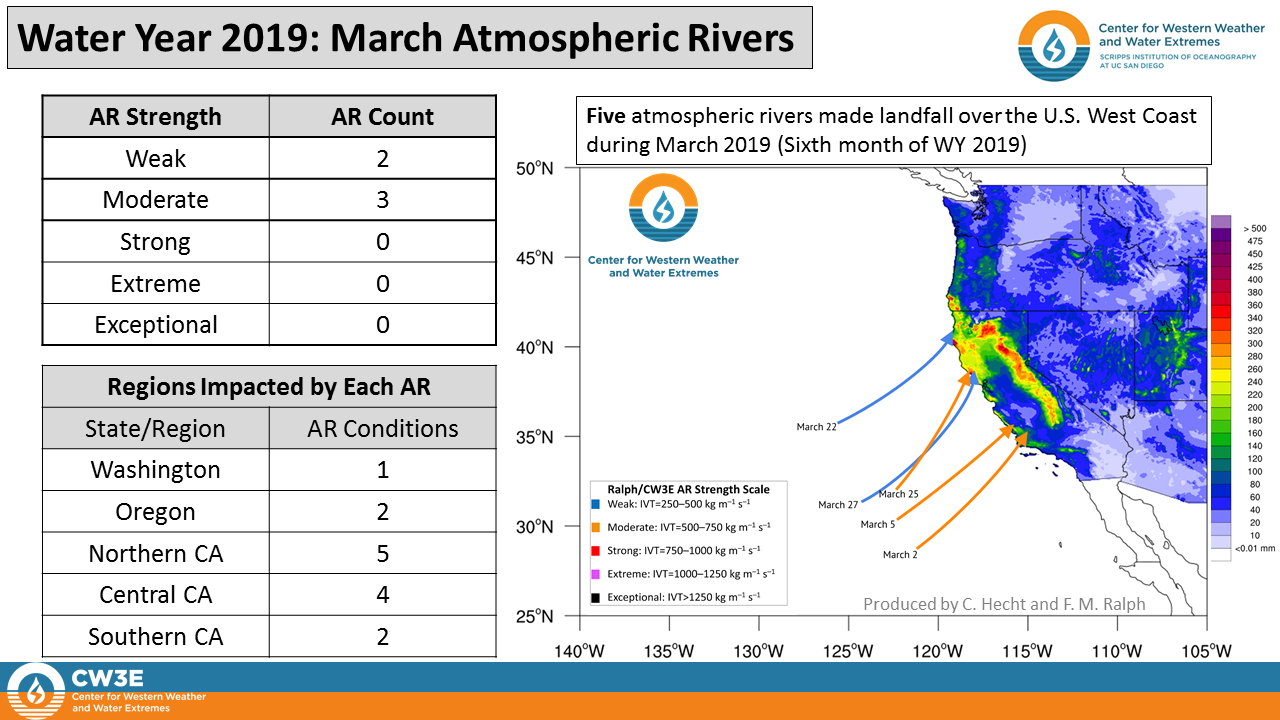
Graphic showing the atmospheric river events from March 2019, in which a few moderate AR events occurred in early March. These AR events led to more significant snowfall across the Colorado mountains, helping contribute to the historic avalanche cycle. (Source: Center for Western Weather and Water Extremes)
Graphic showing the strength and trajectory of the Madden Julian Oscillation from January through March of 2019. Zones 8 through 4 are more representative of when the MJO impacts the west coast of the United States. As you can see by the green line (February) and the blue line (March), it indicates the MJO was most active with more moderate activity from late February through mid March. This timeframe coincided with many of the AR events that helped contribute to a series of storms producing significant snow for the mountains of Colorado. (Source: Bureau of Meteorology in Australia)

