Severe thunderstorms may produce damaging winds, large hail, and numerous instances of flash/urban flooding over parts of the central Plains and lower Missouri Valley. Hazardous heat will continue in the South, Desert Southwest and the California Central Valley this weekend. Isolated dry thunderstorms may increase the risk of fire starts and spread across the Four Corners region and vicinity. Read More >
Sep. 2019 Summary (HOT and rather dry for most):
(see tabs below for much more, including several graphics)
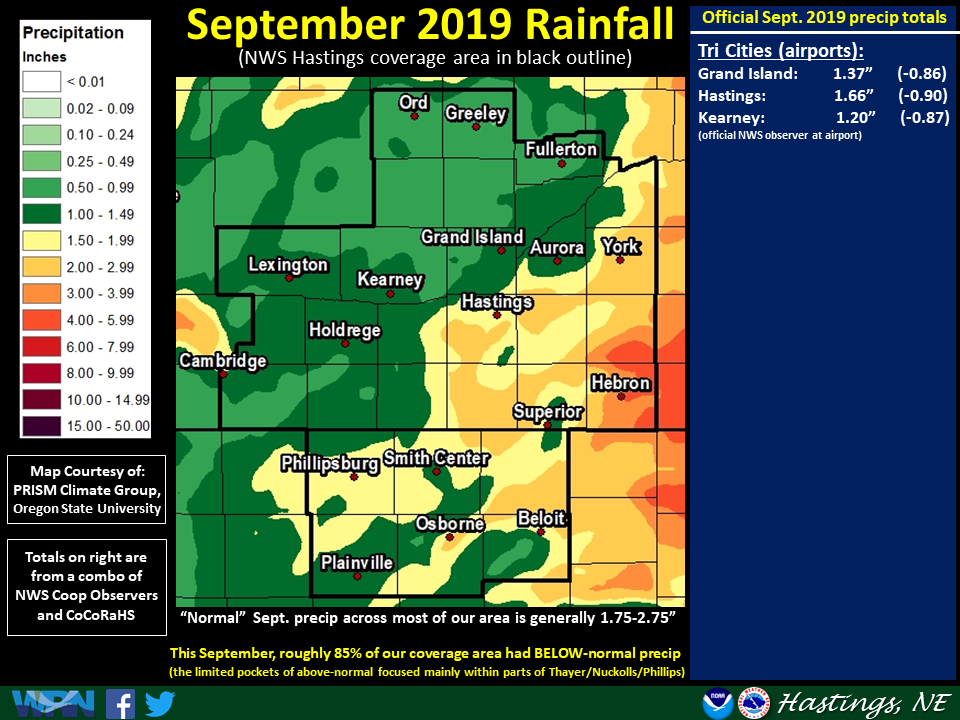
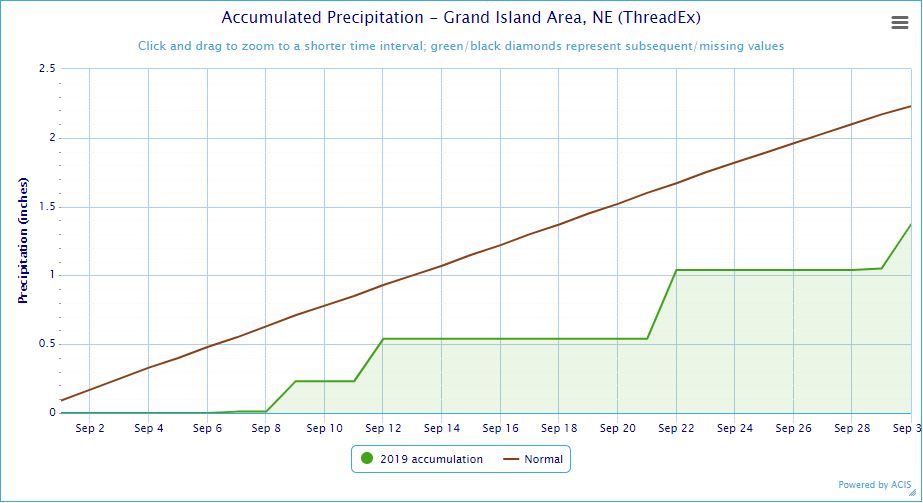
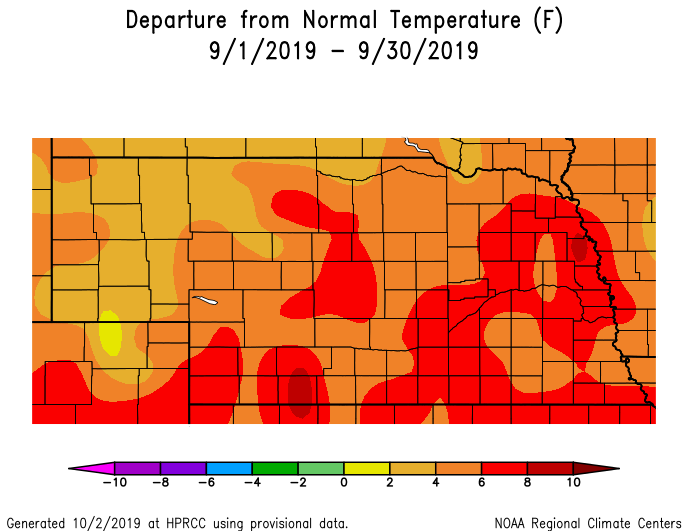
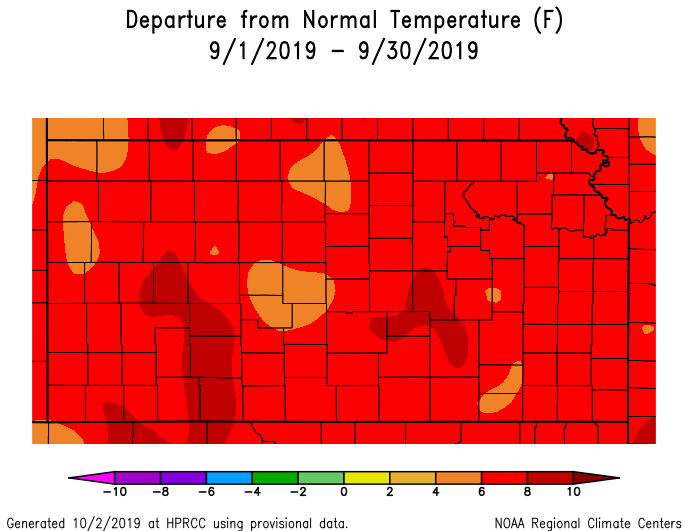
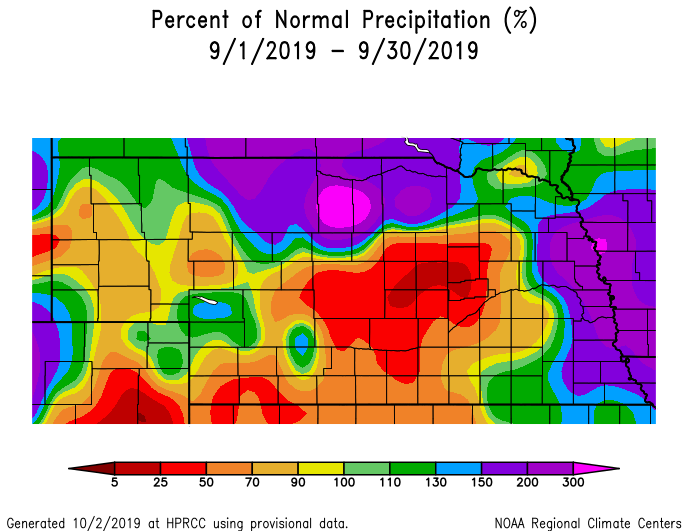
September 2019, above all else, was a hot month, as most of the area averaged 5-7º above normal, with warm overnight lows carrying a bit more "weight" than daytime highs. For most official NWS stations, this ranked between the 2nd-10th warmest September on record, and for many (including Grand Island and Hastings) was the overall-warmest since the 1930s! As for rainfall, quite honestly most folks likely welcomed the fact that roughly 85% of the area averaged below-normal (in the wake of a notably-wet August that featured considerable flooding in some places). In fact, roughly 35% of the area measured less-than-half of normal September rainfall, with some of the overall-driest places focused within Nance, Greeley and Sherman counties (where totals under 1" were most widespread). Of the only around 15% of the area that was wetter-than-normal, this primarily concentrated within parts of Thayer, Nuckolls and Phillips counties. The Thayer/southern Fillmore area was overall-wettest, highlighted by 6.73" at Hubbell (by far the highest official monthly total in our local area).
NOTE: All information in this story pertains to the 30-county NWS Hastings Coverage Area
2018 Nebraska Cooperative Observer Precipitation Tables (around 45 sites) |
Narrative
** Unfortunately, due to time constraints, a full/detailed narrative was not written for Sep. 2019 **
- Severe Thunderstorms/Tornadoes/Severe Non-Thunderstorm Winds (for official severe storm reports refer to NCEI Storm Events Database):
- # of confirmed tornadoes during Sep. 2019: Zero (same as 2018)
- Largest known hail stone diameter reported to NWS Hastings: 2.5" (tennis ball size) reported near both Holbrook and Rockville on the evening of the 30th.
- Strongest known measured thunderstorm wind gust: 63 MPH at Ord airport...at 1219 AM on the 12th (reports of minor tree damage)
- Strongest known measured NON-thunderstorm wind gust: nothing significant reported
- Notable wind damage (non-tornadic) reported to NWS Hastings (ground-truth reports): A 2-ft. diameter tree was snapped over in Hubbell (Thayer County) on the evening of the 21st.
- # of Severe Thunderstorm Warnings issued by NWS Hastings: 26 (4 more than 2018)
- # of Tornado Warnings issued by NWS Hastings: Zero (same as 2018)
Grand Island & Hastings Details (Including 12-Month History):
 |
 |
 |
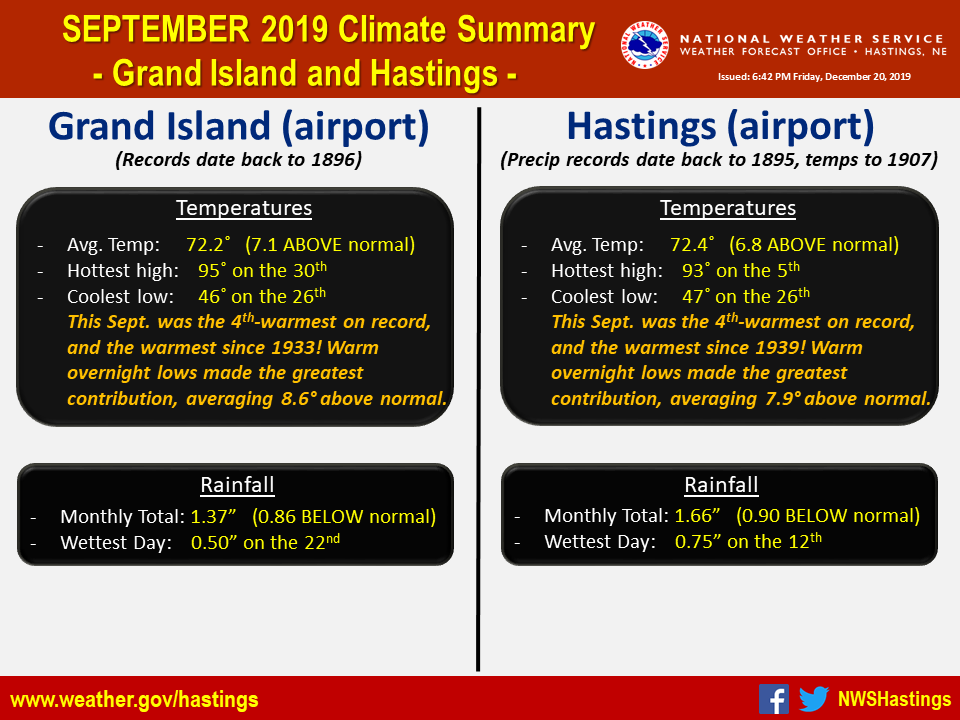
| Detailed September 2019 info for Grand Island/Hastings (Click to enlarge) |
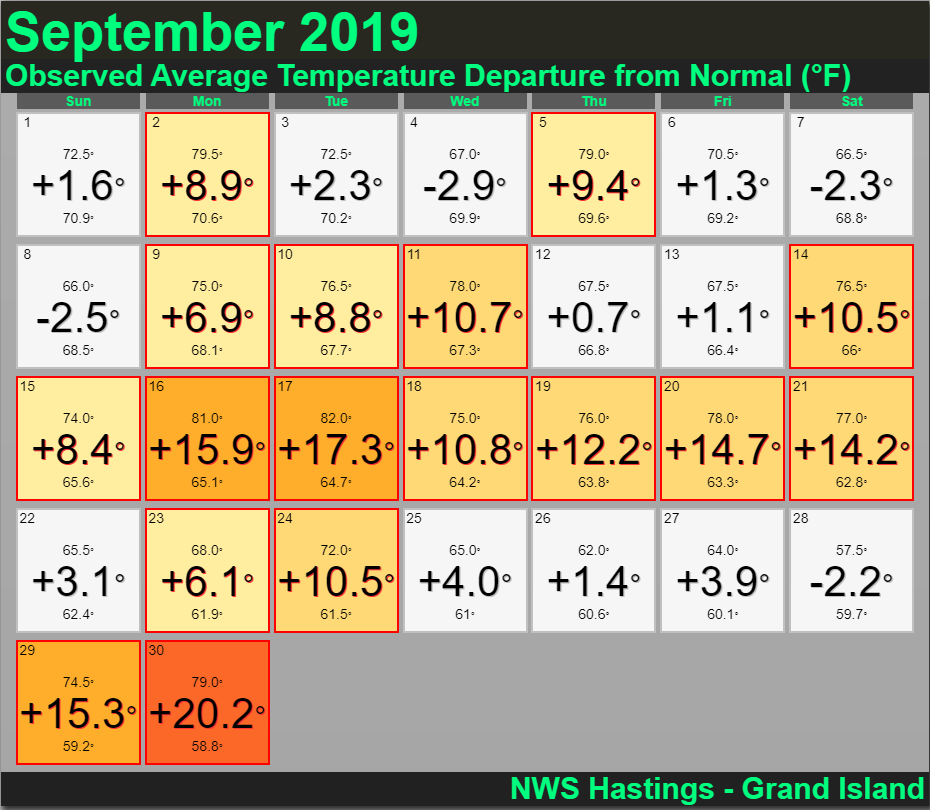
September 2019 Grand Island Temperature Departures From Normal |
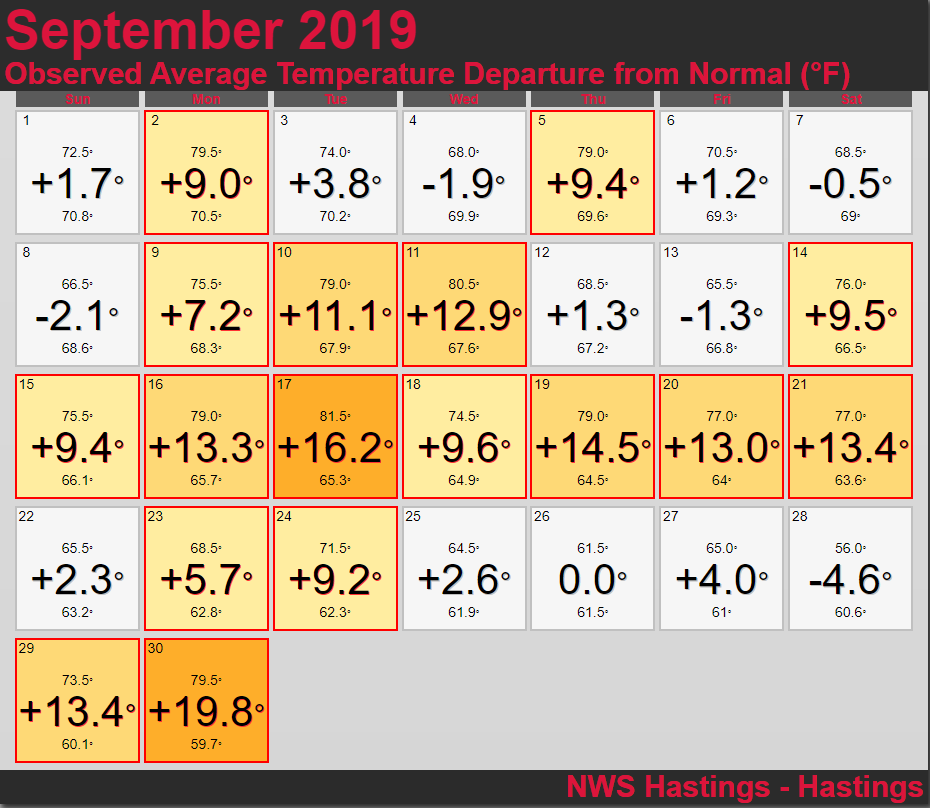
September 2019 Hastings Temperature Departures From Normal |
 |
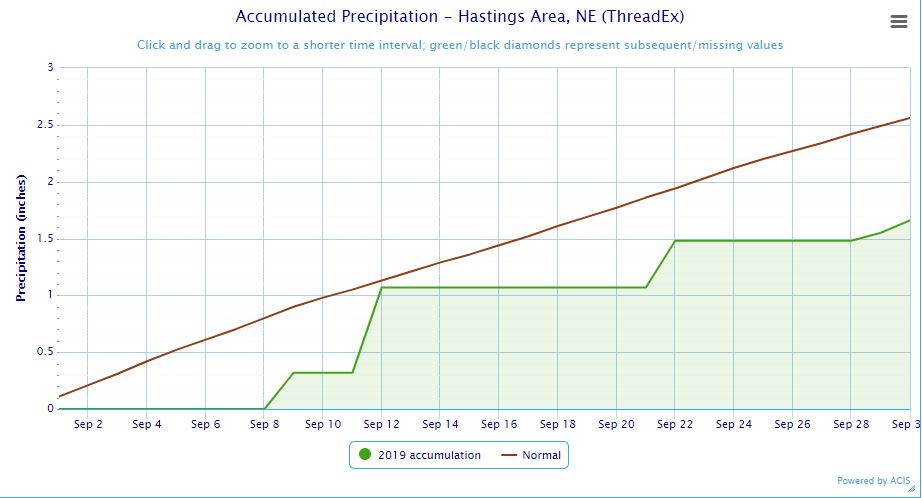 |
| Grand Island Precipitation Summary: The green line indicates cumulative observed precipitation for September 2019.The brown line indicates "normal" September precipitation based on 30-year data from 1981-2010. (click to enlarge) | Hastings Precipitation Summary: The green line indicates cumulative observed precipitation for September 2019. The brown line indicates "normal" September precipitation based on 30-year data from 1981-2010. (click to enlarge) |
| Grand Island (Regional Airport ASOS) - Oct. 2018 - Sept. 2019 | ||||||||||||
| Oct. | Nov. | Dec. | Jan. | Feb. | Mar. | Apr. | May | June | July | Aug. | Sept. | |
| Average High (F) | 61.3 | 45.9 | 39.5 | 36.4 | 26.8 | 43.8 | 65.7 | 68.9 | 83.2 | 87.7 | 81.3 | 83.5 |
| Average Low (F) | 38.1 | 24.2 | 20.2 | 17.5 | 9.3 | 24.4 | 38.6 | 47.6 | 60.5 | 67.1 | 63.9 | 60.9 |
| Average Temperature (F) | 49.7 | 35.0 | 29.9 | 27.0 | 18.1 | 34.1 | 52.2 | 58.3 | 71.8 | 77.4 | 72.6 | 72.2 |
| Departure From Normal | -2.5 | -3.1 | +3.2 | +1.9 | -11.0 | -5.3 | +1.6 | -2.9 | +0.5 | +1.2 | -1.4 | +7.1 |
| Precipitation (in) | 2.88 | 1.69 | 3.44 | 0.14 | 0.81 | 3.67 | 1.03 | 6.68 | 4.10 | 5.21 | 11.94 | 1.37 |
| Departure From Normal | +1.02 | +0.52 | +2.81 | -0.39 | +0.13 | +1.87 | -1.50 | +2.27 | -0.20 | +1.81 | +8.82 | -0.86 |
| Snowfall (in) | 1.5 | 7.9 | 4.2 | 1.6 | 10.9 | 8.2 | 1.0 | 0.0 | 0.0 | 0.0 | 0.0 | 0.0 |
| Departure From Normal | +0.5 | +4.8 | -0.9 | -4.9 | +4.6 | +2.8 | -0.5 | 0.0 | 0.0 | 0.0 | 0.0 | -0.1 |
| Hastings (Municipal Airport ASOS) - Oct. 2018 - Sept. 2019 | ||||||||||||
| Oct. | Nov. | Dec. | Jan. | Feb. | Mar. | Apr. | May | June | July | Aug. | Sept. | |
| Average High (F) | 60.9 | 46.3 | 39.9 | 37.0 | 27.5 | 43.7 | 65.5 | 68.1 | 82.4 | 87.1 | 82.4 | 83.1 |
| Average Low (F) | 38.7 | 24.9 | 21.9 | 19.4 | 10.8 | 25.5 | 39.6 | 48.1 | 60.9 | 67.3 | 64.6 | 61.8 |
| Average Temperature (F) | 49.8 | 35.6 | 30.9 | 28.2 | 19.2 | 34.6 | 52.5 | 58.1 | 71.7 | 77.2 | 73.5 | 72.4 |
| Departure From Normal | -2.8 | -3.1 | +3.3 | +2.2 | -10.7 | -5.3 | +1.8 | -3.2 | -0.1 | +0.1 | -0.8 | +6.8 |
| Precipitation (in) | 3.04 | 1.52 | 3.13 | 0.07 | 0.68 | 2.65 | 1.21 | 7.78 | 4.86 | 4.27 | 7.57 | 1.66 |
| Departure From Normal | +1.05 | +0.23 | +2.52 | -0.34 | +0.19 | +0.86 | -1.35 | +3.21 | +1.06 | +0.53 | +4.27 | -0.90 |
| Snowfall (in) | 1.1 | 5.5 | 4.3 | 0.9 | 11.6 | 5.3 | 0.5 | 0.0 | 0.0 | 0.0 | 0.0 | 0.0 |
| Departure From Normal | +0.1 | +2.9 | -1.8 | -5.1 | +5.1 | +0.1 | -0.7 | 0.0 | 0.0 | 0.0 | 0.0 | -0.2 |
Kearney - 12 Month Climate History:
All data here is from the official NWS observer at Kearney airport, with 24-hour observations taken around 7 a.m. ** PLEASE NOTE: This official Kearney data often differs slightly from the unofficial data recorded by the automated airport system (KEAR) **
| Kearney Airport (Coop Observer) - Oct. 2018 - Sept. 2019 | ||||||||||||
| Oct. | Nov. | Dec. | Jan. | Feb. | Mar. | Apr. | May | June | July | Aug. | Sept. | |
| Average High (F) | 59.0 | 45.2 | 37.5 | 34.7 | 27.0 | 41.8 | 64.4 | 65.3 | 80.1 | 85.5 | 82.1 | 81.9 |
| Average Low (F) | 35.7 | 22.6 | 18.4 | 17.1 | 7.0 | 22.2 | 36.1 | 44.5 | 56.4 | 64.2 | 62.4 | 57.3 |
| Average Temperature (F) | 47.3 | 33.9 | 28.0 | 25.9 | 17.0 | 32.0 | 50.3 | 54.9 | 68.3 | 74.9 | 72.2 | 69.6 |
| Departure From Normal | -3.6 | -3.1 | +2.1 | +1.3 | -11.1 | -5.7 | +1.6 | -4.6 | -1.5 | +0.2 | -0.4 | +6.1 |
| Precipitation (in) | 3.50 | 0.85 | 3.49 | 0.23 | 1.06 | 4.78 | 1.80 | 7.97 | 5.50 | 7.25 | 3.71 | 1.20 |
| Departure From Normal (in) | +1.46 | -0.17 | +2.92 | -0.26 | +0.51 | +2.99 | -0.43 | +3.79 | +1.57 | +3.97 | +0.63 | -0.87 |
| Snowfall (in) | 1.4 | 5.7 | 8.7 | 1.5 | 12.9 | 8.6 | 3.1 | 0.0 | 0.0 | 0.0 | 0.0 | 0.0 |
| Departure From Normal (in) | +0.7 | +2.6 | +5.2 | -2.9 | +7.8 | +4.0 | +1.3 | 0.0 | 0.0 | 0.0 | 0.0 | |
Ord - 12 Month Climate History:
All snowfall data is from the NWS Cooperative Observer in town. In addition, winter precipitation totals often include Cooperative Observer data given that the automated airport equipment is not designed to accurately melt snowfall liquid equivalent.
| Ord (Evelyn Sharp Field ASOS) - Oct. 2018 - Sept. 2019 | ||||||||||||
| Oct. | Nov. | Dec. | Jan. | Feb. | Mar. | Apr. | May | June | July | Aug. | Sept. | |
| Average High (F) | 59.5 | 45.3 | 38.6 | 36.5 | 26.3 | 42.7 | 62.8 | 66.5 | 80.7 | 85.2 | 80.2 | 81.7 |
| Average Low (F) | 33.6 | 20.2 | 14.5 | 15.9 | 6.7 | 22.0 | 34.8 | 43.5 | 55.9 | 63.6 | 61.7 | 56.6 |
| Average Temperature (F) | 46.5 | 32.8 | 26.6 | 26.2 | 16.5 | 32.3 | 48.8 | 55.0 | 68.3 | 74.4 | 70.9 | 69.2 |
| Departure From Normal | -3.1 | -3.5 | +1.7 | +1.6 | -11.3 | -5.4 | 0.0 | -4.3 | -0.9 | 0.0 | -2.1 | +5.6 |
| Precipitation (in) | 2.47 | 0.91 | 3.09 | 0.12 | 1.05 | 4.15 | 2.87 | 7.03 | 3.76 | 4.34 | 9.81 | 0.92 |
| Departure From Normal (in) | +0.54 | -0.16 | +2.50 | -0.25 | +0.61 | +2.70 | +0.28 | +3.22 | -0.36 | +1.37 | +6.65 | -1.52 |
| Snowfall (in) | 0.3 | 3.8 | 10.5 | 2.4 | 15.8 | 13.6 | 6.0 | 0.0 | 0.0 | 0.0 | 0.0 | 0.0 |
| Departure From Normal (in) | -0.8 | -1.5 | +3.1 | -4.4 | +9.8 | +7.7 | +3.5 | 0.0 | 0.0 | 0.0 | 0.0 | -0.2 |
Smith Center, KS - 12 Month Climate History:
All data is from the official NWS observer, with 24-hour observations taken around 7 a.m. As a result, data may vary slightly from true "Calendar Day".
| Smith Center KS (NWS Coop Observer) - Oct. 2018 - Sept. 2019 | ||||||||||||
| Oct. | Nov. | Dec. | Jan. | Feb. | Mar. | Apr. | May | June | July | Aug. | Sept. | |
| Average High (F) | 62.5 | 48.6 | 41.1 | 37.4 | 32.4 | 47.0 | 69.5 | 70.5 | 85.4 | 91.9 | 87.4 | 86.6 |
| Average Low (F) | 38.5 | 24.4 | 20.3 | 18.8 | 11.8 | 24.1 | 37.9 | 46.9 | 58.5 | 65.3 | 64.7 | 60.9 |
| Average Temperature (F) | 50.5 | 36.5 | 30.7 | 28.1 | 22.1 | 35.6 | 53.7 | 58.7 | 72.0 | 78.6 | 76.1 | 73.8 |
| Departure From Normal | -4.3 | -3.9 | +1.9 | +0.4 | -9.9 | -6.0 | +1.2 | -5.0 | -2.0 | -1.1 | -1.1 | +5.6 |
| Precipitation (in) | 4.61 | 0.62 | 3.61 | 0.42 | 0.86 | 1.57 | 0.09 | 5.31 | 2.92 | 4.38 | 4.57 | 1.23 |
| Departure From Normal (in) | +2.73 | -0.60 | +2.95 | -0.07 | +0.28 | -0.30 | -2.18 | +1.39 | -0.69 | +0.51 | +1.27 | -0.81 |
| Snowfall (in) | 1.2 | 5.8 | 2.4 | 7.0 | 12.4 | 7.0 | 1.0 | 0.0 | 0.0 | 0.0 | 0.0 | 0.0 |
| Departure From Normal (in) | +0.8 | +4.0 | -0.8 | +3.3 | +8.3 | +4.4 | +0.4 | 0.0 | 0.0 | 0.0 | 0.0 | -0.2 |
Temperature & Precipitation Departure From Normal Maps:
These images depict September 2019 monthly temperature departure from normal & precipitation percent-of-normal for both Nebraska & Kansas. Images are courtesy of the High Plains Regional Climate Center (HPRCC). Please note: These maps occasionally contain "bullseyes" of errant data. For precipitation, you can also generate departure from normal/percent-of-normal maps using the NWS AHPS page, or view local-area images generated each day by NWS Hastings.
 |
 |
 |
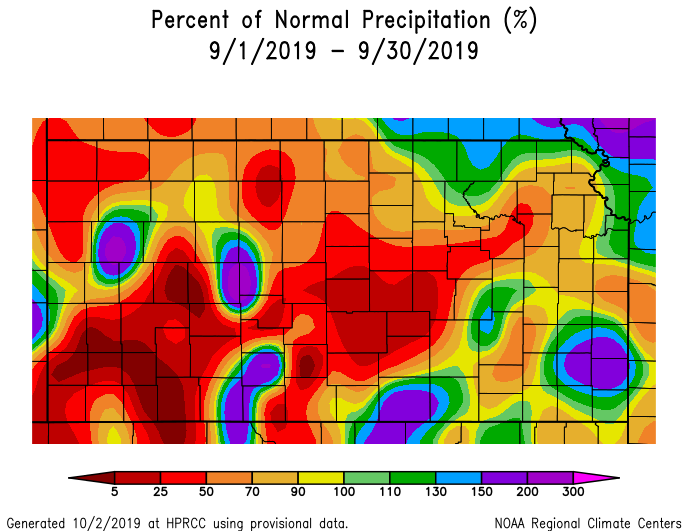 |
| Departure from Normal Temperature - NE (left) & KS (right) | Percent of Normal Precipitation - NE (left) & KS (right) | ||
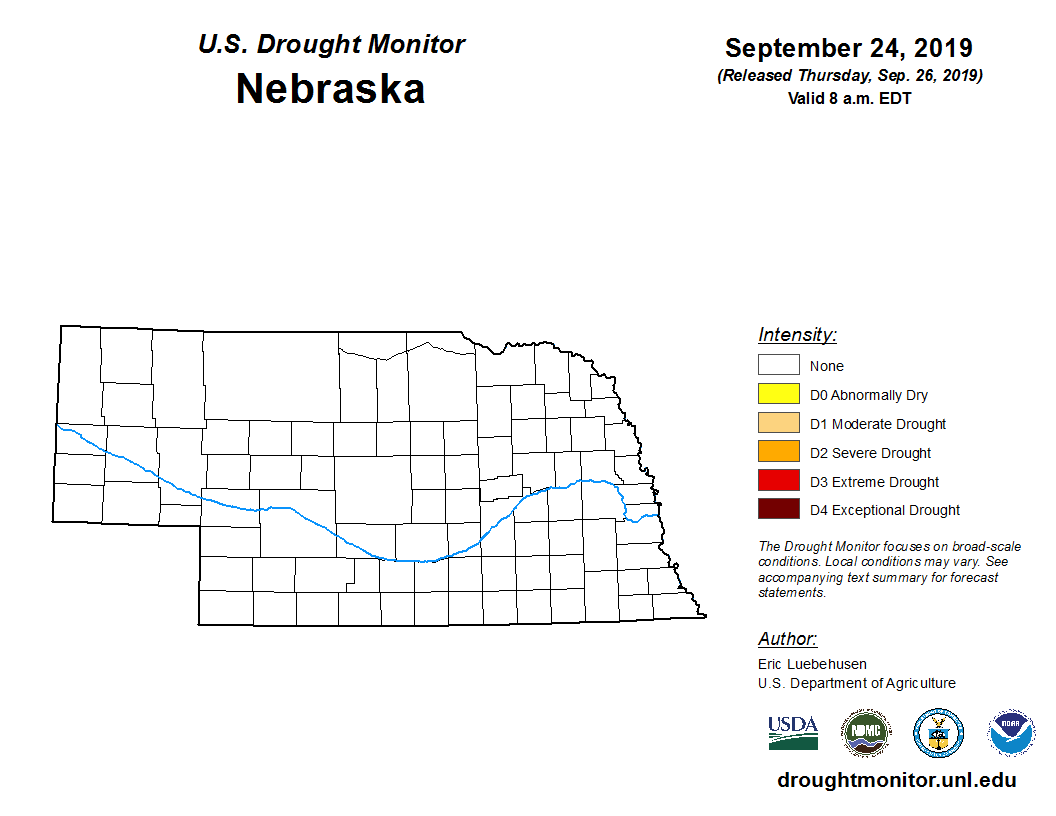
Drought:
The following drought images, current as of September 24, 2019, are courtesy of the U.S. Drought Monitor
Summary of changes during September 2019 across the NWS Hastings coverage area:
The ENTIRE NWS Hastings coverage area remained void of all drought categories during Sep. 2019.
 |
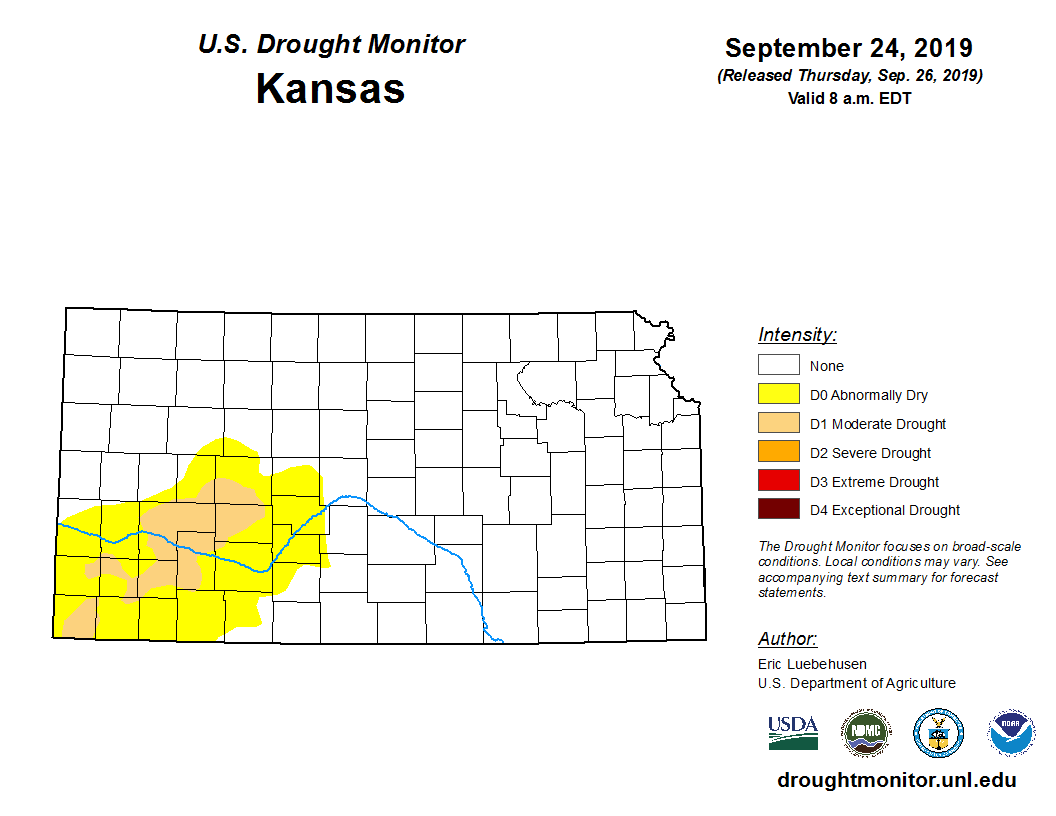 |
| Drought Monitor for Nebraska (left) & Kansas (right). Valid as of September 24, 2019 (click to enlarge) | |
September 2019 Extremes for the NWS Hastings Coverage Area:
...SOME OF THE HOTTEST HIGH TEMPERATURES DURING SEPTEMBER 2019...
(all data from NWS cooperative observers or automated airport sites, with the date it actually occurred indicated in parentheses)
101...Beaver City (5th)
100...Webster Dam KS (5th)
99...Edison (5th) - Kirwin Dam (8th)
98...Cambridge (5th) - Smith Center KS (5th)
...SOME OF THE COOLEST LOW TEMPERATURES DURING SEPTEMBER 2019...
(all data from NWS cooperative observers or automated airport sites, with the date it actually occurred indicated in parentheses)
42...Edison (26th) - Greeley (24th)
43...Minden (26th)
44...Cambridge (26th) - Holdrege (26th) - Lexington airport (26th) - Ord airport (23rd)
...SOME OF THE HIGHEST MONTHLY RAIN TOTALS DURING SEPTEMBER 2019...
(all data from NWS cooperative observers and CoCoRaHS/NeRAIN observers unless indicated)
6.73"...Hubbell
4.74"...Hebron
4.43"...Tobias 2WSW
4.00"...Chester 3NE
3.49"...Shickley 4S
3.11"...Nelson
3.06"...Damar KS 1NNW
3.01"...Red Cloud 4E
2.88"...Red Cloud (in town)
2.76"...Deshler 5SSW
...SOME OF THE LOWEST MONTHLY RAIN TOTALS DURING SEPTEMBER 2019...
(all data from NWS cooperative observers and CoCoRaHS/NeRAIN observers unless indicated)
0.21"...Genoa 7WNW
0.28"...Spalding 7SSW
0.45"...Rockville
0.46"...Palmer 9NE
0.53"...Boelus 3NE - Ord 7SSE
0.56"...Ravenna
0.58"...Greeley
0.59"...Loup City 2W
0.61"...Litchfield 4N - Belgrade - Ord
0.67"...Miller
 |
Media use of NWS Web News Stories is encouraged! Please acknowledge the NWS as the source of any news information accessed from this site. |
|