
A frontal system is expected to bring wintry precipitation to the Central Appalachians and portions of the Mid-Atlantic into Wednesday, meanwhile, showers and thunderstorms are expected along the Gulf Coast and Southeast. A series of Clipper systems will bring periods of snow to the Northern Plains and Great Lakes over the next several days. Read More >
Jan. 2020 Summary (Above Average Precipitation Most Areas...Slightly Above-Average Temps):
(see tabs below for much more, including full narrative and graphics!)
January 2020 was most noted by above-normal precipitation (especially within the eastern two-thirds of the area). However, because a decent amount of this precipitation fell as rain (and NOT snow), snow totals were actually below-normal across much of the area (especially in many western/southwestern counties). Temperature-wise, there were no significant stretches of bitterly cold or very mild weather, but the month as a whole averaged out as slightly warmer-than-normal.
(See full narrative in the tabs below for much more!)
NOTE: All information in this story pertains to the 30-county NWS Hastings Coverage Area
|
Full Narrative:
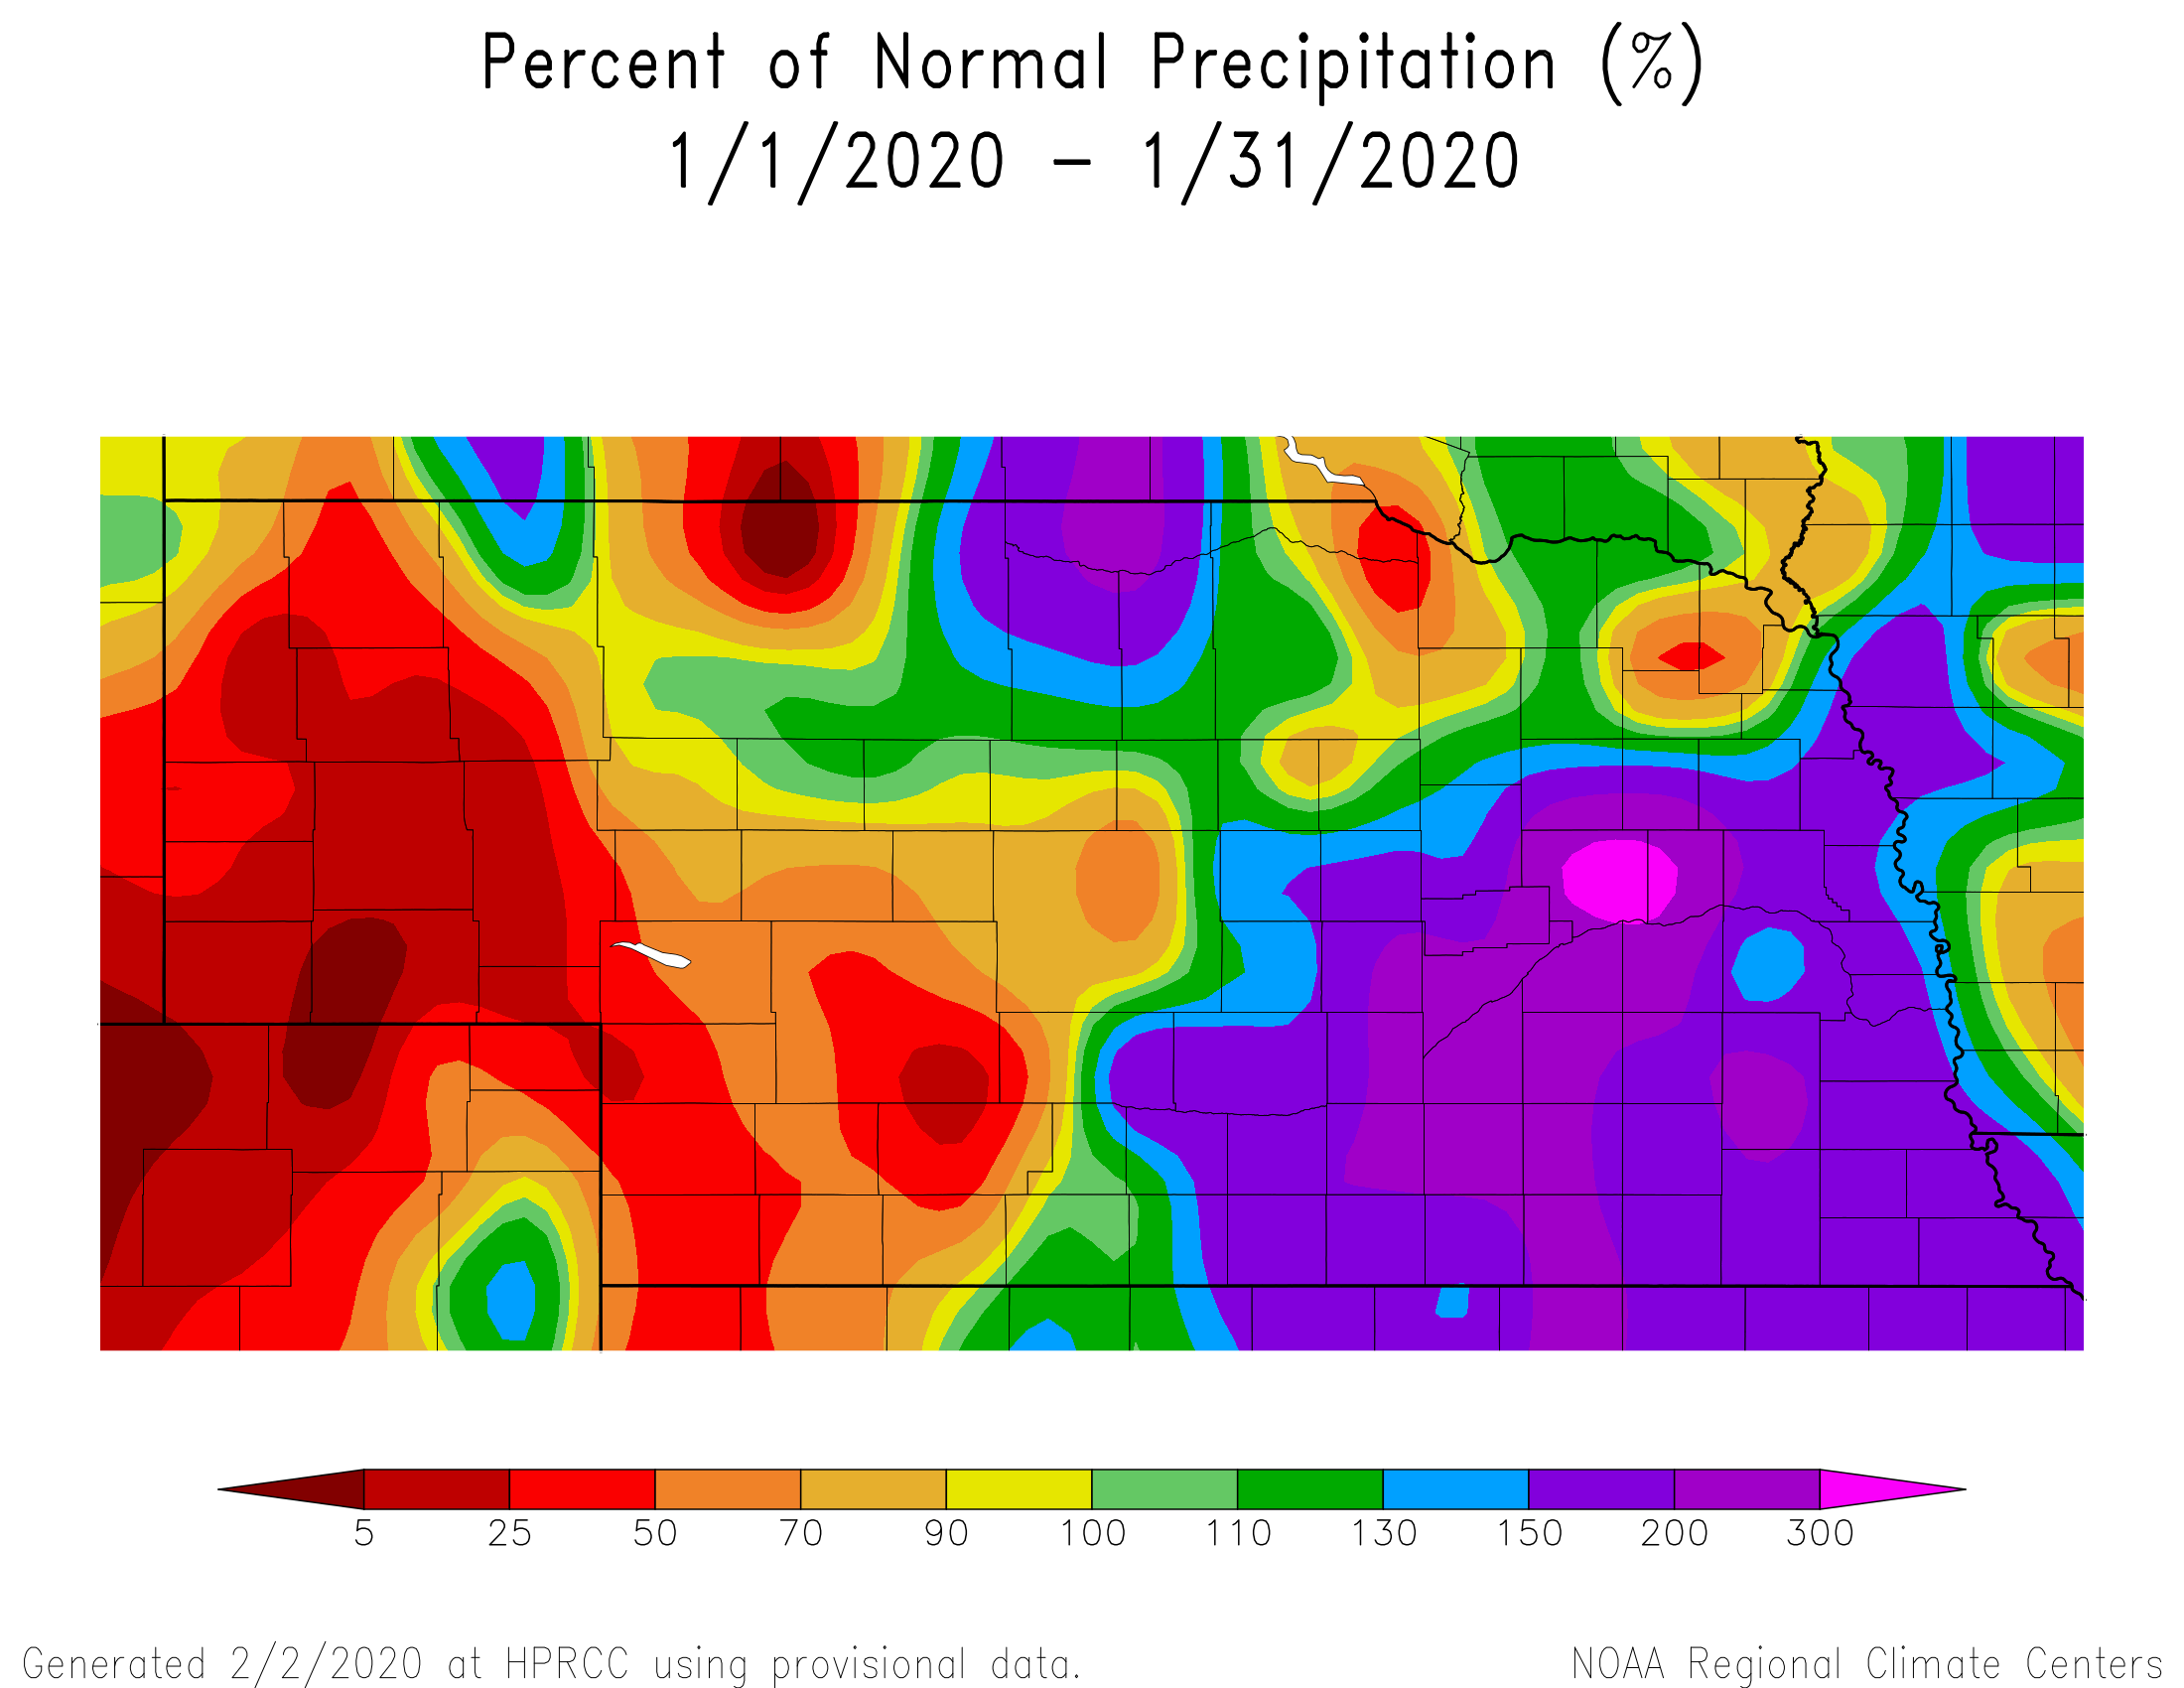
- Precipitation (rainfall+snow liquid): The vast majority of the 30-county area (roughly 98% of it) received above-normal January precipitation totaling somewhere between 0.50-1.40", with only limited drier/wetter exceptions. Given that "normal" January precipitation (based on 30-year normals) is typically only between 0.35-0.65", the majority of the area received between 150-300% of normal precipitation this month. As evidenced in the next section below, a decent chunk of total monthly precipitation actually fell in the form of rain and/or freezing rain and not snow. Geographically, there was somewhat of an "east vs. west" disparity, with roughly the eastern 2/3 of the area seeing the greatest concentration of 1+" amounts, while the greatest concentration of less-than-1" amounts focused mainly west of a line from Greeley-Kearney-Plainville KS. The only portion of the area with truly below normal January precipitation was roughly the western half of Dawson County, especially from around Lexington westward. For all areas, the vast majority of January precipitation fell during the latter half of the month, as the first half was quite dry.
Per dozens of NWS/CoCoRaHS observers, a few of the highest January totals featured: 1.85" in Hebron, 1.40" near Elba, 1.37" at Osceola and 1.36" near York. On the drier (but not extremely dry) side of things for January were totals such as: 0.25" near Lexington, 0.45" southwest of Spalding, 0.52" in Beaver City and near Arcadia and 0.55" at Edison and Cambridge.
- Snowfall/Winter Weather: Given that 30-year "normals" suggest that most of the local area can expect between 5-7" of January snow, it's safe to say that at least slightly-below-average snowfall was the main theme this January, as most stations only tallied somewhere between 1-6". Not surprisingly given these modest totals, there were no "major" snow storms during the month, with most places receiving no more than 1-3" from any particular storm. Geographically, the primary concentration of the highest 4-6+" amounts focused within roughly the northeast half of the area (mainly east of an Ord-Hastings-Jewell KS line). Meanwhile, several counties in western/southwest portions of the area saw no more than 1-2" for the month. Per NWS/CoCoRaHS observers, a few of the very-highest January snow totals featured: 7.2" at Geneva, 6.5" at Nelson, 6.4" in Hebron and 6.2" near Stromsburg.
In addition to snowfall, there were a few modest "ice events" during the month from freezing rain/freezing drizzle. Although these were not "major" ice storms by any means (the kind that cause widespread power outages), particularly the 17th and 21st featured events that prompted slick roads and deposited up to around 1/4" of ice onto elevated surfaces such as tree branches.
- Flooding: The vast majority of our coverage area observed no flooding during the month. However, between the 18th-27th, a Flood Advisory was in effect for minor flooding (due to an ice jam) along the Middle Loup River near Loup City. According to the Sherman County emergency manager, no structures or roads were affected during this time.
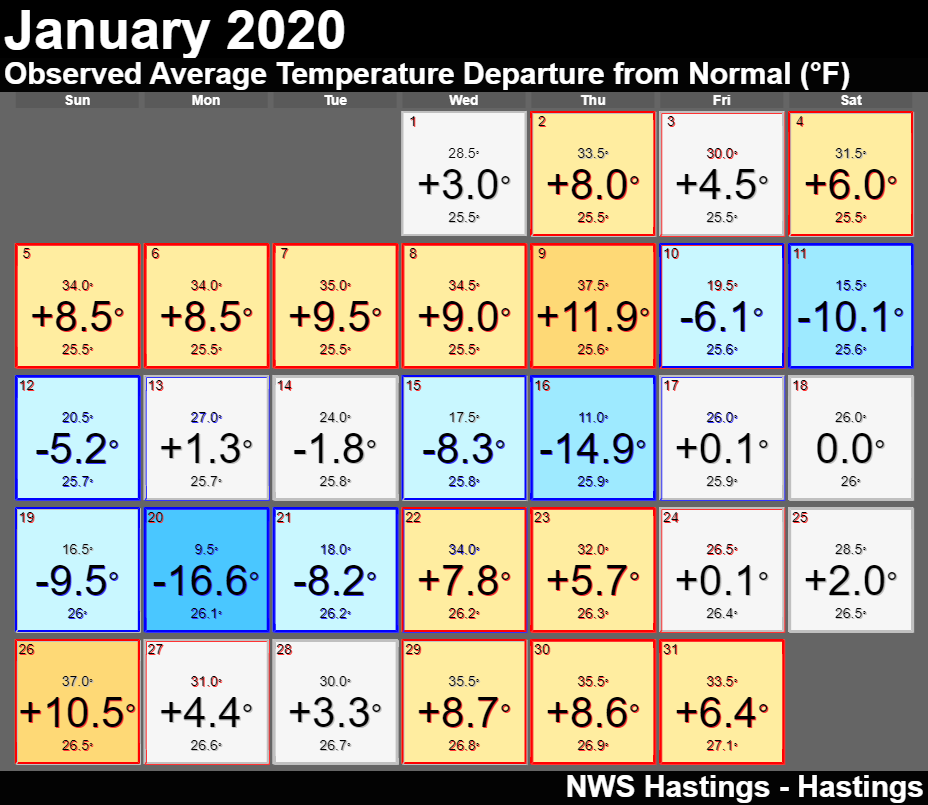
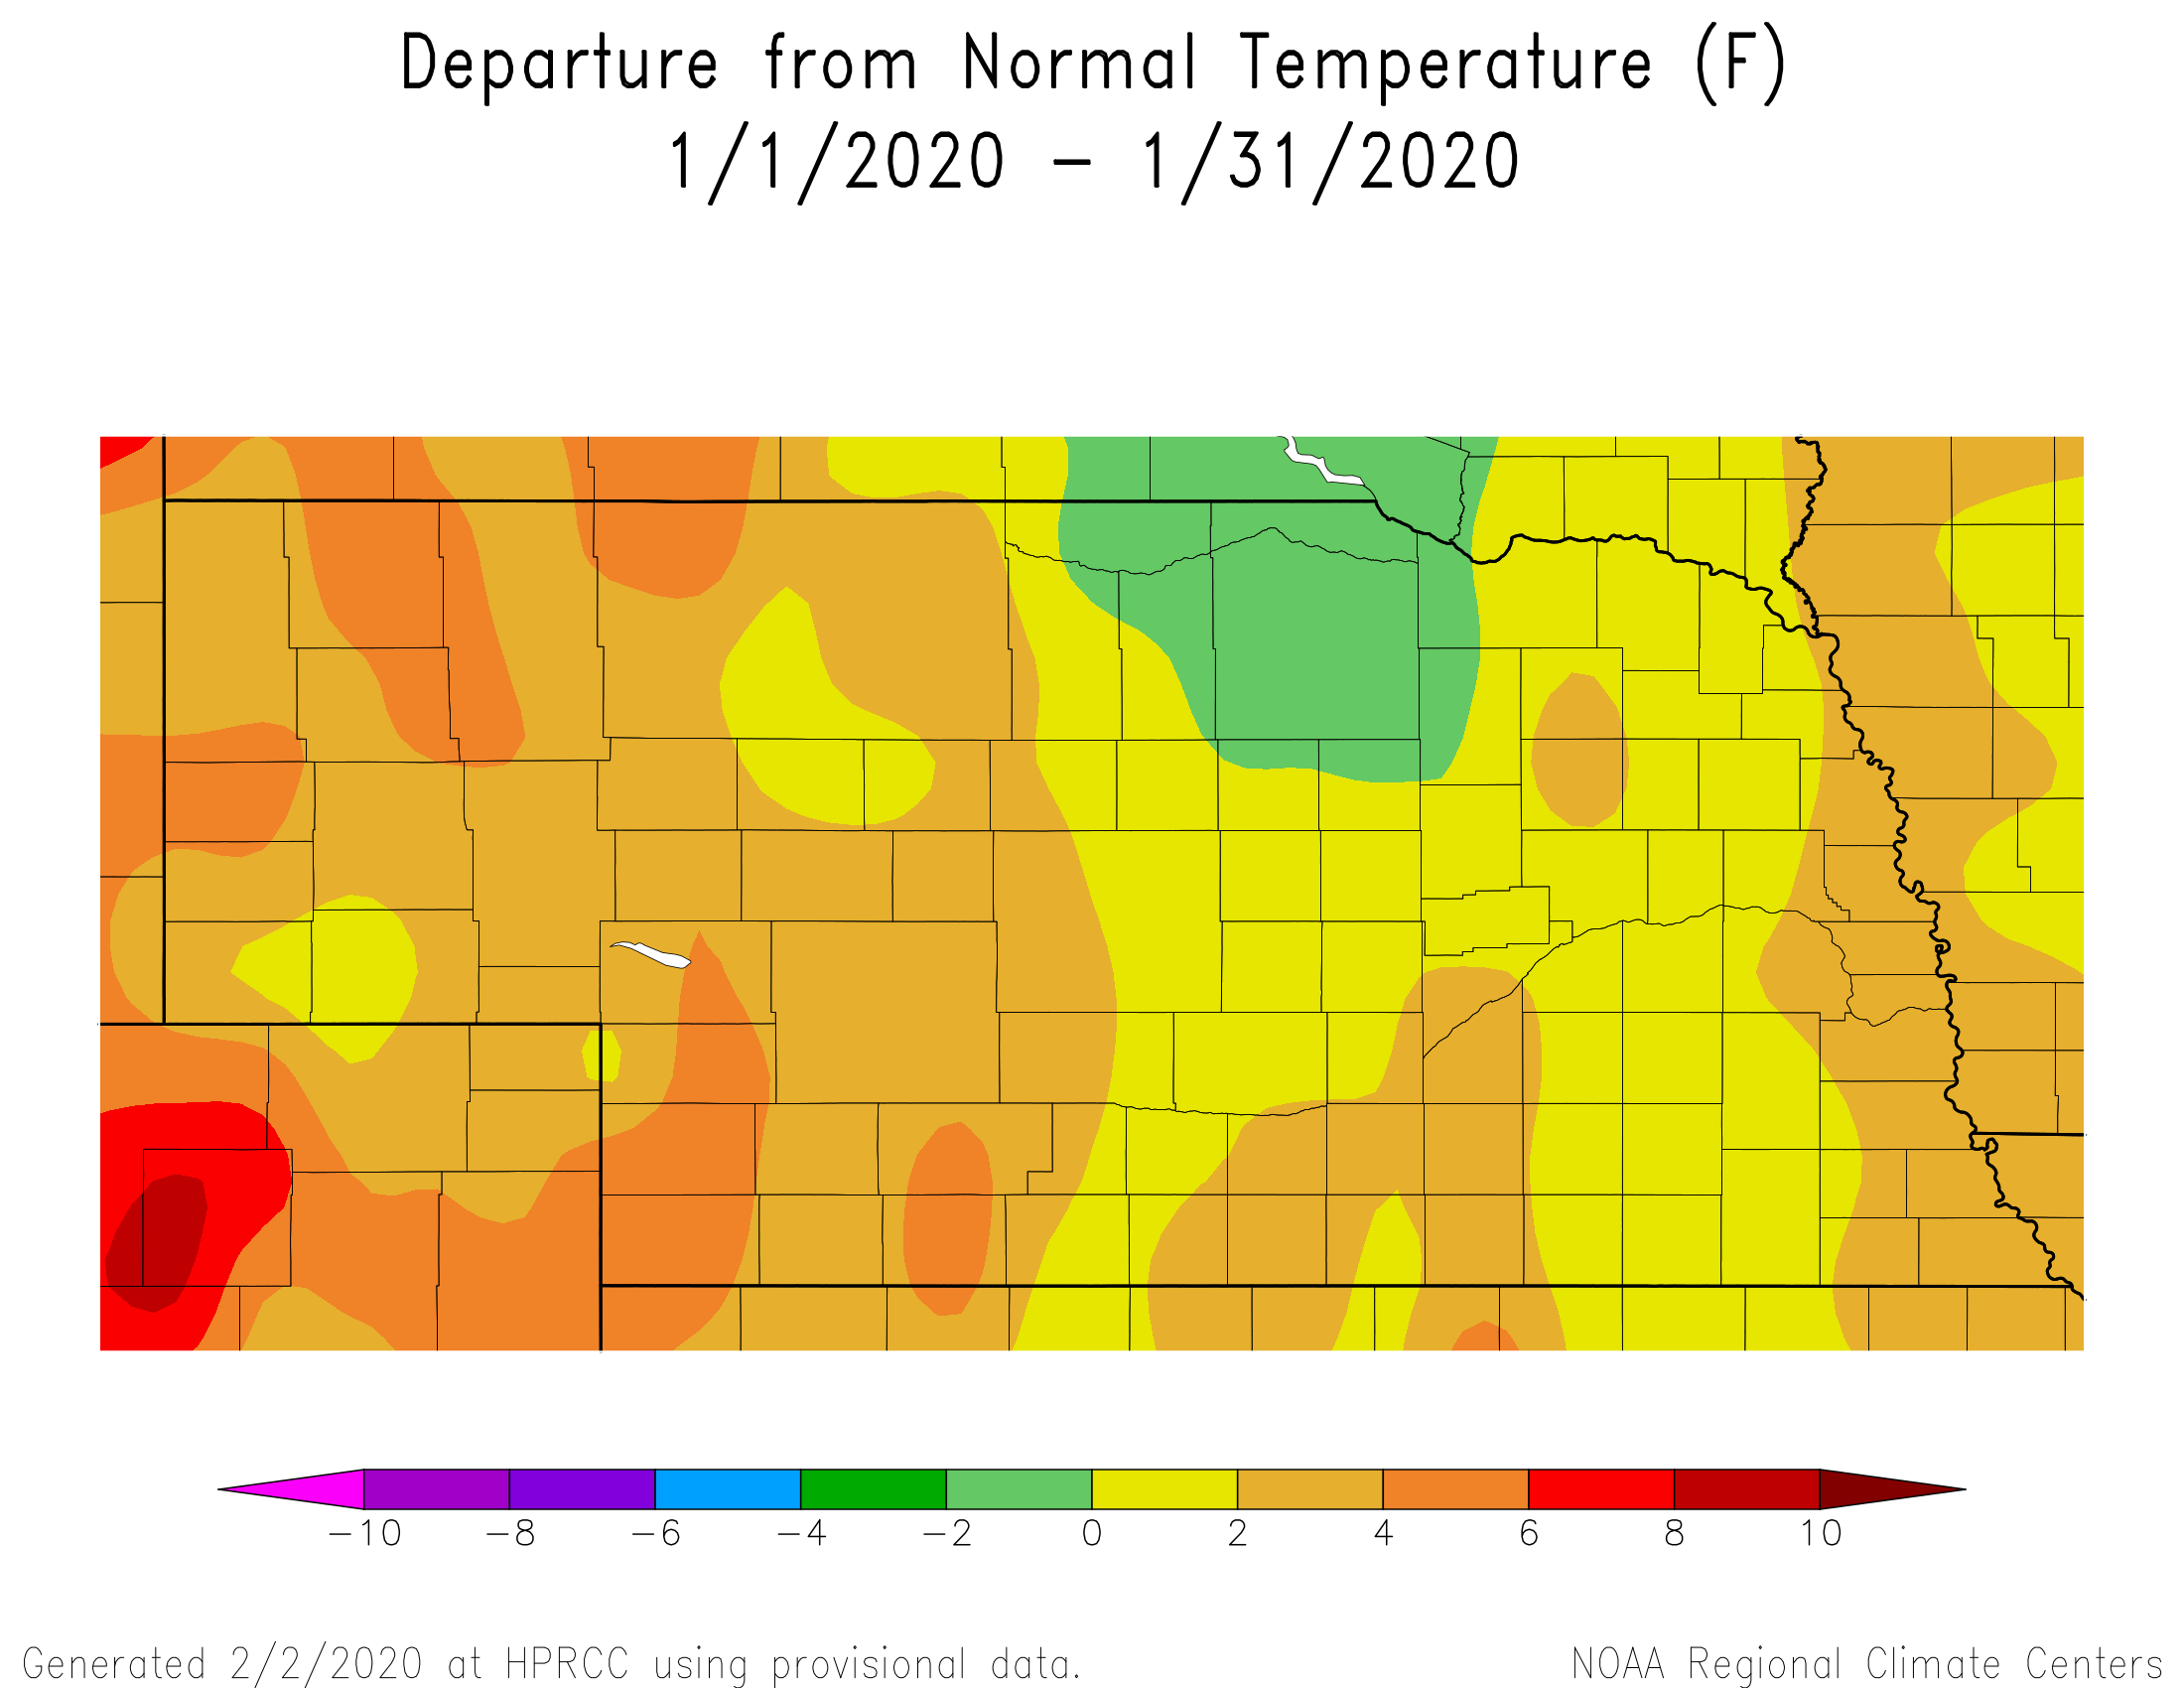
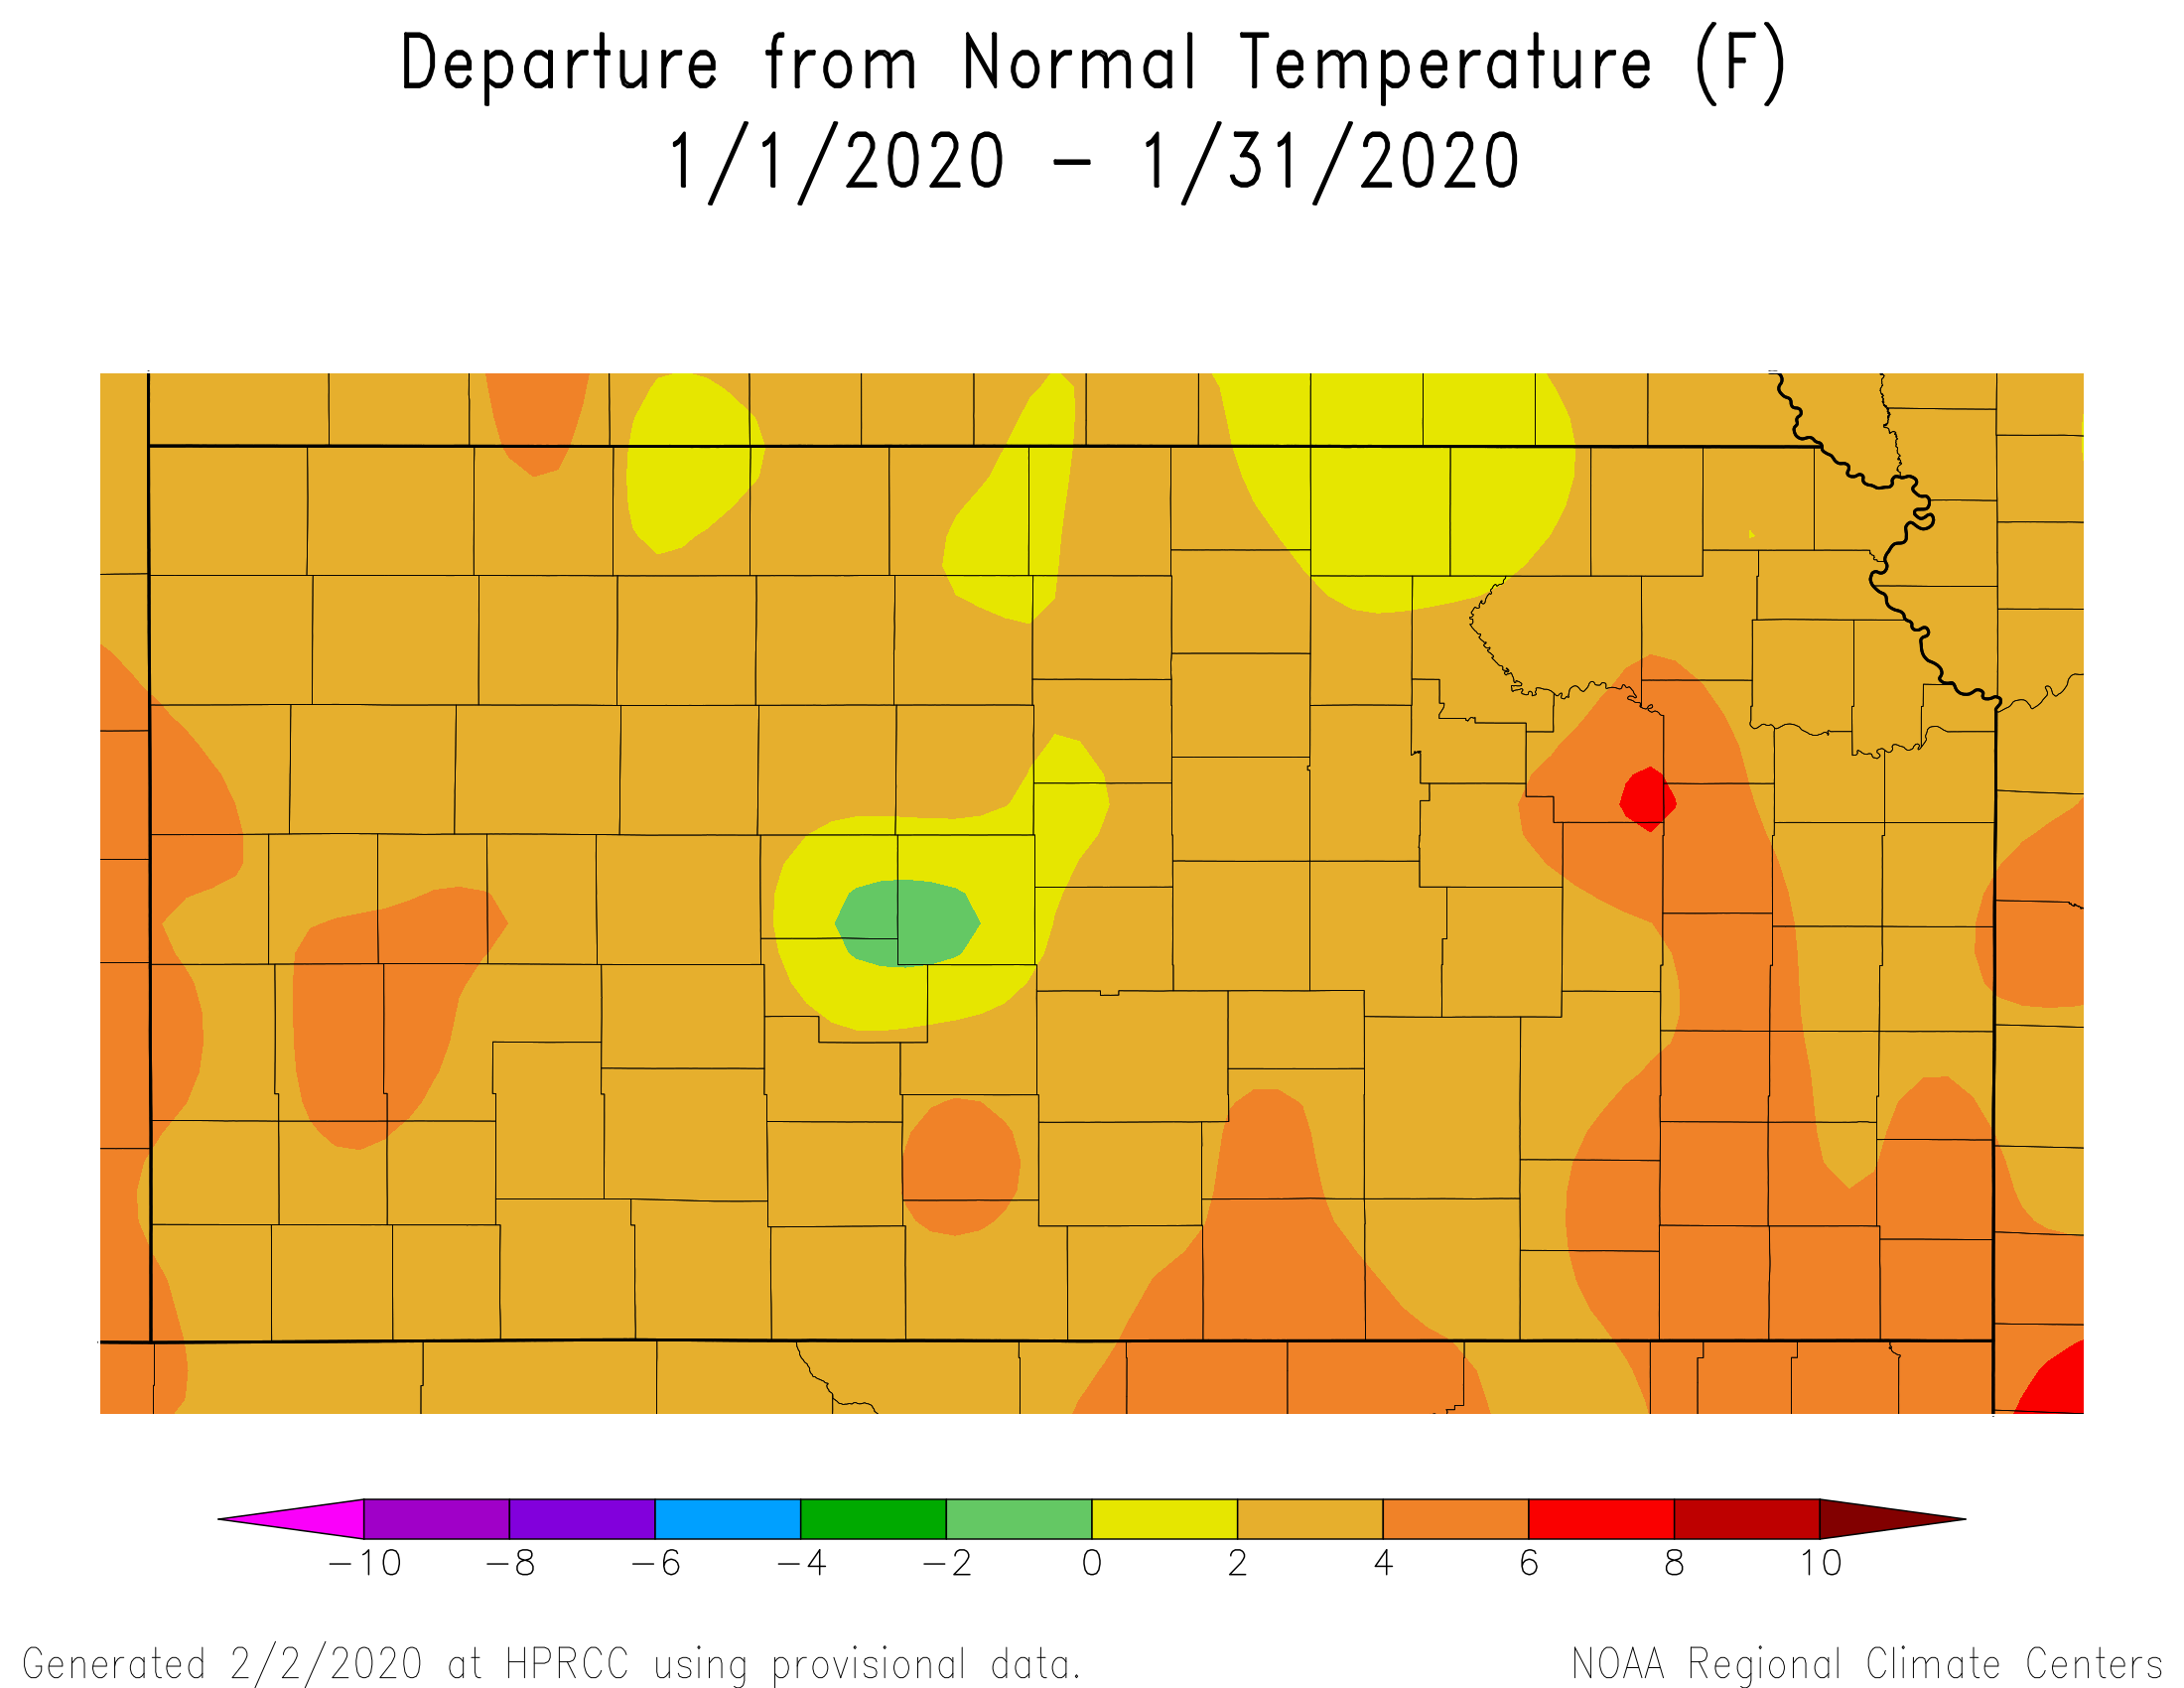
- Temperatures: There were really no truly significant warm/cold stretches during the month, as most of our coverage area ended up averaging between 1 and 2.5º above normal for January. However, there were generally three temperature regimes during the month, as both the first nine days and the final 10 days prevailed above normal (overall), while the middle portion of the month (10th-21st) featured the coldest readings. Using Hastings airport as a proxy for the area as a whole, 21 of the 31 days averaged at least slightly warmer-than-normal. For most of the area, the outright-coldest day was the 20th, with highs only in the teens to low 20s. In contrast, the 26th was the overall-mildest day for most of the area with highs well into the 40s-50s. However, there just weren't any really warm days (60s/70s) to be found, as sometimes happens during January. As for overnight lows, most places notched their coldest readings on days such as the 11th, 16, and 20th.
As for monthly extremes, some of the warmest January readings per NWS observers (all on the 26th) featured: 59º near Plainville KS, 57º at Beloit KS and Edison, and 56º at Harlan County Lake, Superior, Franklin and Smith Center KS. On the opposite end of the thermometer, the coldest (slightly below-zero) readings of January included: -5º at Osceola, -4º near York and -3º at Greeley.
- Severe Thunderstorms/Tornadoes/Severe Non-Thunderstorm Winds (for official severe storm reports refer to NCEI Storm Events Database):
- # of confirmed tornadoes during Jan. 2020: Zero (same as 2019)
- Largest known hail stone diameter reported to NWS Hastings: none occurred
- Strongest known measured thunderstorm wind gust: none occurred
- Strongest known measured NON-thunderstorm wind gust: 56 MPH near Waco on the 18th (unofficial)...the highest official gust was 55 MPH at Hastings airport on the 18th. More details: During the pre-dawn hours of the 18th, a surge of strong northwesterly winds overspread the entire coverage area, with peak gusts commonly into the 45-55 MPH range. However, no reliable stations recorded "severe" wind gusts of 58+ MPH.
- Notable wind damage reported to NWS Hastings (ground-truth reports): None reported or that we are aware of
- # of Severe Thunderstorm Warnings issued by NWS Hastings: Zero (same as 2019)
- # of Tornado Warnings issued by NWS Hastings: Zero (same as 2019)
Grand Island & Hastings Details (Including 12-Month History):
 |
 |
 |
| Detailed January 2020 Information for Grand Island and Hastings |
January 2020 Grand Island Temperature Departure From Normal |
January 2020 Hastings Temperature Departure From Normal |
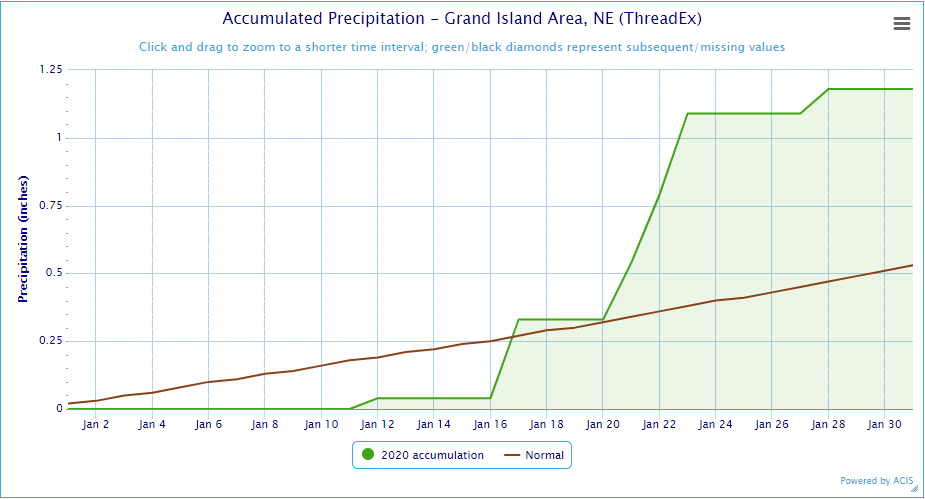 |
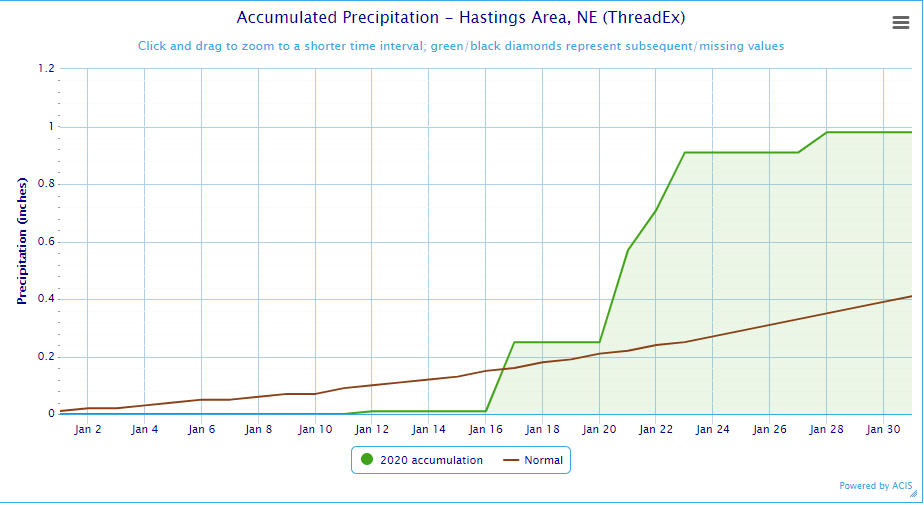 |
| Grand Island Precipitation Summary: The green line indicates cumulative observed precipitation for January 2020.The brown line indicates "normal" January precipitation based on 30-year data from 1981-2010. (click to enlarge) | Hastings Precipitation Summary: The green line indicates cumulative observed precipitation for January 2020. The brown line indicates "normal" January precipitation based on 30-year data from 1981-2010. (click to enlarge) |
| Grand Island (Regional Airport ASOS) - Feb. 2019 - Jan. 2020 | ||||||||||||
| Feb. | Mar. | Apr. | May | June | July | Aug. | Sept. | Oct. | Nov. | Dec. | Jan. | |
| Average High (F) | 26.8 | 43.8 | 65.7 | 68.9 | 83.2 | 87.7 | 81.3 | 83.5 | 59.0 | 49.5 | 41.6 | 35.0 |
| Average Low (F) | 9.3 | 24.4 | 38.6 | 47.6 | 60.5 | 67.1 | 63.9 | 60.9 | 34.9 | 26.5 | 22.9 | 19.7 |
| Average Temperature (F) | 18.1 | 34.1 | 52.2 | 58.3 | 71.8 | 77.4 | 72.6 | 72.2 | 46.9 | 38.0 | 32.3 | 27.4 |
| Departure From Normal | -11.0 | -5.3 | +1.6 | -2.9 | +0.5 | +1.2 | -1.4 | +7.1 | -5.3 | -0.1 | +5.6 | +2.3 |
| Precipitation (in) | 0.81 | 3.67 | 1.03 | 6.68 | 4.10 | 5.21 | 11.94 | 1.37 | 1.35 | 1.91 | 1.50 | 1.18 |
| Departure From Normal | +0.13 | +1.87 | -1.50 | +2.27 | -0.20 | +1.81 | +8.82 | -0.86 | -0.51 | +0.74 | +0.87 | +0.65 |
| Snowfall (in) | 10.9 | 8.2 | 1.0 | 0.0 | 0.0 | 0.0 | 0.0 | 0.0 | 1.6 | 10.0 | 5.0 | 4.3 |
| Departure From Normal | +4.6 | +2.8 | -0.5 | 0.0 | 0.0 | 0.0 | 0.0 | -0.1 | +0.6 | +6.9 | -0.1 | -2.2 |
| Hastings (Municipal Airport ASOS) - Feb. 2019 - Jan. 2020 | ||||||||||||
| Feb. | Mar. | Apr. | May | June | July | Aug. | Sept. | Oct. | Nov. | Dec. | Jan. | |
| Average High (F) | 27.5 | 43.7 | 65.5 | 68.1 | 82.4 | 87.1 | 82.4 | 83.1 | 58.8 | 49.1 | 41.9 | 35.3 |
| Average Low (F) | 10.8 | 25.5 | 39.6 | 48.1 | 60.9 | 67.3 | 64.6 | 61.8 | 35.0 | 26.2 | 23.0 | 19.8 |
| Average Temperature (F) | 19.2 | 34.6 | 52.5 | 58.1 | 71.7 | 77.2 | 73.5 | 72.4 | 46.9 | 37.7 | 32.4 | 27.5 |
| Departure From Normal | -10.7 | -5.3 | +1.8 | -3.2 | -0.1 | +0.1 | -0.8 | +6.8 | -5.7 | -1.0 | +4.8 | +1.5 |
| Precipitation (in) | 0.68 | 2.65 | 1.21 | 7.78 | 4.86 | 4.27 | 7.57 | 1.66 | 1.25 | 1.38 | 1.82 | 0.98 |
| Departure From Normal | +0.19 | +0.86 | -1.35 | +3.21 | +1.06 | +0.53 | +4.27 | -0.90 | -0.74 | +0.09 | +1.21 | +0.57 |
| Snowfall (in) | 11.6 | 5.3 | 0.5 | 0.0 | 0.0 | 0.0 | 0.0 | 0.0 | 1.2 | 8.1 | 5.9 | 4.1 |
| Departure From Normal | +5.1 | +0.1 | -0.7 | 0.0 | 0.0 | 0.0 | 0.0 | -0.2 | +0.2 | +5.5 | -0.2 | -1.9 |
Kearney - 12 Month Climate History:
All data here is from the official NWS observer at Kearney airport, with 24-hour observations taken around 7 a.m. ** PLEASE NOTE: This official Kearney data often differs slightly from the unofficial data recorded by the automated airport system (KEAR) **
| Kearney Airport (Coop Observer) - Feb. 2019 - Jan. 2020 | ||||||||||||
| Feb. | Mar. | Apr. | May | June | July | Aug. | Sept. | Oct. | Nov. | Dec. | Jan. | |
| Average High (F) | 27.0 | 41.8 | 64.4 | 65.3 | 80.1 | 85.5 | 82.1 | 81.9 | 59.5 | 48.4 | 41.0 | 35.2 |
| Average Low (F) | 7.0 | 22.2 | 36.1 | 44.5 | 56.4 | 64.2 | 62.4 | 57.3 | 33.2 | 24.5 | 21.6 | 18.2 |
| Average Temperature (F) | 17.0 | 32.0 | 50.3 | 54.9 | 68.3 | 74.9 | 72.2 | 69.6 | 46.4 | 36.5 | 31.3 | 26.7 |
| Departure From Normal | -11.1 | -5.7 | +1.6 | -4.6 | -1.5 | +0.2 | -0.4 | +6.1 | -4.5 | -0.5 | +5.4 | +2.1 |
| Precipitation (in) | 1.06 | 4.78 | 1.80 | 7.97 | 5.50 | 7.25 | 3.71 | 1.20 | 1.80 | 1.74 | 2.00 | 0.82 |
| Departure From Normal (in) | +0.51 | +2.99 | -0.43 | +3.79 | +1.57 | +3.97 | +0.63 | -0.87 | -0.24 | +0.72 | +1.43 | +0.33 |
| Snowfall (in) | 12.9 | 8.6 | 3.1 | 0.0 | 0.0 | 0.0 | 0.0 | 0.0 | 1.7 | 9.0 | 12.8 | 1.8 |
| Departure From Normal (in) | +7.8 | +4.0 | +1.3 | 0.0 | 0.0 | 0.0 | 0.0 | -0.2 | +1.0 | +5.9 | +9.3 | -2.6 |
Ord - 12 Month Climate History:
All snowfall data is from the NWS Cooperative Observer in town. In addition, winter precipitation totals often include Cooperative Observer data given that the automated airport equipment is not designed to accurately melt snowfall liquid equivalent.
| Ord (Evelyn Sharp Field ASOS) - Feb. 2019 - Jan. 2020 | ||||||||||||
| Feb. | Mar. | Apr. | May | June | July | Aug. | Sept. | Oct. | Nov. | Dec. | Jan. | |
| Average High (F) | 26.3 | 42.7 | 62.8 | 66.5 | 80.7 | 85.2 | 80.2 | 81.7 | 57.1 | 47.5 | 39.1 | 34.5 |
| Average Low (F) | 6.7 | 22.0 | 34.8 | 43.5 | 55.9 | 63.6 | 61.7 | 56.6 | 29.6 | 20.7 | 17.7 | 16.6 |
| Average Temperature (F) | 16.5 | 32.3 | 48.8 | 55.0 | 68.3 | 74.4 | 70.9 | 69.2 | 43.4 | 34.1 | 28.8 | 25.6 |
| Departure From Normal | -11.3 | -5.4 | 0.0 | -4.3 | -0.9 | 0.0 | -2.1 | +5.6 | -6.2 | -2.2 | +3.9 | +1.0 |
| Precipitation (in) | 1.05 | 4.15 | 2.87 | 7.03 | 3.76 | 4.34 | 9.81 | 0.92 | 1.80 | 1.15 | 1.59 | 0.77 |
| Departure From Normal (in) | +0.61 | +2.70 | +0.28 | +3.22 | -0.36 | +1.37 | +6.65 | -1.52 | -0.13 | +0.08 | +1.00 | +0.40 |
| Snowfall (in) | 15.8 | 13.6 | 6.0 | 0.0 | 0.0 | 0.0 | 0.0 | 0.0 | T | 8.6 | 16.3 | 4.8 |
| Departure From Normal (in) | +9.8 | +7.7 | +3.5 | 0.0 | 0.0 | 0.0 | 0.0 | -0.2 | +1.1 | +3.3 | +8.9 | -2.0 |
Smith Center, KS - 12 Month Climate History:
All data is from the official NWS observer, with 24-hour observations taken around 7 a.m.
| Smith Center KS (NWS Coop Observer) - Feb. 2019 - Jan. 2020 | ||||||||||||
| Feb. | Mar. | Apr. | May | June | July | Aug. | Sept. | Oct. | Nov. | Dec. | Jan. | |
| Average High (F) | 32.4 | 47.0 | 69.5 | 70.5 | 85.4 | 91.9 | 87.4 | 86.6 | 63.1 | 51.9 | 45.8 | 39.4 |
| Average Low (F) | 11.8 | 24.1 | 37.9 | 46.9 | 58.5 | 65.3 | 64.7 | 60.9 | 34.8 | 23.9 | 21.8 | 20.0 |
| Average Temperature (F) | 22.1 | 35.6 | 53.7 | 58.7 | 72.0 | 78.6 | 76.1 | 73.8 | 49.0 | 37.9 | 33.8 | 29.7 |
| Departure From Normal | -9.9 | -6.0 | +1.2 | -5.0 | -2.0 | -1.1 | -1.1 | +5.6 | -5.8 | -2.5 | +5.0 | +2.0 |
| Precipitation (in) | 0.86 | 1.57 | 0.09 | 5.31 | 2.92 | 4.38 | 4.57 | 1.23 | 2.17 | 0.63 | 2.09 | 0.92 |
| Departure From Normal (in) | +0.28 | -0.30 | -2.18 | +1.39 | -0.69 | +0.51 | +1.27 | -0.81 | +0.29 | -0.59 | +1.43 | +0.43 |
| Snowfall (in) | 12.4 | 7.0 | 1.0 | 0.0 | 0.0 | 0.0 | 0.0 | 0.0 | 0.5 | 2.4 | 2.9 | 1.9 |
| Departure From Normal (in) | +8.3 | +4.4 | +0.4 | 0.0 | 0.0 | 0.0 | 0.0 | -0.2 | +0.1 | +0.6 | -0.3 | -1.8 |
Temperature & Precipitation Departure From Normal Maps:
These images depict January 2020 monthly temperature departure from normal & precipitation percent-of-normal for both Nebraska & Kansas. Images are courtesy of the High Plains Regional Climate Center (HPRCC). Please note: These maps occasionally contain "bullseyes" of errant data. For precipitation, you can also generate departure from normal/percent-of-normal maps using the NWS AHPS page, or view local-area images generated each day by NWS Hastings.
 |
 |
 |
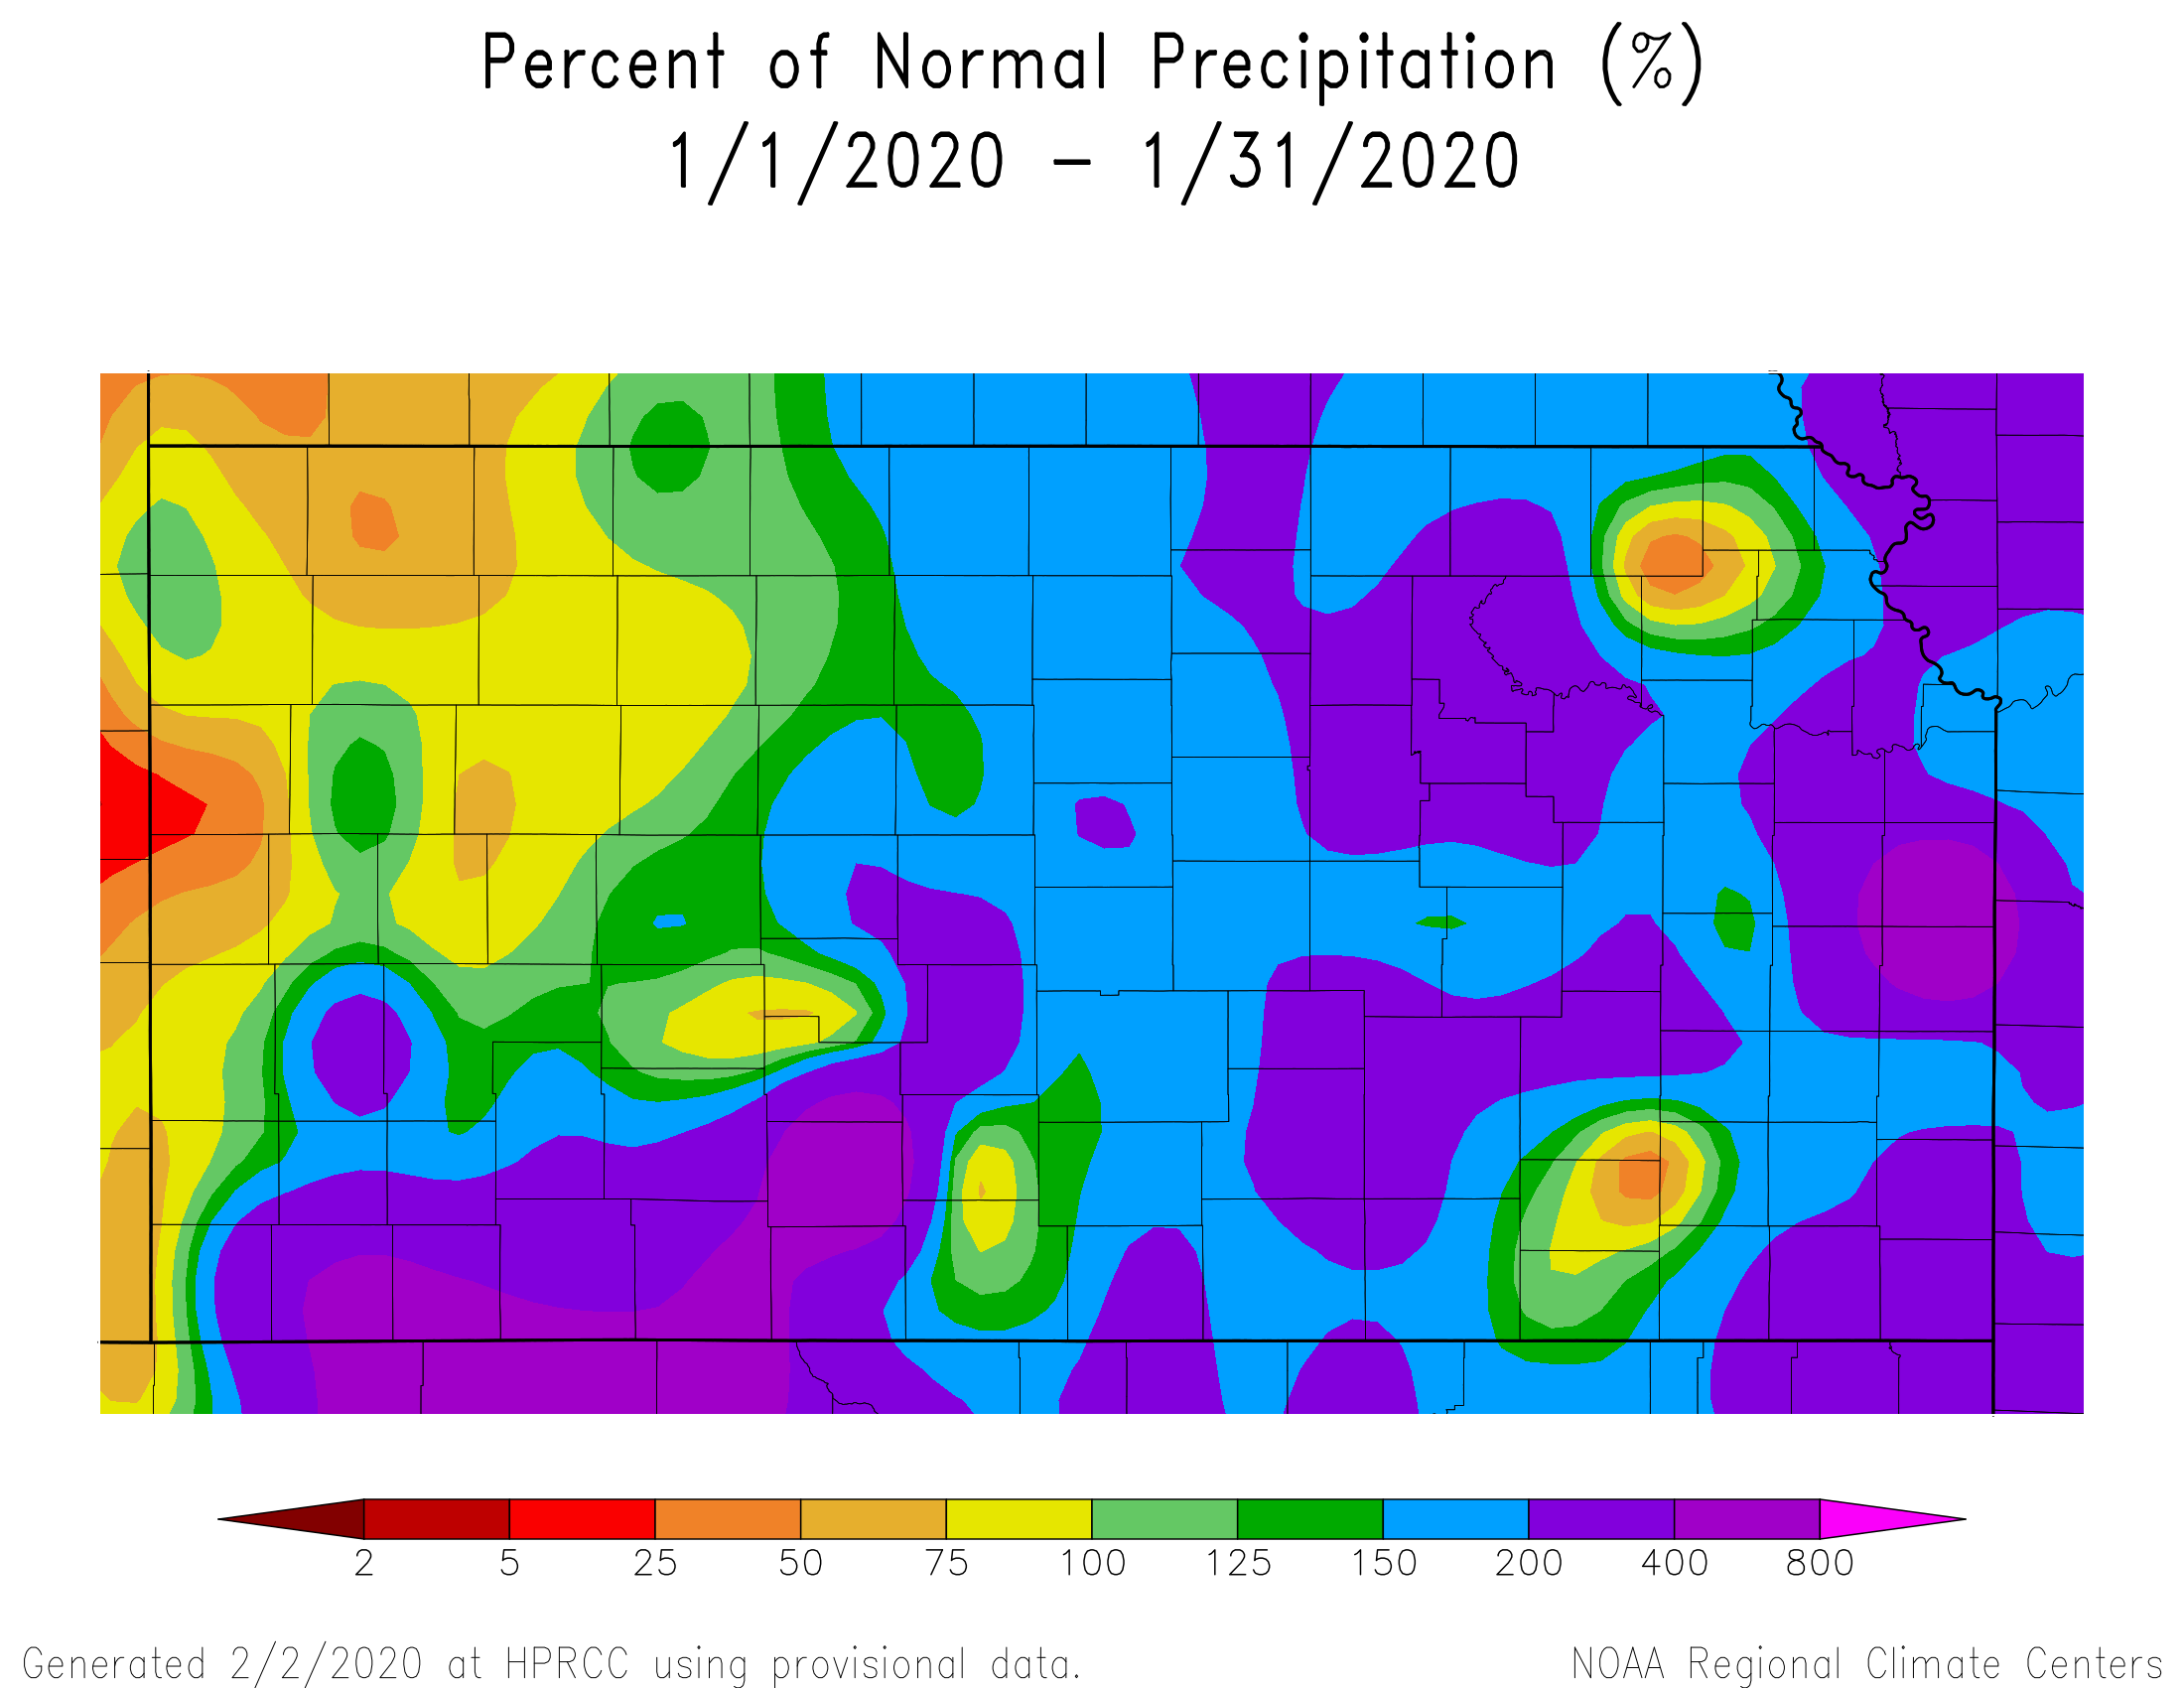 |
| Departure from Normal Temperature - NE (left) & KS (right) | Percent of Normal Precipitation - NE (left) & KS (right) | ||
Drought:
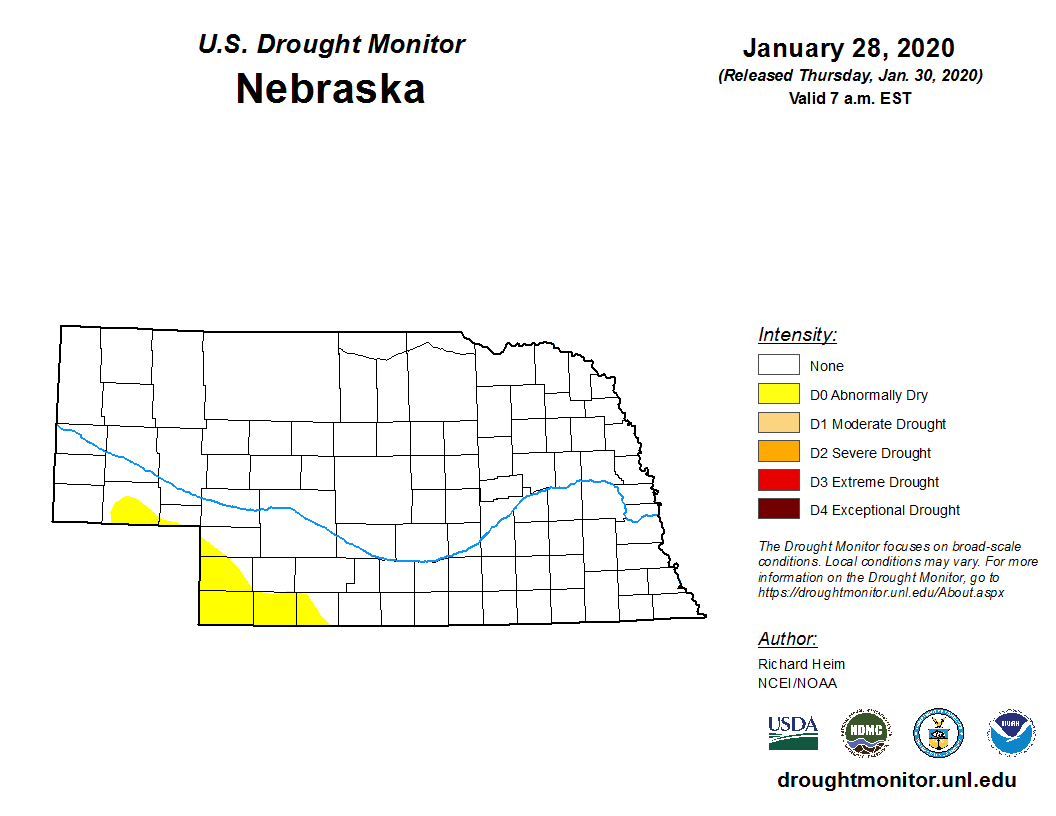
The following drought images, current as of January 28, 2020, are courtesy of the U.S. Drought Monitor
Summary of changes during January 2020 across the NWS Hastings coverage area:
Primarily due to considerable precipitation associated with the late-December 2019 winter storm, the previous area of Abnormally Dry (Category D0) within Furnas County was removed during January (this D0 area had been introduced in late-October and then expanded to include more of Furnas County in late-November). As a result, the ENTIRE NWS HASTINGS AREA is void of all drought categories for the first time in three months.
 |
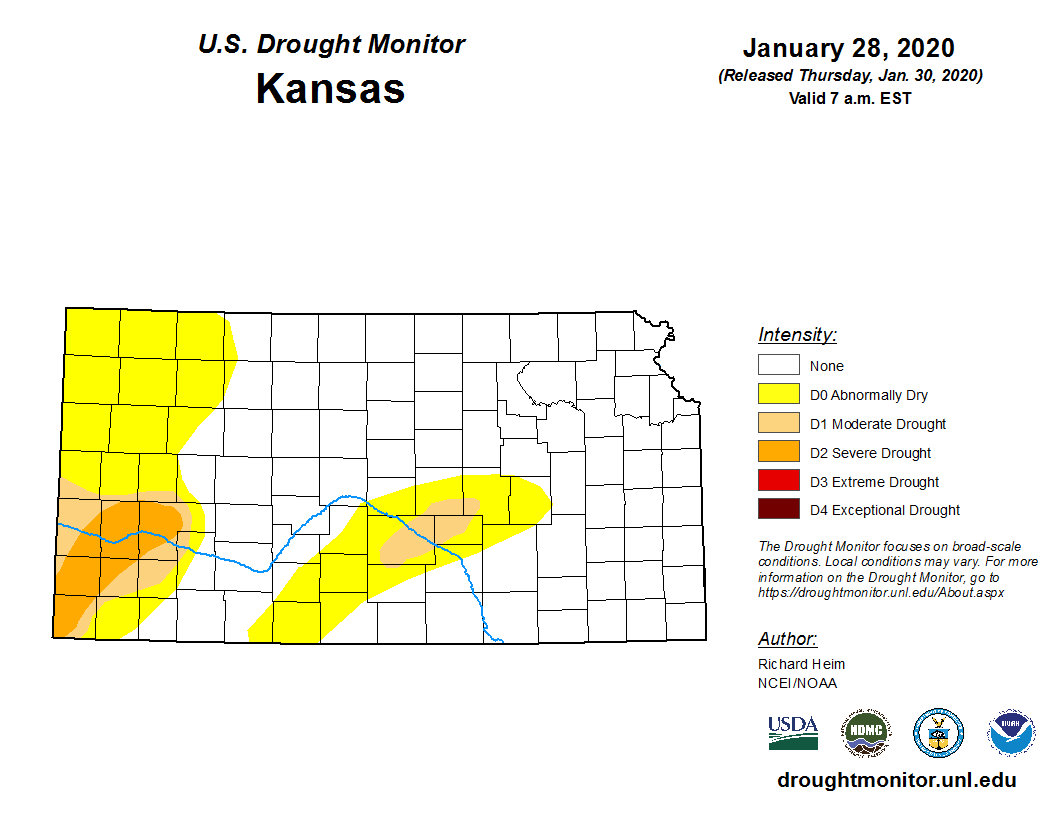 |
| Drought Monitor for Nebraska (left) & Kansas (right). Valid as of January 28, 2020 (click to enlarge) | |
January 2020 Extremes for the NWS Hastings Coverage Area:
...SOME OF THE WARMEST HIGH TEMPERATURES DURING JANUARY 2020...
(all data from NWS cooperative observers or automated airport sites, with the date it actually occurred indicated in parentheses)
59...Plainville KS 4WNW (26th)
57...Edison (26th) - Beloit (26th)
56...Harlan County Lake (26th) - Smith Center KS (26th) - Superior (26th) - Franklin (26th)
55...Oxford 6NNW (26th)
...SOME OF THE COLDEST LOW TEMPERATURES DURING JANUARY 2020...
(all data from NWS cooperative observers or automated airport sites, with the date it actually occurred indicated in parentheses)
-5...Osceola (20th)
-4...York 3N (21st)
-3...Greeley (11th/16th)
-2...Ravenna (11th)
...SOME OF THE HIGHEST MONTHLY PRECIPITATION TOTALS DURING JANUARY 2020...
(all data from NWS cooperative observers and CoCoRaHS/NeRAIN observers unless indicated)
1.85"...Hebron
1.41"...Osceola
1.40"...Elba 2W
1.36"...York 3N
1.32"...Bladen 4SW
1.30"...Bradshaw
1.25"...McCool Junction 1ENE
1.24"...Superior 6NE - Stromsburg 2SE
1.22"...Blue Hill 2NE - Grafton 3SSE
...SOME OF THE LOWEST MONTHLY PRECIPITATION TOTALS DURING JANUARY 2020...
(all data from NWS cooperative observers and CoCoRaHS/NeRAIN observers unless indicated)
0.25"...Lexington 1E
0.45"...Spalding 7SSW
0.52"...Beaver City - Arcadia 2W
0.55"...Edison - Cambridge
0.59"...Elwood 8S
0.63"...Ravenna
0.64"...Orleans 2W
0.66"...Miller
...SOME OF THE HIGHEST MONTHLY SNOWFALL TOTALS DURING JANUARY 2020...
(all data from NWS cooperative observers and CoCoRaHS/NeRAIN observers unless indicated)
7.2"...Geneva
6.5"...Nelson
6.4"...Hebron
6.2"...Stromsburg 1E
5.7"...Osceola - Shelby 3NE
5.5"...Superior 6NE
5.4"...Clay Center 6ESE
5.3"...Scotia 8NNE - Tobias 2WSW
 |
Media use of NWS Web News Stories is encouraged! Please acknowledge the NWS as the source of any news information accessed from this site. |
 |