Overview:
|
Brief Recap of Jan. 2017: January featured WELL-ABOVE NORMAL PRECIPITATION across most of our 30-county coverage area, with most places totaling between 0.75"-1.50". Although most locations saw at least a little snow (including 6+" from a late-month storm in far northern counties such as Valley), the majority of monthly precipitation across the area as a whole fell in the form of rain or freezing rain. Much of this freezing rain fell on the 15th-16th, as several counties endured their worst ice storm in at least 10 years. Temperature-wise, most of the region averaged from very-near normal to around 2.5º above normal for the month (slightly above normal). However, the first week of the month was quite cold before the remainder of the month averaged noticeably milder overall.
(BE SURE TO CLICK THE VARIOUS TABS BELOW FOR A VARIETY OF JAN. 2017 CLIMATE INFORMATION!) |
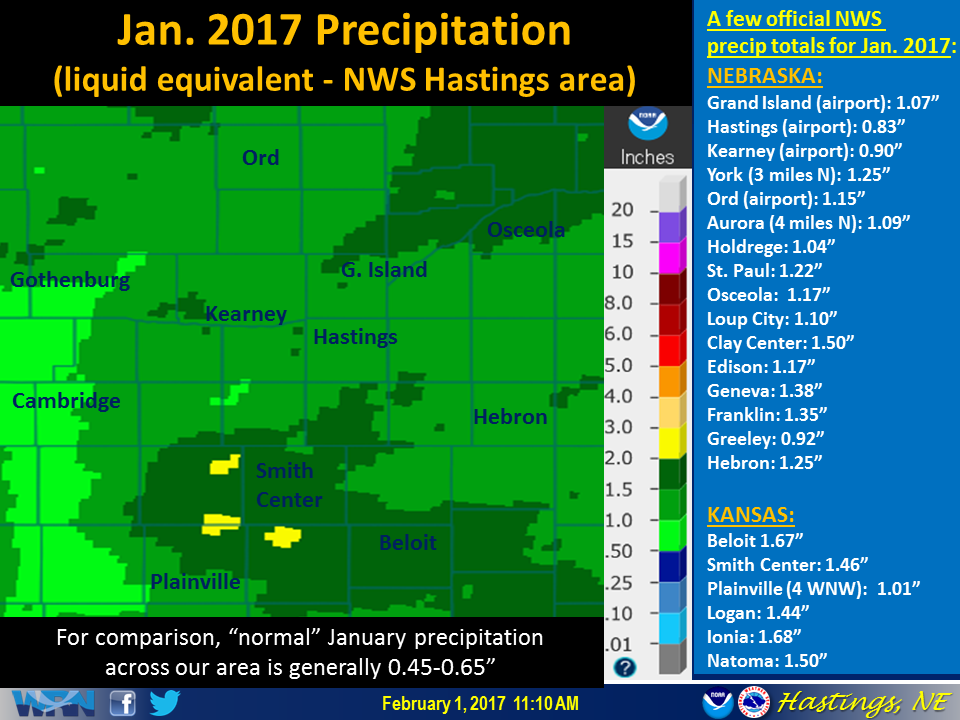 This graphic features a precipitation map for Jan. 2017, along with a partial listing of totals from official NWS stations. (Click image to enlarge) |
Grand Island & Hastings Details (Including 12-Month History):
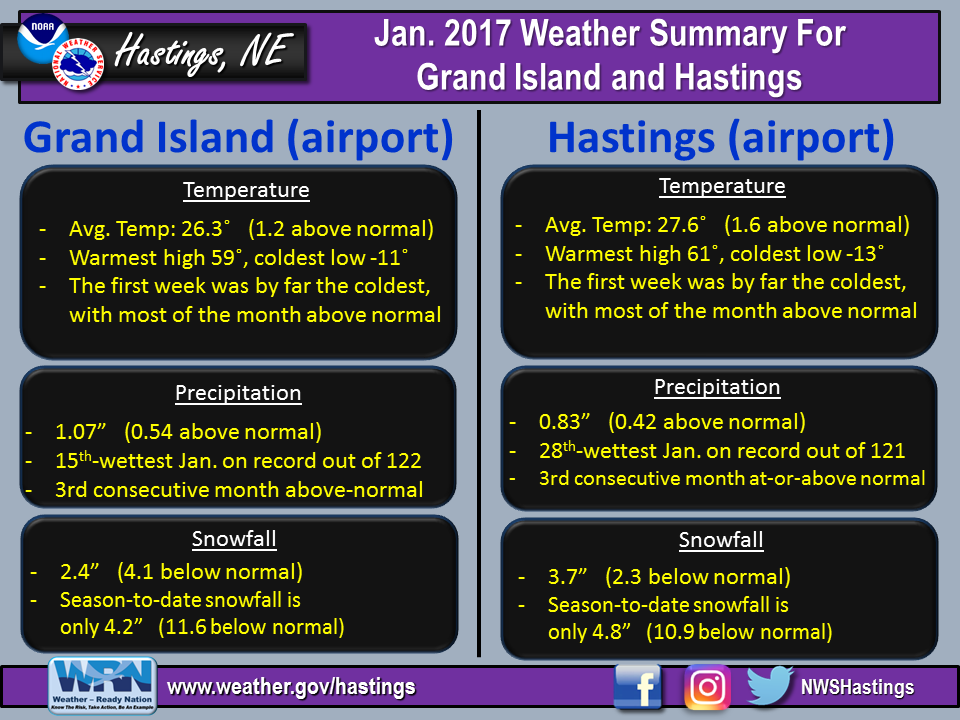 |
| Detailed Jan. 2017 info for Grand Island/Hastings (Click to enlarge) |
 |
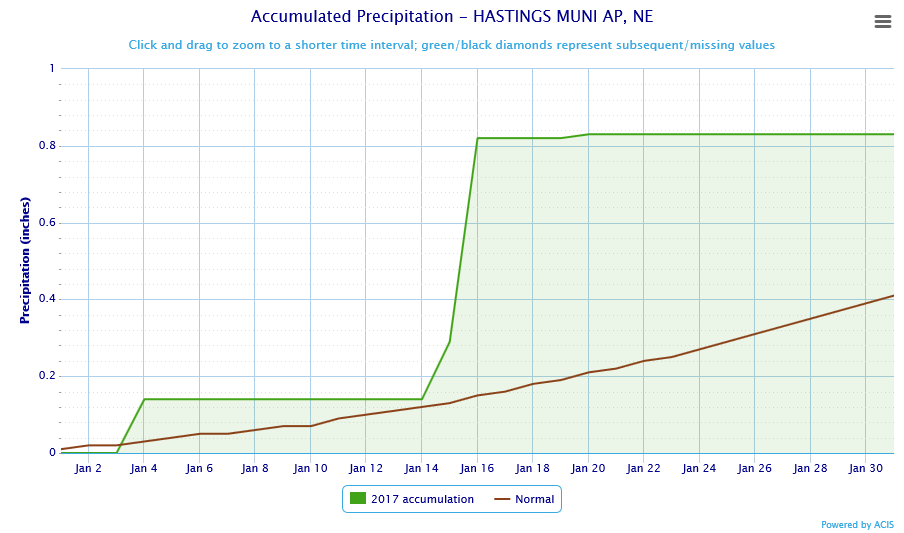 |
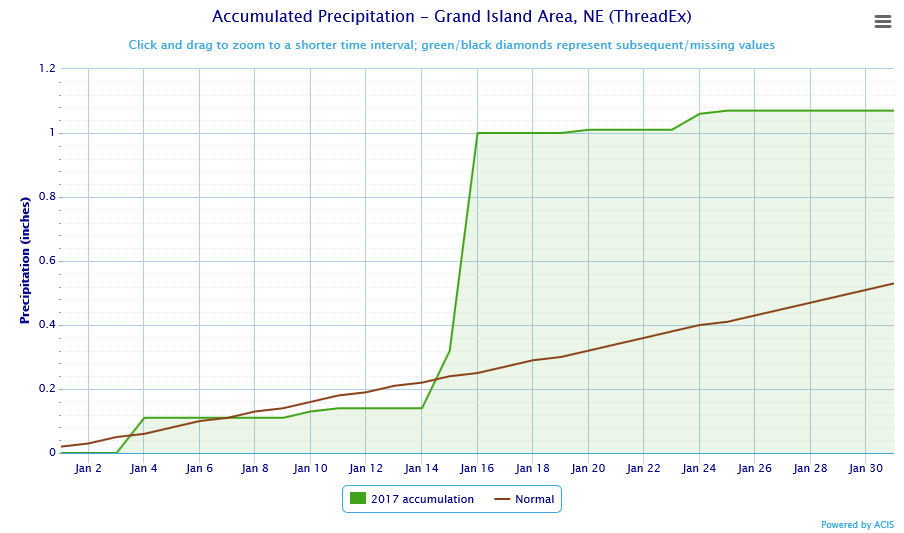
| Grand Island Precipitation Summary: The green line indicates cumulative observed precipitation for January 2017.The brown line indicates "normal" January precipitation based on 30-year data from 1981-2010. (click to enlarge) | Hastings Precipitation Summary: The green line indicates cumulative observed precipitation for January 2017. The brown line indicates "normal" January precipitation based on 30-year data from 1981-2010. (click to enlarge) |
| Grand Island (Regional Airport) - February 2016 - January 2017 | ||||||||||||
| Feb. | Mar. | Apr. | May | June | July | Aug. | Sep. | Oct. | Nov. | Dec. | Jan. | |
| Average High (F) | 45.0 | 59.6 | 64.4 | 71.9 | 89.6 | 87.0 | 84.4 | 78.8 | 70.7 | 57.3 | 37.3 | 34.6 |
| Average Low (F) | 25.0 | 32.0 | 40.4 | 48.5 | 63.2 | 65.1 | 62.7 | 55.0 | 42.6 | 32.7 | 14.5 | 17.9 |
| Average Temperature (F) | 35.3 | 45.8 | 52.4 | 60.2 | 76.4 | 76.0 | 73.5 | 66.9 | 56.7 | 45.0 | 25.9 | 26.3 |
| Departure From Normal | +6.2 | +6.4 | +1.8 | -1.0 | +5.1 | -0.2 | -0.5 | +1.8 | +4.5 | +6.9 | -0.8 | +1.2 |
| Precipitation (in) | 1.86 | 0.61 | 5.05 | 6.84 | 0.05 | 4.10 | 0.57 | 2.53 | 0.12 | 1.37 | 0.81 | 1.07 |
| Departure From Normal | +1.18 | -1.19 | +2.52 | +2.43 | -4.25 | +0.70 | -2.55 | +0.30 | -1.74 | +0.20 | +0.18 | +0.54 |
| Snowfall (in) | 18.6 | 2.6 | 0.0 | 0.0 | 0.0 | 0.0 | 0.0 | 0.0 | 0.0 | 0.4 | 1.4 | 2.4 |
| Departure From Normal | +12.3 | -2.8 | -1.5 | 0.0 | 0.0 | 0.0 | 0.0 | -0.1 | -1.0 | -2.7 | -3.7 | -4.1 |
| Hastings (Municipal Airport) - February 2016 - January 2017 | ||||||||||||
| Feb. | Mar. | Apr. | May | June | July | Aug. | Sep. | Oct. | Nov. | Dec. | Jan. | |
| Average High (F) | 45.4 | 60.0 | 64.6 | 71.0 | 89.1 | 87.7 | 84.9 | 78.6 | 71.3 | 57.4 | 37.7 | 35.7 |
| Average Low (F) | 24.9 | 32.7 | 41.0 | 48.9 | 64.0 | 66.0 | 63.4 | 56.1 | 44.0 | 34.2 | 15.6 | 19.4 |
| Average Temperature (F) | 35.2 | 46.3 | 52.8 | 59.9 | 76.5 | 76.9 | 74.1 | 67.3 | 57.6 | 45.8 | 26.6 | 27.6 |
| Departure From Normal (F) | +5.3 | +6.4 | +2.1 | -1.4 | +4.7 | -0.2 | -0.2 | +1.7 | +5.0 | +7.1 | -1.0 | +1.6 |
| Precipitation (in) | 1.57 | 0.54 | 5.69 | 3.68 | 0.75 | 2.22 | 1.77 | 1.80 | 0.22 | 1.46 | 0.61 | 0.83 |
| Departure From Normal (in) | +1.08 | -1.25 | +3.13 | -0.89 | -3.05 | -1.52 | -1.53 | -0.76 | -1.77 | +0.17 | 0.00 | +0.42 |
| Snowfall (in) | 16.0 | 2.1 | 0.0 | 0.0 | 0.0 | 0.0 | 0.0 | 0.0 | 0.0 | 0.1 | 1.0 | 3.7 |
| Departure From Normal (in) | +9.5 | -3.1 | -1.2 | 0.0 | 0.0 | 0.0 | 0.0 | -0.2 | -1.0 | -2.5 | -5.1 | -2.3 |
Kearney - 12 Month Climate History:
All data here is from the official NWS observer at Kearney airport, with 24-hour observations taken around 7 a.m. ** PLEASE NOTE: This official Kearney data differs somewhat from the unofficial data presented by the automated airport system (KEAR) **
| Kearney Airport (Coop Observer) - February 2016 - January 2017 | ||||||||||||
| Feb. | Mar. | Apr. | May | June | July | Aug. | Sep. | Oct. | Nov. | Dec. | Jan. | |
| Average High (F) | 45.7 | 59.5 | 63.2 | 69.5 | 87.4 | 86.4 | 84.3 | 79.3 | 70.8 | 58.6 | 37.8 | 36.9 |
| Average Low (F) | 24.1 | 27.4 | 39.5 | 46.6 | 61.7 | 63.4 | 61.8 | 53.0 | 40.8 | 33.4 | 14.8 | 19.5 |
| Average Temperature (F) | 34.9 | 43.5 | 51.4 | 58.1 | 74.6 | 74.9 | 73.1 | 66.2 | 55.8 | 46.0 | 26.3 | 28.2 |
| Departure From Normal (F) | +6.8 | +5.8 | +2.7 | +1.4 | +4.8 | +0.2 | +0.5 | +2.7 | +4.9 | +9.0 | +0.4 | +3.6 |
| Precipitation (in) | 0.98 | 0.56 | 8.39 | 2.30 | 0.61 | 3.38 | 1.47 | 1.20 | 0.12 | 1.56 | 0.90 | 0.90 |
| Departure From Normal (in) | +0.43 | -1.23 | +6.16 | -1.88 | -3.32 | +0.10 | -1.61 | -0.87 | -1.92 | +0.54 | +0.33 | +0.41 |
| Snowfall (in) | 11.0 | 3.0 | 0.0 | 0.0 | 0.0 | 0.0 | 0.0 | 0.0 | 0.0 | 0.2 | 1.0 | 4.5 |
| Departure From Normal (in) | +5.9 | -1.6 | -1.8 | 0.0 | 0.0 | 0.0 | 0.0 | -0.2 | -0.7 | -2.9 | -2.5 | +0.1 |
Ord - 12 Month Climate History:
Winter precipitation totals often include NWS Cooperative Observer data due to the automated airport equipment under-measuring snowfall liquid equivalent.
| Ord (Evelyn Sharp Field Airport) - February 2016 - January 2017 | ||||||||||||
| Feb | Mar | April | May | June | July | Aug | Sep | Oct | Nov | Dec | Jan | |
| Average High (F) | 45.9 | 58.5 | 61.7 | 71.1 | 86.8 | 85.2 | 83.6 | 77.2 | 70.3 | 56.7 | 37.6 | 34.1 |
| Average Low (F) | 21.8 | 27.0 | 38.7 | 45.7 | MSG | 62.3 | 60.4 | MSG | 37.4 | 28.1 | 9.3 | 14.2 |
| Average Temperature (F) | 33.9 | 42.7 | 50.2 | 58.4 | MSG | 73.8 | 72.0 | MSG | 53.8 | 42.4 | 23.5 | 24.1 |
| Departure From Normal (F) | +6.1 | +5.0 | +1.4 | -0.9 | MSG | -0.6 | -1.0 | MSG | +4.2 | +6.1 | -1.4 | -0.5 |
| Precipitation (in) | 0.85 | 1.35 | 8.99 | 5.05 | 3.52 | 6.66 | 0.44 | 1.70 | 0.09 | 1.26 | 0.41 | 1.15 |
| Departure From Normal (in) | +0.41 | -0.10 | +6.40 | +1.24 | -0.60 | +3.69 | -2.72 | -0.74 | -1.84 | +0.19 | -0.18 | +0.78 |
| Snowfall (in) | 12.0 | 8.0 | Trace | 0.0 | 0.0 | 0.0 | 0.0 | 0.0 | 0.0 | 3.0 | 2.7 | 11.9 |
| Departure From Normal (in) | +6.0 | +2.1 | -2.5 | 0.0 | 0.0 | 0.0 | 0.0 | 0.0 | -1.1 | -2.3 | -4.7 | +5.1 |
Smith Center, KS - 12 Month Climate History:
All data is from the official NWS observer, with 24-hour observations taken around 7 a.m. As a result, data may vary slightly from true "Calendar Day" totals.
| Smith Center KS (NWS Coop Observer) - Feb 2016 - Jan 2017 | ||||||||||||
| Feb | Mar | Apr | May | June | July | Aug | Sep | Oct | Nov | Dec | Jan | |
| Average High (F) | 49.8 | 63.1 | 67.3 | 72.7 | 91.7 | 90.5 | 86.5 | 81.3 | 73.9 | 61.0 | 38.7 | 39.0 |
| Average Low (F) | 24.0 | 30.1 | 39.3 | 48.6 | 63.0 | 66.1 | 62.8 | 55.6 | 43.5 | 32.9 | 14.2 | 18.5 |
| Average Temperature (F) | 36.9 | 46.6 | 53.3 | 60.7 | 77.4 | 78.3 | 74.7 | 68.5 | 58.7 | 47.0 | 26.5 | 28.7 |
| Departure From Normal (F) | +4.9 | +5.0 | +0.8 | -3.7 | +3.4 | -1.4 | -2.5 | +0.3 | +3.9 | +6.6 | -2.3 | +1.0 |
| Precipitation (in) | 0.98 | 0.22 | 5.40 | 4.38 | 3.11 | 6.07 | 5.13 | 5.07 | 0.09 | 0.99 | 0.56 | 1.46 |
| Departure From Normal (in) | +0.40 | -1.65 | +3.13 | +0.46 | -0.50 | +2.20 | +1.83 | +3.03 | -1.79 | -0.23 | -0.10 | +0.97 |
| Snowfall (in) | 8.6 | 0.5 | 0.0 | 0.0 | 0.0 | 0.0 | 0.0 | 0.0 | 0.0 | 0.0 | 3.1 | 1.1 |
| Departure From Normal (in) | +4.5 | -1.9 | -0.6 | 0.0 | 0.0 | 0.0 | 0.0 | -0.2 | -0.4 | -1.8 | -0.1 | -2.6 |
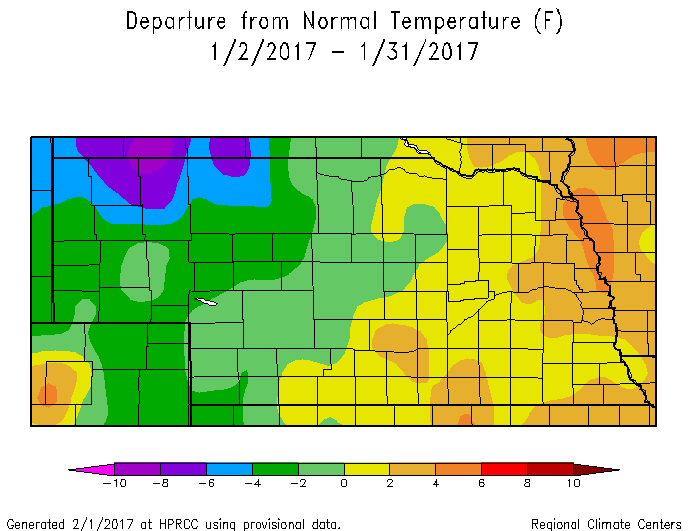
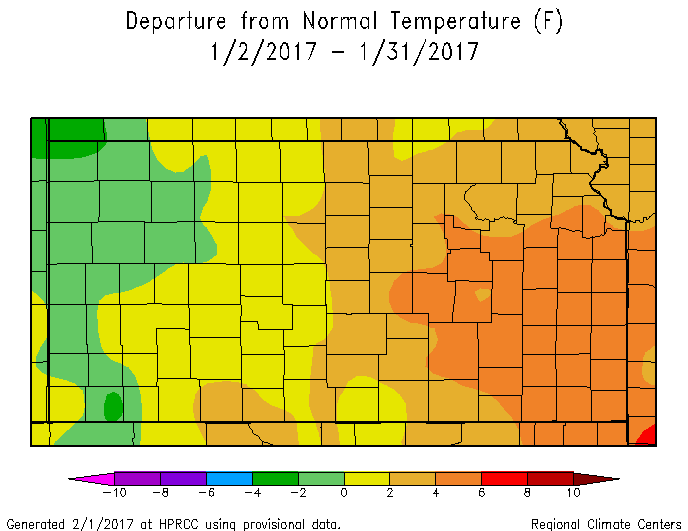
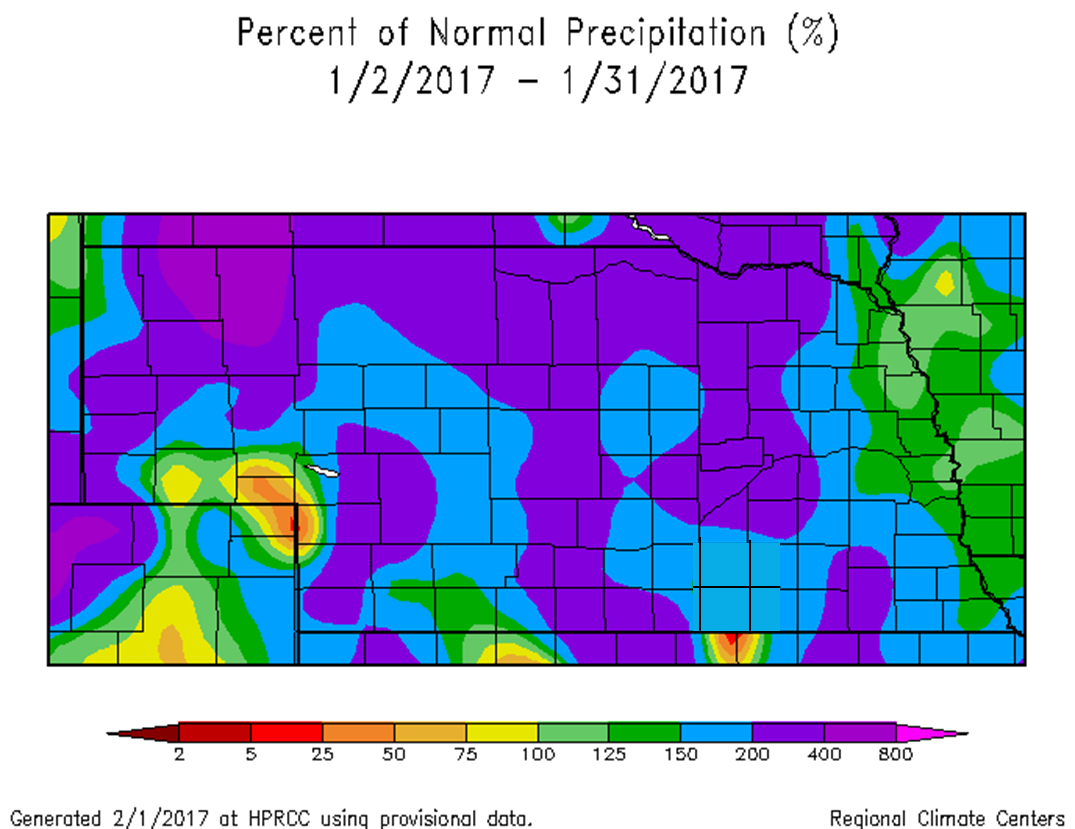
Area Temperature & Precipitation Departure From Normal Maps:
These images depict Jan. 2017 monthly temperature departure from normal & precipitation percent-of-normal for both Nebraska & Kansas. Images are courtesy of the High Plains Regional Climate Center (HPRCC). Click images to enlarge.
 |
 |
 |
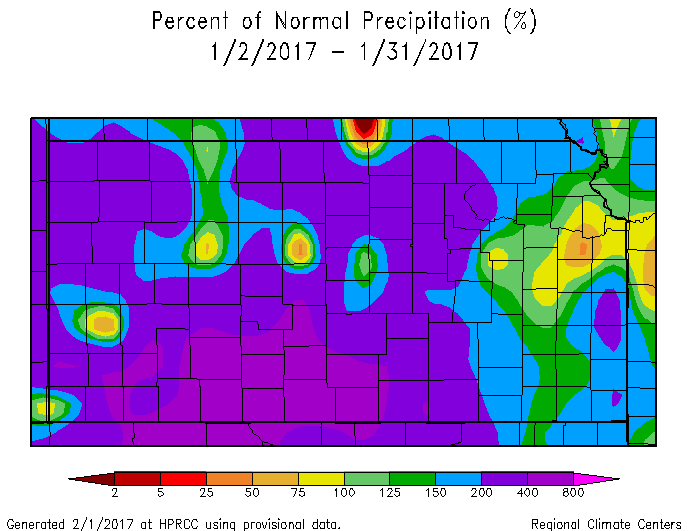 |
| Departure from Normal Temperature - NE (left) & KS (right) | Percent of Normal Precipitation - NE (left) & KS (right) | ||
Drought:
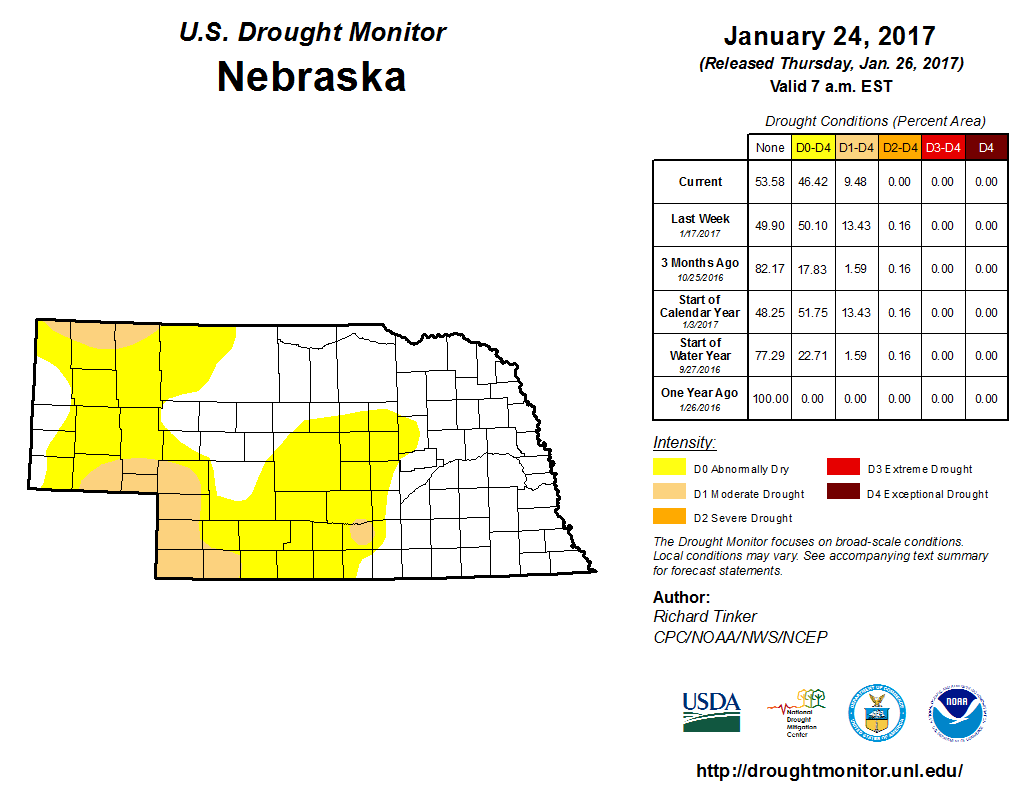
The following drought images, current as of Jan. 24, 2017, are courtesy of the U.S. Drought Monitor
Brief summary of changes during Jan. 2017 for the NWS Hastings coverage area:
- South Central Nebraska: A narrow, north-south corridor of Moderate Drought (D1) was improved to Abnormally Dry (D0), while a small area of Severe Drought (D2) over Kearney County was improved to Moderate Drought (D1).
- North Central Kansas: Essentially no change whatsoever, with an area of Abnormally Dry (D0) lingering over Rooks/Phillips/Smith/Osborne counties.
 |
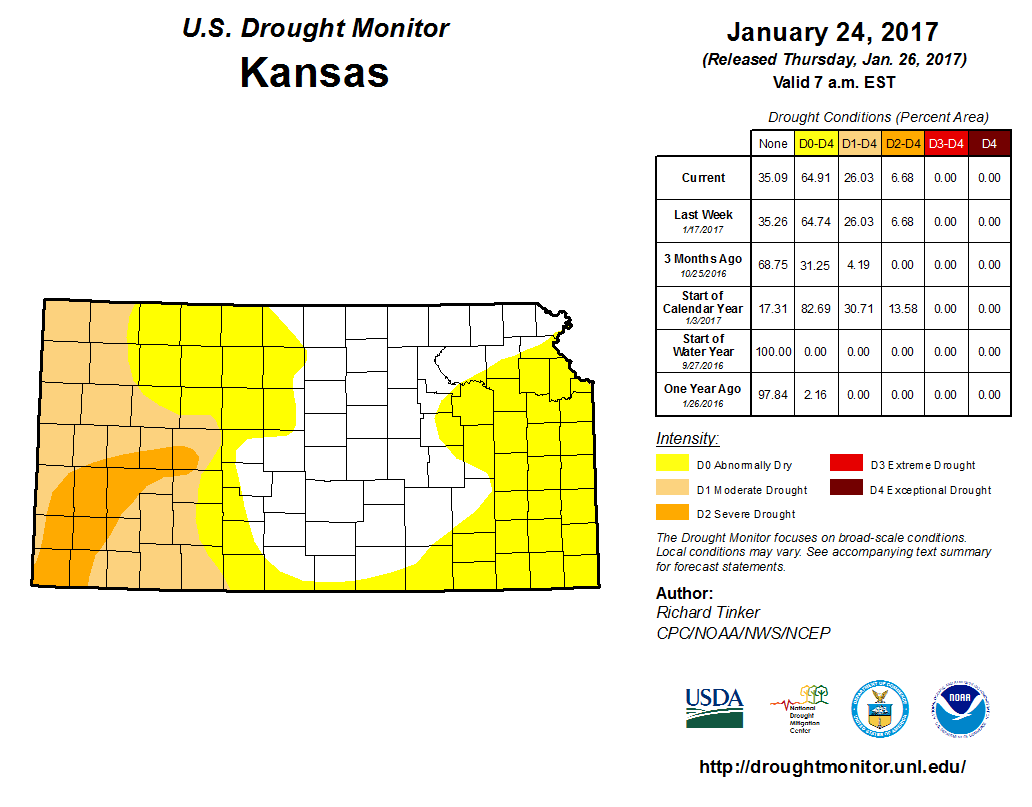 |
| Drought Monitor for Nebraska (left) & Kansas (right). Valid as of January 24, 2017 (click to enlarge) | |
Monthly Extremes for the NWS Hastings Coverage Area:
...A FEW OF THE WARMEST HIGH TEMPERATURES DURING JANUARY 2017...
(all data from NWS cooperative observers and occurred on the 30th)
66 degrees...Beaver City - 4WNW Plainville KS - Webster Dam KS - Beloit KS
65 degrees...Edison - Kirwin Dam KS - Lovewell Dam KS
64 degrees...Superior - Cambridge - Smith Center KS - Burr Oak KS
...A FEW OF THE COLDEST LOW TEMPERATURES DURING JANUARY 2017...
(all data from NWS cooperative observers or automated airport sites and occurred on the 6th)
-20 degrees...Lexington airport (6th)
-17 degrees...Kearney airport (6th) - Ravenna - 6SSE Lexington (Canaday Plant)
-16 degrees...Gothenburg
...A FEW OF THE HIGHEST MONTHLY PRECIPITATION TOTALS DURING JANUARY 2017...
(all data from NWS cooperative observers or automated airport sites, unless specified)
2.09"...Cawker City KS
1.86"...Glen Elder Dam KS
1.68"...Ionia KS
1.67"...Beloit KS
1.64"...Kirwin Dam KS
...A FEW OF THE LOWEST MONTHLY PRECIPITATION TOTALS DURING JANUARY 2017...
(all data from NWS cooperative observers or automated airport sites, unless specified)
0.69"...Gothenburg
0.70"...Superior
0.75"...Minden - 6SSE Lexington (Canaday Plant)
0.78"...Cozad - 8S Elwood
0.85"...Miller
...A FEW OF THE HIGHEST MONTHLY SNOWFALL TOTALS DURING JANUARY 2017...
(all data from NWS cooperative observers, unless specified)
11.9"...Ord
9.2"...Greeley
8.5"...Arcadia
7.5"...Loup City
6.7"...Miller
 |
Media use of NWS Web News Stories is encouraged! Please acknowledge the NWS as the source of any news information accessed from this site. |
|

