
Excessive rainfall continues to produce life-threatening, locally catastrophic flash flooding along the central Gulf Coast. Isolated to scattered dry thunderstorms may cause lightning-ignited fires and erratic behavior due to gusty winds across parts Oregon, California, and the Great Basin into the weekend. Read More >
Overview
|
"Three-sentence summary" for Dec. 2016: December featured near-to-slightly above normal precipitation across the majority of our 30-county coverage area, most of which fell in the form of rain and not snow! Temperature-wise, most of the area averaged out 1.0 to 2.5º below normal for the month (slightly below normal). However, roughly the first 3 weeks of the month actually averaged well-below normal, before the final 12 days or so turned considerably milder. This information focuses on climate and weather highlights across the NWS Hastings coverage area, encompassing 24 counties in south central/central Nebraska, and 6 counties in north central Kansas. Click here for a map of this coverage area. The temperature and precipitation data presented here are largely based on the NWS Cooperative Observer network, along with data from a handful of automated airport sites. All climate averages and "normals" presented here are based on the official NCEI 1981-2010 normals. 2016 Nebraska Cooperative Observer Precipitation Tables |
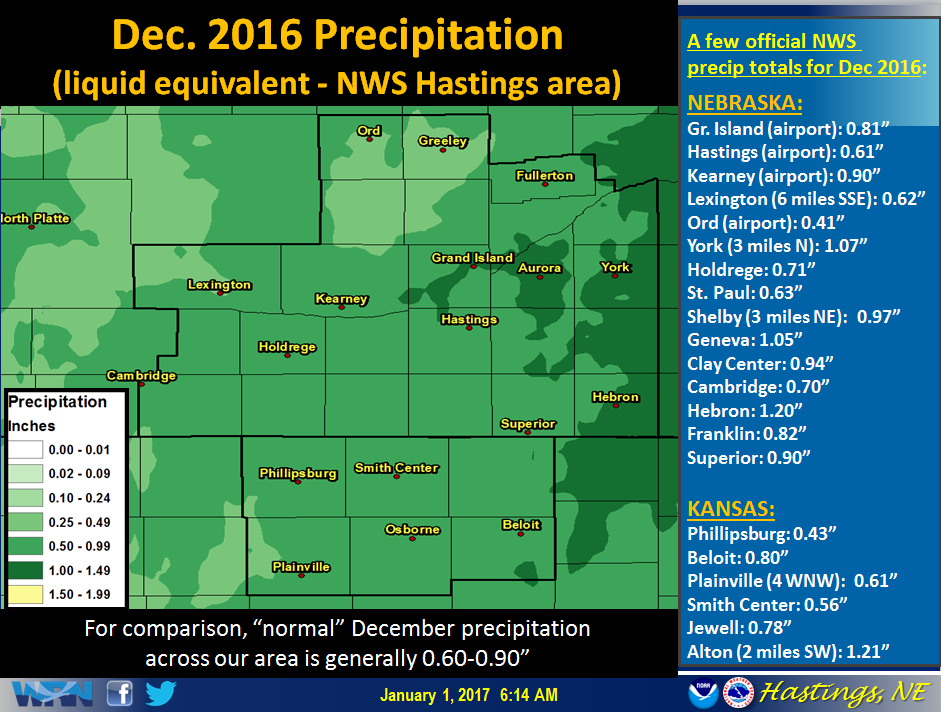 This graphic features a precipitation map for Dec. 2016, along with a partial listing of totals from official NWS stations. Click image to enlarge. |
Grand Island & Hastings Details:
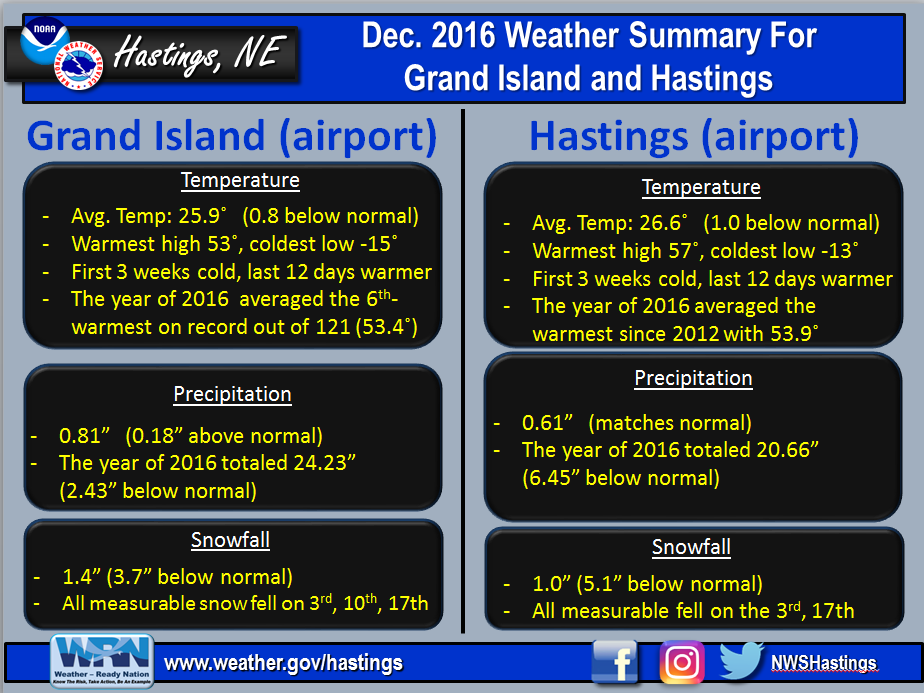 |
| Detailed info for Grand Island/Hastings. Click to enlarge. |
 |
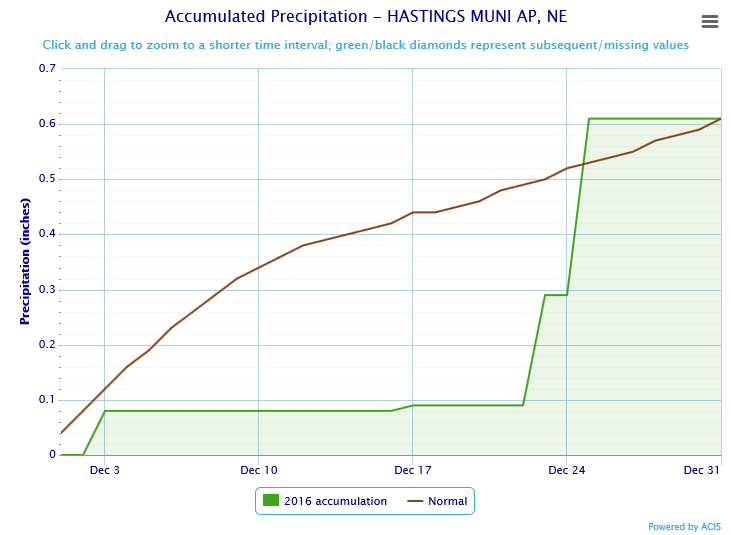 |
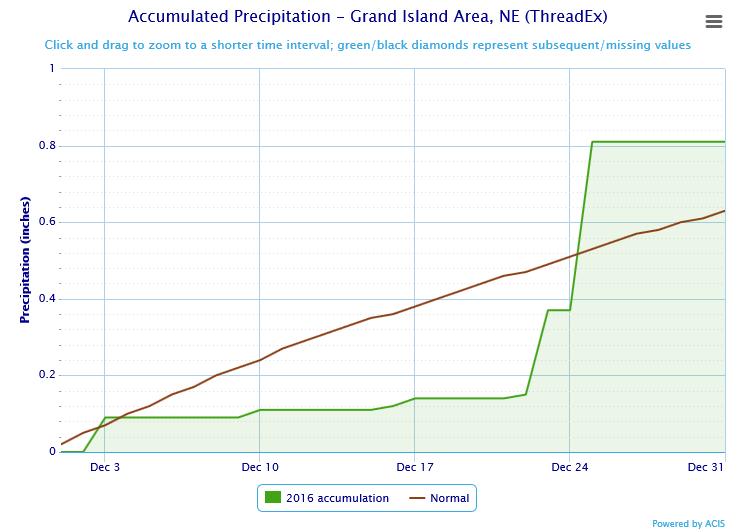
| Grand Island Precipitation Summary: The green line indicates cumulative observed precipitation for December 2016.The brown line indicates "normal" December precipitation based on 30-year data from 1981-2010. | Hastings Precipitation Summary: The green line indicates cumulative observed precipitation for December 2016. The brown line indicates "normal" December precipitation based on 30-year data from 1981-2010. |
| Grand Island (Regional Airport) - January 2016 - December 2016 | ||||||||||||
| Jan. | Feb. | Mar. | Apr. | May | June | July | Aug. | Sep. | Oct. | Nov. | Dec. | |
| Average High (F) | 35.8 | 45.0 | 59.6 | 64.4 | 71.9 | 89.6 | 87.0 | 84.4 | 78.8 | 70.7 | 57.3 | 37.3 |
| Average Low (F) | 18.3 | 25.0 | 32.0 | 40.4 | 48.5 | 63.2 | 65.1 | 62.7 | 55.0 | 42.6 | 32.7 | 14.5 |
| Average Temperature (F) | 27.0 | 35.3 | 45.8 | 52.4 | 60.2 | 76.4 | 76.0 | 73.5 | 66.9 | 56.7 | 45.0 | 25.9 |
| Departure From Normal | +1.9 | +6.2 | +6.4 | +1.8 | -1.0 | +5.1 | -0.2 | -0.5 | +1.8 | +4.5 | +6.9 | -0.8 |
| Precipitation (in) | 0.32 | 1.86 | 0.61 | 5.05 | 6.84 | 0.05 | 4.10 | 0.57 | 2.53 | 0.12 | 1.37 | 0.81 |
| Departure From Normal | -0.21 | +1.18 | -1.19 | +2.52 | +2.43 | -4.25 | +0.70 | -2.55 | +0.30 | -1.74 | +0.20 | +0.18 |
| Snowfall (in) | 4.6 | 18.6 | 2.6 | 0.0 | 0.0 | 0.0 | 0.0 | 0.0 | 0.0 | 0.0 | 0.4 | 1.4 |
| Departure From Normal | -1.9 | +12.3 | -2.8 | -1.5 | 0.0 | 0.0 | 0.0 | 0.0 | -0.1 | -1.0 | -2.7 | -3.7 |
| Hastings (Municipal Airport) - January 2016 - December 2016 | ||||||||||||
| Jan. | Feb. | Mar. | Apr. | May | June | July | Aug. | Sep. | Oct. | Nov. | Dec. | |
| Average High (F) | 36.6 | 45.4 | 60.0 | 64.6 | 71.0 | 89.1 | 87.7 | 84.9 | 78.6 | 71.3 | 57.4 | 37.7 |
| Average Low (F) | 19.2 | 24.9 | 32.7 | 41.0 | 48.9 | 64.0 | 66.0 | 63.4 | 56.1 | 44.0 | 34.2 | 15.6 |
| Average Temperature (F) | 27.9 | 35.2 | 46.3 | 52.8 | 59.9 | 76.5 | 76.9 | 74.1 | 67.3 | 57.6 | 45.8 | 26.6 |
| Departure From Normal (F) | +1.9 | +5.3 | +6.4 | +2.1 | -1.4 | +4.7 | -0.2 | -0.2 | +1.7 | +5.0 | +7.1 | -1.0 |
| Precipitation (in) | 0.35 | 1.57 | 0.54 | 5.69 | 3.68 | 0.75 | 2.22 | 1.77 | 1.80 | 0.22 | 1.46 | 0.61 |
| Departure From Normal (in) | -0.06 | +1.08 | -1.25 | +3.13 | -0.89 | -3.05 | -1.52 | -1.53 | -0.76 | -1.77 | +0.17 | 0.00 |
| Snowfall (in) | 5.5 | 16.0 | 2.1 | 0.0 | 0.0 | 0.0 | 0.0 | 0.0 | 0.0 | 0.0 | 0.1 | 1.0 |
| Departure From Normal (in) | -0.5 | +9.5 | -3.1 | -1.2 | 0.0 | 0.0 | 0.0 | 0.0 | -0.2 | -1.0 | -2.5 | -5.1 |
Kearney - 12 Month Climate Information:
All data is from the official NWS observer, with daily observations taken around 7 a.m. As a result, data may vary slightly from a true "Calendar Day" average.
| Kearney Airport (Coop Observer) - January 2016 - December 2016 | ||||||||||||
| Jan. | Feb. | Mar. | Apr. | May | June | July | Aug. | Sep. | Oct. | Nov. | Dec. | |
| Average High (F) | 37.2 | 45.7 | 59.5 | 63.2 | 69.5 | 87.4 | 86.4 | 84.3 | 79.3 | 70.8 | 58.6 | 37.8 |
| Average Low (F) | 17.8 | 24.1 | 27.4 | 39.5 | 46.6 | 61.7 | 63.4 | 61.8 | 53.0 | 40.8 | 33.4 | 14.8 |
| Average Temperature (F) | 27.5 | 34.9 | 43.5 | 51.4 | 58.1 | 74.6 | 74.9 | 73.1 | 66.2 | 55.8 | 46.0 | 26.3 |
| Departure From Normal (F) | +2.9 | +6.8 | +5.8 | +2.7 | +1.4 | +4.8 | +0.2 | +0.5 | +2.7 | +4.9 | +9.0 | +0.4 |
| Precipitation (in) | 0.40 | 0.98 | 0.56 | 8.39 | 2.30 | 0.61 | 3.38 | 1.47 | 1.20 | 0.12 | 1.56 | 0.90 |
| Departure From Normal (in) | -0.09 | +0.43 | -1.23 | +6.16 | -1.88 | -3.32 | +0.10 | -1.61 | -0.87 | -1.92 | +0.54 | +0.33 |
| Snowfall (in) | 4.0 | 11.0 | 3.0 | 0.0 | 0.0 | 0.0 | 0.0 | 0.0 | 0.0 | 0.0 | 0.2 | 1.0 |
| Departure From Normal (in) | -0.4 | +5.9 | -1.6 | -1.8 | 0.0 | 0.0 | 0.0 | 0.0 | -0.2 | -0.7 | -2.9 | -2.5 |
Ord - 12 Month Climate Information:
Winter precipitation data may include Cooperative Observer reports due to automated airport equipment under-measuring snowfall liquid equivalent.
| Ord (Evelyn Sharp Field Airport) - January 2016 - December 2016 | ||||||||||||
| Jan. | Feb. | Mar. | Apr. | May | June | July | Aug. | Sep. | Oct. | Nov. | Dec. | |
| Average High (F) | 36.0 | 45.9 | 58.5 | 61.7 | 71.1 | 86.8 | 85.2 | 83.6 | 77.2 | 70.3 | 56.7 | 37.6 |
| Average Low (F) | 16.1 | 21.8 | 27.0 | 38.7 | 45.7 | MSG | 62.3 | 60.4 | MSG | 37.4 | 28.1 | 9.3 |
| Average Temperature (F) | 26.0 | 33.9 | 42.7 | 50.2 | 58.4 | MSG | 73.8 | 72.0 | MSG | 53.8 | 42.4 | 23.5 |
| Departure From Normal (F) | +1.4 | +6.1 | +5.0 | +1.4 | -0.9 | MSG | -0.6 | -1.0 | MSG | +4.2 | +6.1 | -1.4 |
| Precipitation (in) | 0.30 | 0.85 | 1.35 | 8.99 | 5.05 | 3.52 | 6.66 | 0.44 | 1.70 | 0.09 | 1.26 | 0.41 |
| Departure From Normal (in) | -0.07 | +0.41 | -0.10 | +6.40 | +1.24 | -0.60 | +3.69 | -2.72 | -0.74 | -1.84 | +0.19 | -0.18 |
| Snowfall (in) | 5.3 | 12.0 | 8.0 | Trace | 0.0 | 0.0 | 0.0 | 0.0 | 0.0 | 0.0 | 3.0 | 2.7 |
| Departure From Normal (in) | -1.5 | +6.0 | +2.1 | -2.5 | 0.0 | 0.0 | 0.0 | 0.0 | 0.0 | -1.1 | -2.3 | -4.7 |
Smith Center, KS - 12 Month Climate Information:
All data is from the official NWS observer, with daily observations taken around 7 a.m. As a result, data may vary slightly from a true "Calendar Day" average.
| Smith Center, KS (Coop Observer) - January 2016 - December 2016 | ||||||||||||
| Jan. | Feb. | Mar. | Apr. | May | June | July | Aug. | Sep. | Oct. | Nov. | Dec. | |
| Average High (F) | 39.3 | 49.8 | 63.1 | 67.3 | 72.7 | 91.7 | 90.5 | 86.5 | 81.3 | 73.9 | 61.0 | 38.7 |
| Average Low (F) | 18.6 | 24.0 | 30.1 | 39.3 | 48.6 | 63.0 | 66.1 | 62.8 | 55.6 | 43.5 | 32.9 | 14.2 |
| Average Temperature (F) | 27.5 | 36.9 | 46.6 | 53.3 | 60.7 | 77.4 | 78.3 | 74.7 | 68.5 | 58.7 | 47.0 | 26.5 |
| Departure From Normal (F) | +0.2 | +4.9 | +5.0 | +0.8 | -3.7 | +3.4 | -1.4 | -2.5 | +0.3 | +3.9 | +6.6 | -2.3 |
| Precipitation (in) | 0.61 | 0.98 | 0.22 | 5.40 | 4.38 | 3.11 | 6.07 | 5.13 | 5.07 | 0.09 | 0.99 | 0.56 |
| Departure From Normal (in) | +0.12 | +0.40 | -1.65 | +3.13 | +0.46 | -0.50 | +2.20 | +1.83 | +3.03 | -1.79 | -0.23 | -0.10 |
| Snowfall (in) | 5.5 | 8.6 | 0.5 | 0.0 | 0.0 | 0.0 | 0.0 | 0.0 | 0.0 | 0.0 | 0.0 | 3.1 |
| Departure From Normal (in) | +1.8 | +4.5 | -1.9 | -0.6 | 0.0 | 0.0 | 0.0 | 0.0 | -0.2 | -0.4 | -1.8 | -0.1 |
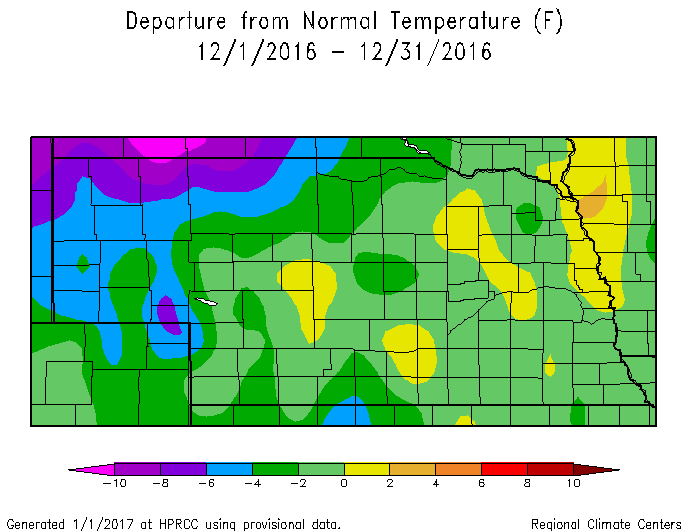
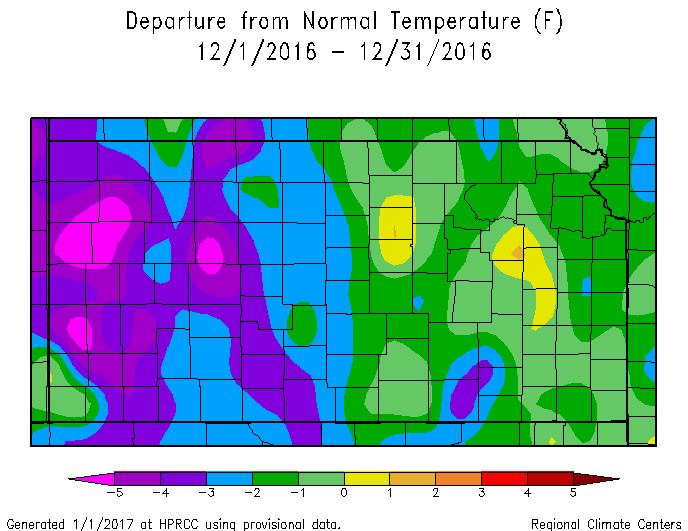
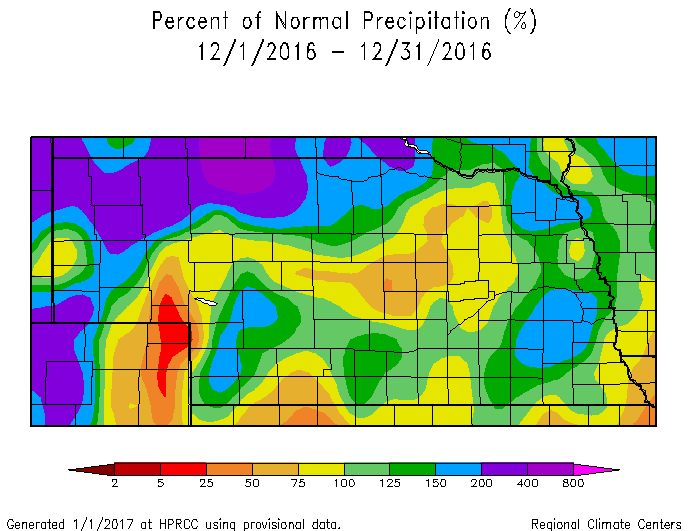
Area Temperature & Precipitation Departure From Normal:
These images depict Dec. 2016 monthly temperature & precipitation departure from normal for both Nebraska & Kansas. Images are courtesy of the High Plains Regional Climate Center (HPRCC). Click images to enlarge.
 |
 |
 |
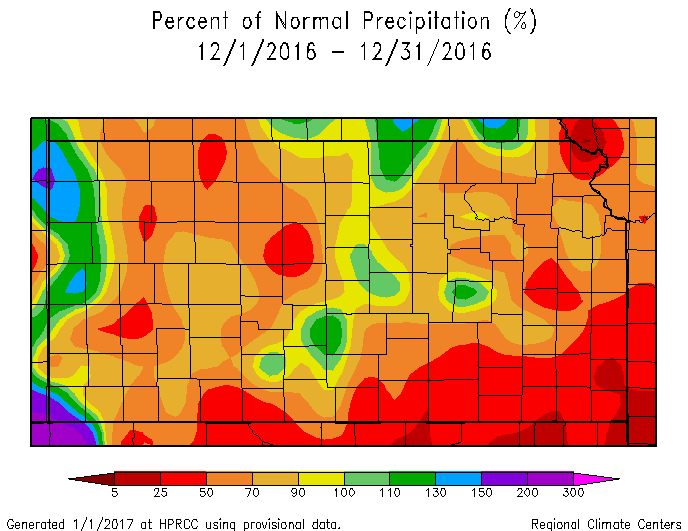 |
| Departure from Normal Temperature - NE (left) & KS (right) | Departure from Normal Precipitation - NE (left) & KS (right) | ||
 |
Media use of NWS Web News Stories is encouraged! Please acknowledge the NWS as the source of any news information accessed from this site. |
|

