Overview/Narrative:
(BE SURE TO CLICK THE VARIOUS TABS BELOW FOR A VARIETY OF AUGUST 2017 CLIMATE INFORMATION!)
|
Recap of August 2017 Weather for the 30-county NWS Hastings Coverage Area:
|
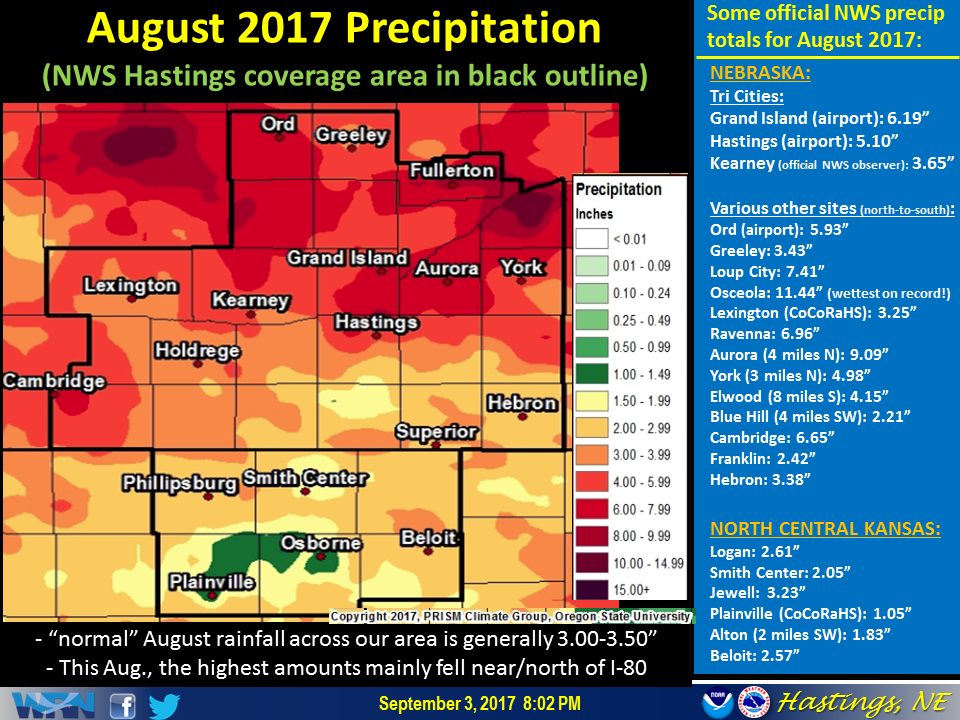 This graphic features a precipitation map for August 2017, along with a partial listing of totals from official NWS stations. (Click image to enlarge) |
Grand Island & Hastings Details (Including 12-Month History):
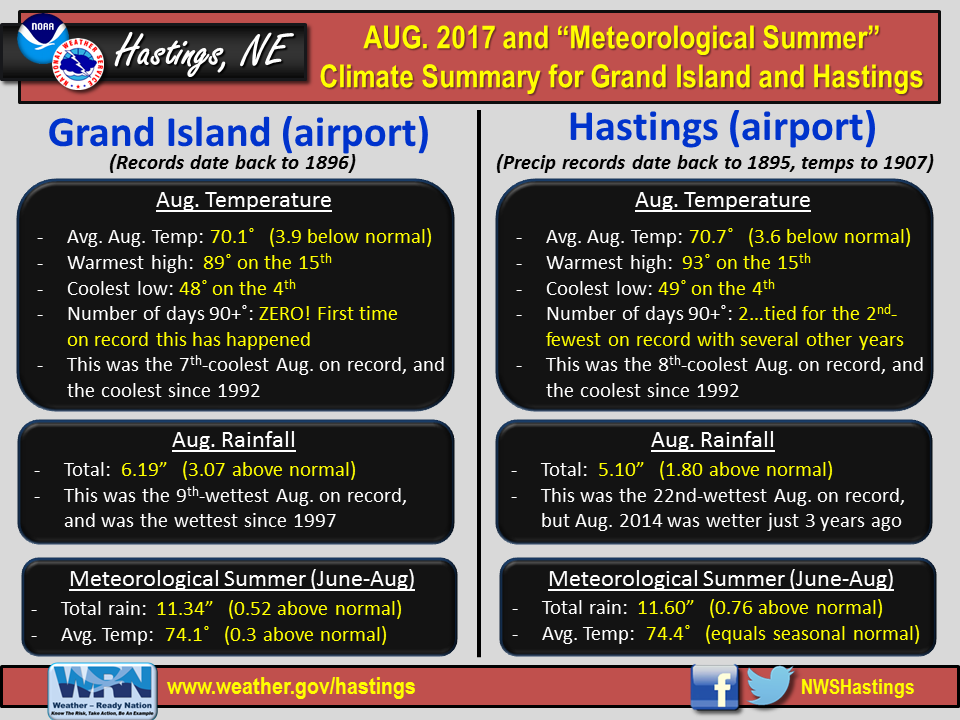 |
| Detailed August 2017 info for Grand Island/Hastings (Click to enlarge) |
 |
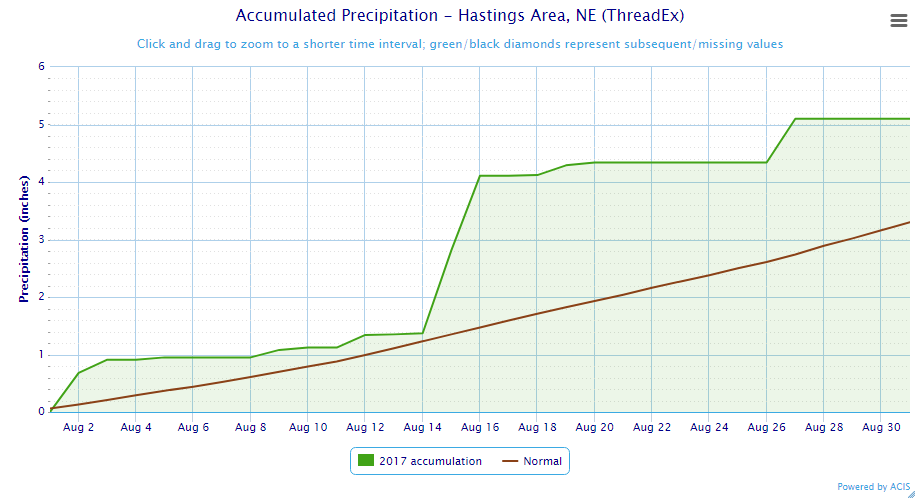 |
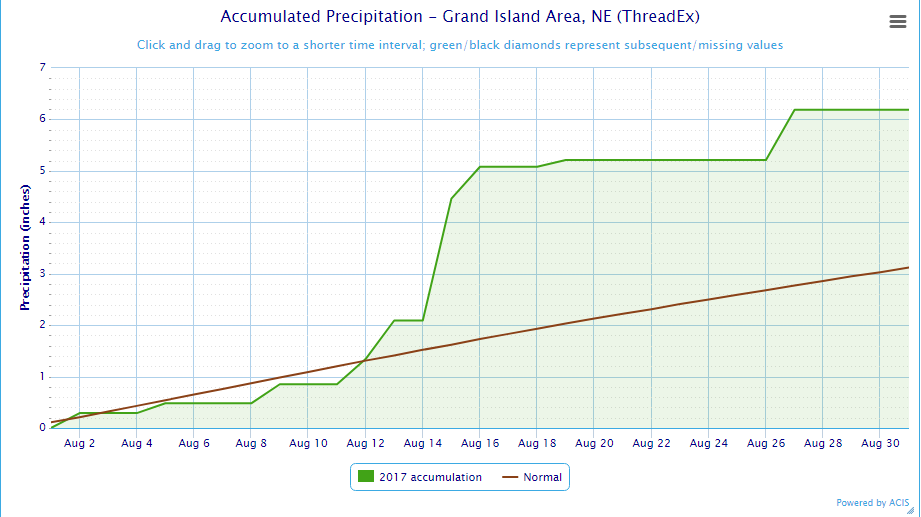
| Grand Island Precipitation Summary: The green line indicates cumulative observed precipitation for August 2017.The brown line indicates "normal" August precipitation based on 30-year data from 1981-2010. (click to enlarge) | Hastings Precipitation Summary: The green line indicates cumulative observed precipitation for August 2017. The brown line indicates "normal" August precipitation based on 30-year data from 1981-2010. (click to enlarge) |
| Grand Island (Regional Airport ASOS) - Sep. 2016 - August 2017 | ||||||||||||
| Sep. | Oct. | Nov. | Dec. | Jan. | Feb. | Mar. | Apr. | May | June | July | Aug. | |
| Average High (F) | 78.8 | 70.7 | 57.3 | 37.3 | 34.6 | 50.8 | 54.4 | 63.1 | 72.7 | 87.5 | 88.9 | 81.3 |
| Average Low (F) | 55.0 | 42.6 | 32.7 | 14.5 | 17.9 | 24.8 | 30.0 | 39.2 | 49.6 | 61.2 | 66.6 | 58.9 |
| Average Temperature (F) | 66.9 | 56.7 | 45.0 | 25.9 | 26.3 | 37.8 | 42.2 | 51.1 | 60.3 | 74.4 | 77.8 | 70.1 |
| Departure From Normal | +1.8 | +4.5 | +6.9 | -0.8 | +1.2 | +8.7 | +2.8 | +0.5 | -0.9 | +3.1 | +1.6 | -3.9 |
| Precipitation (in) | 2.53 | 0.12 | 1.37 | 0.81 | 1.07 | 0.25 | 0.81 | 2.64 | 5.28 | 2.10 | 3.05 | 6.19 |
| Departure From Normal | +0.30 | -1.74 | +0.20 | +0.18 | +0.54 | -0.43 | -0.99 | +0.11 | +0.87 | -2.20 | -0.35 | +3.07 |
| Snowfall (in) | 0.0 | 0.0 | 0.4 | 1.4 | 2.4 | 3.5 | 1.2 | T | 0.3 | 0.0 | 0.0 | 0.0 |
| Departure From Normal | -0.1 | -1.0 | -2.7 | -3.7 | -4.1 | -2.8 | -4.2 | -1.5 | +0.3 | 0.0 | 0.0 | 0.0 |
| Hastings (Municipal Airport ASOS) - Sep. 2016 - August 2017 | ||||||||||||
| Sep. | Oct. | Nov. | Dec. | Jan. | Feb. | Mar. | Apr. | May | June | July | Aug. | |
| Average High (F) | 78.6 | 71.3 | 57.4 | 37.7 | 35.7 | 51.4 | 55.4 | 63.4 | 72.8 | 86.3 | 88.9 | 81.7 |
| Average Low (F) | 56.1 | 44.0 | 34.2 | 15.6 | 19.4 | 25.8 | 31.3 | 40.7 | 49.5 | 62.1 | 67.6 | 59.8 |
| Average Temperature (F) | 67.3 | 57.6 | 45.8 | 26.6 | 27.6 | 38.6 | 43.4 | 52.1 | 61.1 | 74.2 | 78.2 | 70.7 |
| Departure From Normal (F) | +1.7 | +5.0 | +7.1 | -1.0 | +1.6 | +8.7 | +3.5 | +1.4 | -0.2 | +2.4 | +1.1 | -3.6 |
| Precipitation (in) | 1.80 | 0.22 | 1.46 | 0.61 | 0.83 | 0.27 | 1.08 | 3.24 | 6.42 | 1.79 | 4.71 | 5.10 |
| Departure From Normal (in) | -0.76 | -1.77 | +0.17 | 0.00 | +0.42 | -0.22 | -0.71 | +0.68 | +1.85 | -2.01 | +0.97 | +1.80 |
| Snowfall (in) | 0.0 | 0.0 | 0.1 | 1.0 | 3.7 | 4.3 | 1.2 | 0.2 | 0.6 | 0.0 | 0.0 | 0.0 |
| Departure From Normal (in) | -0.2 | -1.0 | -2.5 | -5.1 | -2.3 | -2.2 | -4.0 | -1.0 | +0.6 | 0.0 | 0.0 | 0.0 |
Kearney - 12 Month Climate History:
All data here is from the official NWS observer at Kearney airport, with 24-hour observations taken around 7 a.m. ** PLEASE NOTE: This official Kearney data often differs at least slightly from the unofficial data recorded by the automated airport system (KEAR) **
| Kearney Airport (Coop Observer) - Sep. 2016 - August 2017 | ||||||||||||
| Sep. | Oct. | Nov. | Dec. | Jan. | Feb. | Mar. | Apr. | May | June | July | Aug. | |
| Average High (F) | 79.3 | 70.8 | 58.6 | 37.8 | 36.9 | 50.0 | 54.6 | 62.5 | 70.2 | 86.6 | 88.1 | 81.2 |
| Average Low (F) | 53.0 | 40.8 | 33.4 | 14.8 | 19.5 | 24.1 | 28.6 | 38.8 | 45.9 | 59.7 | 64.8 | 56.9 |
| Average Temperature (F) | 66.2 | 55.8 | 46.0 | 26.3 | 28.2 | 37.1 | 41.6 | 50.7 | 58.1 | 73.2 | 76.5 | 69.1 |
| Departure From Normal (F) | +2.7 | +4.9 | +9.0 | +0.4 | +3.6 | +9.0 | +3.9 | +2.0 | -1.4 | +3.4 | +1.8 | -3.5 |
| Precipitation (in) | 1.20 | 0.12 | 1.56 | 0.90 | 0.90 | 0.30 | 1.63 | 1.87 | 6.03 | 1.93 | 3.66 | 3.65 |
| Departure From Normal (in) | -0.87 | -1.92 | +0.54 | +0.33 | +0.41 | -0.25 | -0.16 | -0.36 | +1.85 | -2.00 | +0.38 | +0.57 |
| Snowfall (in) | 0.0 | 0.0 | 0.2 | 1.0 | 4.5 | 5.2 | 0.7 | T | 1.6 | 0.0 | 0.0 | 0.0 |
| Departure From Normal (in) | -0.2 | -0.7 | -2.9 | -2.5 | +0.1 | +0.1 | -3.9 | -1.8 | +1.6 | 0.0 | 0.0 | 0.0 |
Ord - 12 Month Climate History:
Winter precipitation totals often include NWS Cooperative Observer data due to the automated airport equipment under-measuring snowfall liquid equivalent.
| Ord (Evelyn Sharp Field Airport ASOS) - Sep. 2016 - August 2017 | ||||||||||||
| Sep. | Oct. | Nov. | Dec. | Jan. | Feb. | Mar. | Apr. | May | June | July | Aug. | |
| Average High (F) | 77.2 | 70.3 | 56.7 | 37.6 | 34.1 | 48.4 | 53.7 | 61.7 | 69.7 | 86.3 | 90.3 | 81.4 |
| Average Low (F) | MSG | 37.4 | 28.1 | 9.3 | 14.2 | 19.8 | 28.7 | 37.9 | 44.1 | 56.9 | 64.1 | 56.3 |
| Average Temperature (F) | MSG | 53.8 | 42.4 | 23.5 | 24.1 | 34.1 | 41.2 | 49.8 | 56.9 | 71.6 | 77.2 | 68.8 |
| Departure From Normal (F) | MSG | +4.2 | +6.1 | -1.4 | -0.5 | +6.3 | +3.5 | +1.0 | -2.4 | +2.4 | +2.8 | -4.2 |
| Precipitation (in) | 1.70 | 0.09 | 1.26 | 0.41 | 1.15 | 0.79 | 1.83 | 4.25 | 3.10 | 0.59 | 2.53 | 5.93 |
| Departure From Normal (in) | -0.74 | -1.84 | +0.19 | -0.18 | +0.78 | +0.35 | +0.38 | +1.66 | -0.71 | -3.53 | -0.44 | +2.77 |
| Snowfall (in) | 0.0 | 0.0 | 3.0 | 2.7 | 11.9 | 10.4 | 1.9 | 1.0 | 6.0 | 0.0 | 0.0 | 0.0 |
| Departure From Normal (in) | 0.0 | -1.1 | -2.3 | -4.7 | +5.1 | +4.4 | -4.0 | -1.5 | +6.0 | 0.0 | 0.0 | 0.0 |
Smith Center, KS - 12 Month Climate History:
All data is from the official NWS observer, with 24-hour observations taken around 7 a.m. As a result, data may vary slightly from true "Calendar Day" totals.
| Smith Center KS (NWS Coop Observer) - Sep. 2016 - August 2017 | ||||||||||||
| Sep. | Oct. | Nov. | Dec. | Jan. | Feb. | Mar. | Apr. | May | June | July | Aug. | |
| Average High (F) | 81.3 | 73.9 | 61.0 | 38.7 | 39.0 | 53.4 | 58.5 | 65.4 | 73.9 | 89.8 | 95.2 | 86.4 |
| Average Low (F) | 55.6 | 43.5 | 32.9 | 14.2 | 18.5 | 24.2 | 30.2 | 40.0 | 46.8 | 60.9 | 66.7 | 59.9 |
| Average Temperature (F) | 68.5 | 58.7 | 47.0 | 26.5 | 28.7 | 38.8 | 44.4 | 52.7 | 60.4 | 75.4 | 80.9 | 73.1 |
| Departure From Normal (F) | +0.3 | +3.9 | +6.6 | -2.3 | +1.0 | +6.8 | +2.8 | +0.2 | -3.3 | +1.4 | +1.2 | -4.1 |
| Precipitation (in) | 5.07 | 0.09 | 0.99 | 0.56 | 1.46 | 0.27 | 1.26 | 3.32 | 7.03 | 1.31 | 3.26 | 2.05 |
| Departure From Normal (in) | +3.03 | -1.79 | -0.23 | -0.10 | +0.97 | -0.31 | -0.61 | +1.05 | +3.11 | -2.30 | -0.61 | -1.25 |
| Snowfall (in) | 0.0 | 0.0 | 0.0 | 3.1 | 1.1 | 1.8 | 0.2 | 0.0 | 0.0 | 0.0 | 0.0 | 0.0 |
| Departure From Normal (in) | -0.2 | -0.4 | -1.8 | -0.1 | -2.6 | -2.3 | -2.4 | -0.6 | 0.0 | 0.0 | 0.0 | 0.0 |
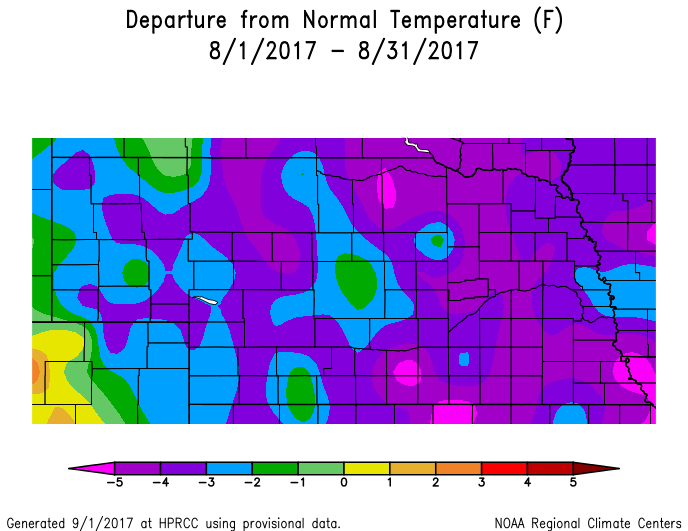
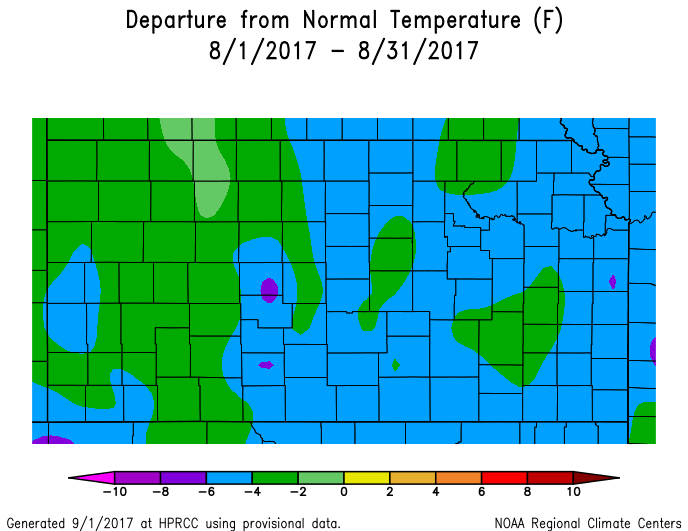
Temperature & Precipitation Departure From Normal Maps:
These images depict August 2017 monthly temperature departure from normal & precipitation percent-of-normal for both Nebraska & Kansas. Images are courtesy of the High Plains Regional Climate Center (HPRCC). Please note: These maps occasionally contain "bullseyes" of errant data. For precipitation, you can also generate departure from normal/percent-of-normal maps using the NWS AHPS page
 |
 |
 |
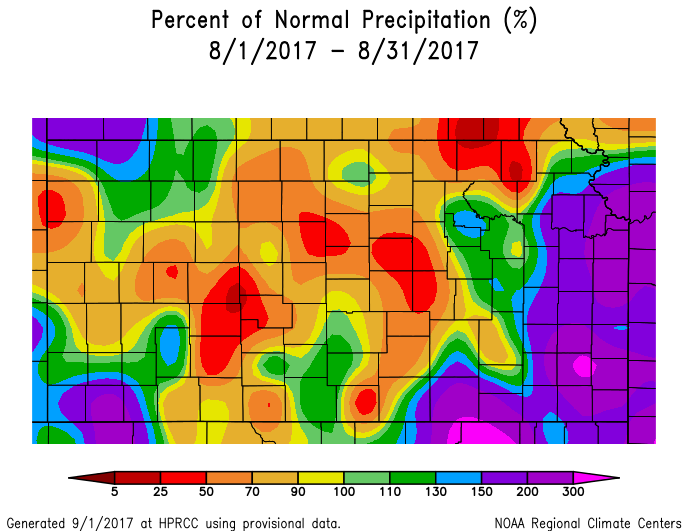 |
| Departure from Normal Temperature - NE (left) & KS (right) | Percent of Normal Precipitation - NE (left) & KS (right) | ||
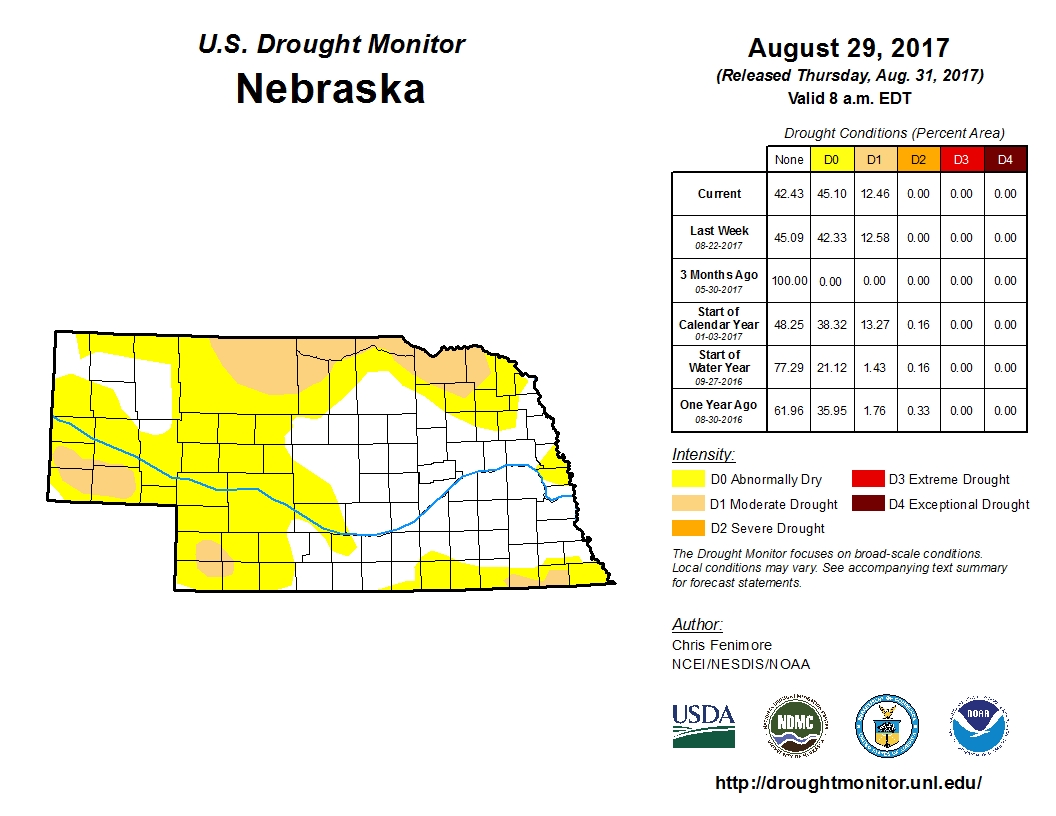
Drought:
The following drought images, current as of August 29, 2017, are courtesy of the U.S. Drought Monitor
Brief summary of changes during August for the NWS Hastings coverage area:
Given that August rainfall generally followed a wetter-in-the-north, drier-in-the-south regime across the NWS Hastings coverage area, it should come as little surprise that trends in the weekly Drought Monitor followed suit.
More specifically, within the local Nebraska coverage area, roughly 85% of the area was void of all drought categories whatsoever at month's end, with only limited coverage of Abnormally Dry (D0) lingering within portions of mainly Thayer, Nuckolls, Dawson and Phelps counties. Needless to say, the above-normal rain in the north eradicated the area of Moderate Drought (D1) that existed in parts of mainly Greeley and Nance counties when August began. Farther south in the local north central Kansas area, the news was not as positive, as the coverage of Moderate Drought (D1) expanded somewhat to now include all-or-most of Mitchell, Jewell, Smith and Osborne counties, and nearly half of Rooks County.
 |
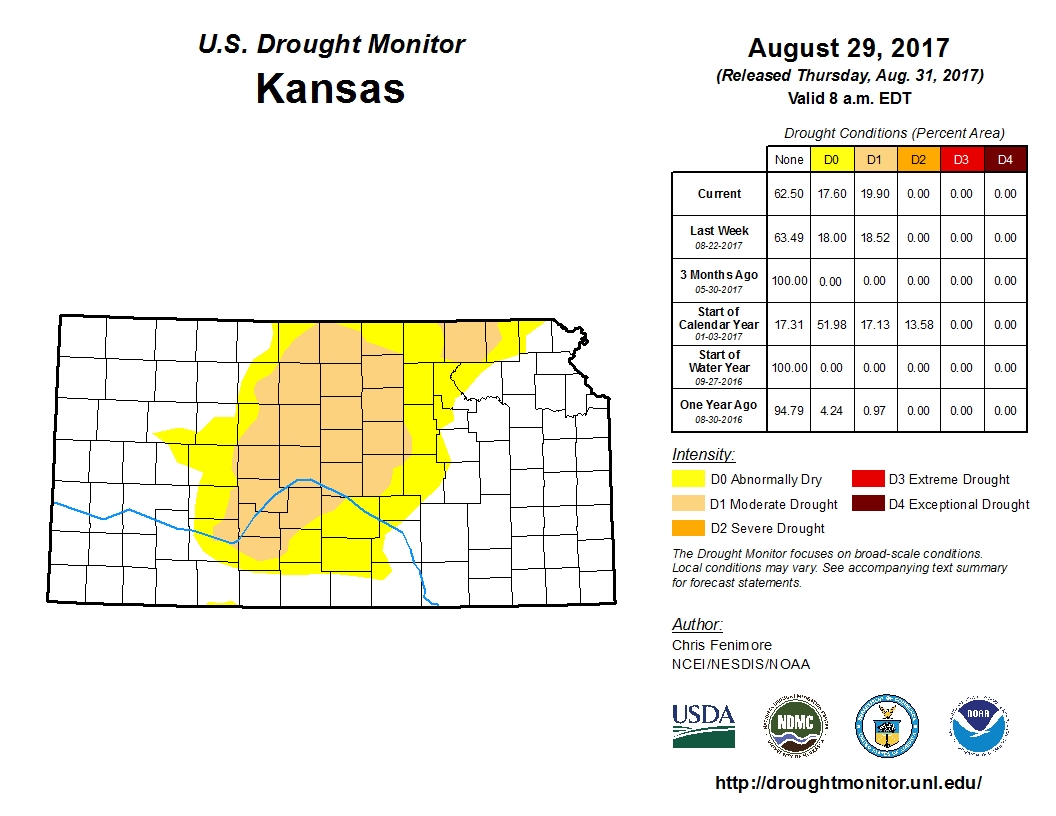 |
| Drought Monitor for Nebraska (left) & Kansas (right). Valid as of August 29, 2017 (click to enlarge) | |
Monthly Extremes for the NWS Hastings Coverage Area:
...A FEW OF THE HOTTEST HIGH TEMPERATURES DURING AUGUST 2017...
(all data from NWS cooperative observers and occurred on the 20th unless noted)
103 degrees...Webster Dam KS
102 degrees...2SW Alton KS
100 degrees...Smith Center KS - Kirwin Dam KS
99 degrees...Beloit KS - Glen Elder Lake KS
98 degrees...Red Cloud - Beaver City (20th)
...A FEW OF THE COOLEST LOW TEMPERATURES DURING AUGUST 2017...
(all data from NWS cooperative observers or automated airport sites and occurred on the 4th)
42 degrees...Greeley
43 degrees...Beaver City
44 degrees...Ravenna
45 degrees...Ord airport - Edison
...A FEW OF THE HIGHEST MONTHLY RAINFALL TOTALS DURING AUGUST 2017...
(all data from NWS cooperative observers or CoCoRaHS/NeRAIN observers unless indicated)
12.21"...5NE Osceola
11.44...Osceola
9.34"...3WSW Genoa
9.09"...4N Aurora
8.40"...2W Loup City
...A FEW OF THE LOWEST MONTHLY RAINFALL TOTALS DURING AUGUST 2017...
(all data from NWS cooperative observers or automated airport sites unless specified)
1.05"...Plainville KS
1.17"...Osborne KS
1.50"...Webster Dam KS
1.69"...2NNW Hunter KS
1.80"...Covert KS
 |
Media use of NWS Web News Stories is encouraged! Please acknowledge the NWS as the source of any news information accessed from this site. |
|

