(Click on the links in gray boxes below to quickly jump to information located farther down the page)
| Tri-Cities & Ord Details & Monthly Extremes |
Graphs, Tables, Maps | Drought Monitor Graphics |
Monthly Precipitation & Snowfall Tables & Archive of These Monthly Reviews |
* Please Note: All climate data presented here are preliminary and have not undergone final quality control by the National Climatic Data Center (NCDC). Therefore, these data are subject to revision. Final and certified climate data can be accessed at: WWW.NCDC.NOAA.GOV.
September 2014 Climate And Weather Review For South Central Nebraska
And Portions Of North Central Kansas
...Variable Rainfall...And a Rather Unique Temperature Month With a Notably Cool 1st Half Followed By a Much Warmer 2nd Half...
The following narrative focuses on climate and weather highlights for the month of September 2014 across the NWS Hastings coverage area, encompassing 24 counties in south central and central Nebraska, and 6 counties in north central Kansas. Click here for a map of this coverage area. The temperature and precipitation data presented here are largely based on the NWS Cooperative Observer network, along with data from a handful of automated airport sites. All climate averages and "normals" presented here are based on the official NCDC 1981-2010 normals.
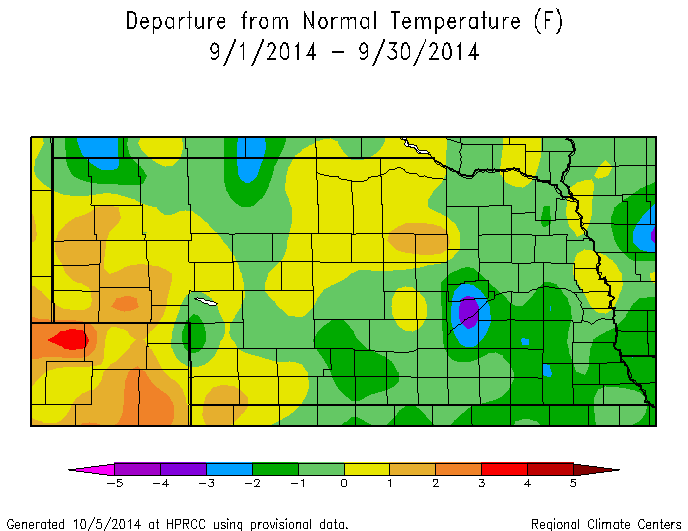
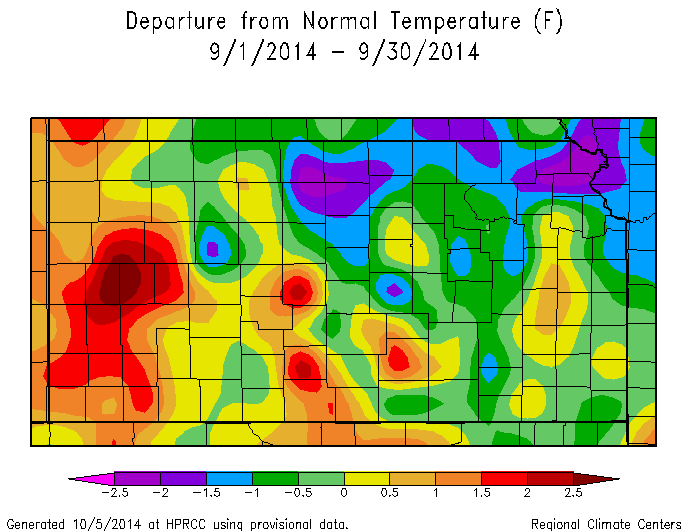
- TEMPERATURES...(According to 30-year averages, "normal" September high temperatures in South Central Nebraska gradually decrease from the low-mid 80s early in the month to the low-mid 70s by the end of the month, while highs in North Central Kansas gradually decrease from the upper-80s to the mid-70s. "Normal" September low temperatures across most of the 30-county area gradually decrease from the upper-50s or low-60s early in the month to the mid-upper 40s by month's end, except for low-40s north of Highway 92 in Nebraska...)
Based on the monthly average temperature (resulting from averaging together the daily highs and lows), temperatures for the month of September 2014 as a whole generally finished somewhere between 0.5° and 2° cooler than the 30-year normal. HOWEVER, this overall-slightly below normal average does not paint the true picture of a rather unique month that featured a well-below normal first half and a well-above normal second half (opposite of what "typically" might be expected during the transition from summer to fall). During the cool first half of the month, much of the area experienced an unusually early (at-least limited, patchy) frost on the morning of the 13th, and a few places even recorded one of their earliest freezes on record. Following below are several temperature highlights/details for the month of September 2014:
Although there were a few short-term exceptions to the rule, September truly was a tale of a notably cool first half and a considerably warmer second half. In fact, through the first 16 days of the month, many places notched one of their Top-5 coolest starts to September on record. This included the Nebraska Tri-Cities, where Hastings airport tied for its outright-coolest Sep. 1-16 on record out of 108 years, Grand Island airport tied for its 2nd-coolest Sep. 1-16 period out of 119 years and Kearney airport had its 4th-coolest Sep. 1-16 out of 114 years. For most of the area, the overall-coolest week was centered from the 10th-16th. Then, from the 17th onward through the final 14 days of the month, the trend reversed in a notable way as warmer air moved in and provided much of the area with one of its Top-15 warmest Sep. 17-30 stretches on record. Specifically for the Nebraska Tri-Cities, these final 14 days of the month were the 6th-warmest on record at Grand Island, 12th-warmest at Hastings and 16th-warmest at Kearney. At Hastings airport, where temperature trends were generally representative of much of the 30-county area as a whole, 15 of 30 September days featured a below normal average temperature, 14 were above normal and 1 day matched its daily normal.
During the overall-coolest week centered from the 10th-16th, places such as Hastings never exceeded 70°, and lows each night dropped into the 30s or 40s. By far the chilliest two days of the month across the 30-county area were the 11th-12th, as most places only topped out in the low-mid 50s and even a few upper-40s, including 49° at both Ravenna and Greeley on the 11th. Hastings airport set new record cold high temperatures on both days with highs of only 50° and 53°, respectively. Just before this seasonably chilly air departed the area, it set the stage for a particularly cold morning on the 13th as the majority of South Central Nebraska and North Central Kansas bottomed out between 33-36°, resulting in the first "frost event" of the fall in some places. Depending on which portion of the local area one was in, this first fall frost of 2014 arrived anywhere from 10 to 25 days earlier than average! Although limited in nature, at least small portions of the local area even recorded their first freeze of the season on the 13th, generally dropping to between 29-32°, including NWS cooperative observers in/near Cambridge NE, Alton KS and Beloit KS. At the station 2SW Alton KS, the low of 29° tied with 9-13-1974 for the earliest fall freeze on record, and at Cambridge and Beloit it was the 2nd-earliest freeze on record.
For most of the 30-county area, the overall-warmest week of the month consisted of the last 7 days from the 24th-30th, during which Hastings airport reached at least 80° on six of the seven days and lows never dropped below 54°. At the cooperative observer station 4WNW Plainville KS, highs ranged from 83-87° on each day between the 23rd-29th.
Per dozens of NWS cooperative observers and a few automated airport sites, the majority of the area observed its hottest day of the month on the 3rd, although some places notched their hottest readings on the 4th or 19th. A few of the hottest highs of the month (all of which occurred on the 3rd) featured 101° at 4WNW Plainville KS, 98° at Kirwin Dam KS and Beaver City, and 97° at Beloit KS, Smith Center KS and 2SW Alton KS. On the Nebraska side of the border, a few of the other hottest readings of the month included 96° at Edison and Franklin (on the 3rd) and 95° at Red Cloud (3rd) and Hebron (on the 4th).
Per dozens of NWS cooperative observers and a few automated airport sites, the coldest low temperatures of the month across the entire 30-county area occurred on the morning of the 13th, highlighted by readings of 29° at Red Cloud and 2SW Alton KS, 30° at Beaver City and 6SSE Lexington (Canaday Steam Plant), and 31° at Franklin and Burr Oak KS.
Among the official Nebraska Tri-Cities airport temperature stations, the hottest September high temperature at each site was 90°, which occurred on the 3rd at Hastings and Kearney, and on the 19th at Grand Island. The coldest Tri-Cities low temperatures all occurred on the 13th, consisting of 35° at both Hastings and Kearney, and 36° at Grand Island. At Hastings, this tied with the same date in 1949 for the earliest 36°-or-colder (frost-supportive) fall temperature on record.
The most extreme day-to-day change in September high temperatures at Grand Island airport was 17°, consisting of a decent cool-down from 83° to 66° from the 4th-5th.
(Please look farther down the page for more information on September 2014 temperatures and extremes, including detailed breakdowns for Grand Island, Hastings, Kearney and Ord.)
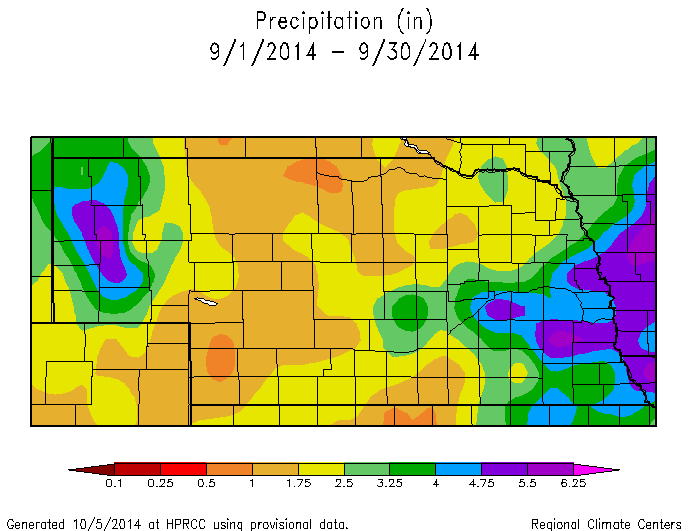
- PRECIPITATION/FLOODING...(According to 30-year averages, "normal" September rainfall across the NWS Hastings coverage area varies a bit from west to east, with most locations west of the Highway 281 corridor generally expected to receive between 1.60 - 2.25 inches, while locations generally east of Highway 281 average a bit higher between 2.25 - 2.70 inches...)
In contrast to the widespread above normal August rainfall that drenched the vast majority of the 30-county local area, September was one of those months that featured a rather variable coverage of precipitation. Overall though, the majority of the area (roughly three-fourths of it) ended up within 1" or so of the 30-year normal (meaning monthly totals somewhere in the 1.30"-3.30" range). Although a few places still received a bit too much rain and resultant short-term flooding, the area as a whole had a chance to dry out a bit compared to August.
Based on reports from around 65 NWS Cooperative Observers and a few automated airport gauges, and also incorporating radar-derived estimation, it was a fairly-even split between above and below normal September precipitation across the 30-county area, with maybe a slight nod toward the below normal side of things. Although most of the area (roughly 75% of it) tallied monthly totals within 1" or so of normal, roughly 15% of the area actually measured LESS THAN HALF normal September rainfall (meaning generally less than 1.20") and somewhere between 5-10% of the area measured at least TWICE NORMAL September rainfall (meaning generally more than 4.65").
Although several pockets/corridors of above and below normal rainfall were scattered throughout the 30-county area, the most widespread corridor of below normal precipitation extended along a northeast-to-southwest axis running roughly 15-20 miles either side of a line from near Lawrence-Red Cloud-Phillipsburg KS. In contrast, the most notable, narrow corridor of above normal monthly rainfall extending along an axis from northern Buffalo County in the west, then eastward through the Grand Island, Central City and especially Osceola areas. Well to the south in Kansas, another fairly concentrated zone of above normal precipitation was noted over most of Mitchell and southern Osborne counties.
Among the official Nebraska Tri-Cities airport precipitation sites, Grand Island led the way with 3.03”, followed by Kearney (2.40”) and Hastings (1.78”). Please refer to the web story linked at the top of this page for more specific Tri-Cities details.
As for monthly precipitation extremes within the 30-county area, a few of the highest-known September totals per a combination of NWS cooperative observers and the NeRAIN network are as follows: 6.16" in Osceola (NWS), 5.44" one mile east of Stromsburg (NeRAIN), 5.43" in Beloit KS (NWS), 5.14" three miles southeast of Ravenna (NeRAIN) and 5.00" three miles west of Gresham (NWS). (please refer to the extremes section below for a longer list of highest/lowest rainfall amounts)
On the "drier" side of things during September, a few of the lowest monthly rainfall totals featured: 0.88" at Kirwin Dam KS (NWS), 0.97" at Franklin (NWS), 0.98" four miles southwest of Blue Hill (NWS), 1.01" at Harlan County Lake (NWS) and 1.04" at Lawrence (NeRAIN). (please refer to the extremes section below for a longer list of highest/lowest rainfall amounts)
Focusing on a few of the most impressive short-term (meaning 24-hour-or less) rainfall totals during the month, here are just a few of the top ones (along with the source): 3.87" in Osceola, most of which fell on the evening of the 9th (NWS observer), 3.57" three miles west of Gresham, most of which fell on the evening of the 9th (NWS), 3.39" one mile east of Stromsburg, most of which fell on the evening of the 9th (NeRAIN observer), 3.31" near Alexandria, most of which fell on the evening of the 30th (automated river gauge), 2.94" seven miles east-southeast of Ravenna, most of which fell on the evening of the 23rd (NeRAIN).
Flooding: Besides the typical, localized instances of minor, short-term flooding issues that accompanied thunderstorms during the month, likely the most noteworthy flood event of September began on the evening of the 9th and lasted well into the 10th as primarily the southern two-thirds of Polk County along with small portions of neighboring counties such as Merrick, Hamilton and York were drenched with generally 2-4" of rain, most of which fell in a fairly short time on the evening of the 9th. Much of this rain fell into the Big Blue River and Davis Creek basins. Given that soil was already still fairly saturated from abundant rainfall over the preceding several weeks, fairly significant flooding ensued, especially in and near the Osceola/Stromsburg areas. In Osceola itself, the NWS cooperative observer reported a 24-hour rainfall total of 3.87" and Davis Creek ran out of its banks in and near town. Highway 92 was closed for several hours just west of Osceola, along with a number of rural roadways in Polk County.
(Please look farther down the page for more information on September 2014 precipitation/snowfall and extremes, including rankings of wettest and driest locations, percent-of-normal plots, and a detailed breakdown for Grand Island, Hastings, Kearney and Ord. In addition, the link on the far upper right of this page contains an archive of monthly/annual precipitation and snowfall totals for around 70 locations.)
- DROUGHT STATUS (see images at bottom of page)...Although a decent chunk of the 30-county NWS Hastings coverage area observed at least slightly below normal September rainfall, the lingering positive effects of abundant summer precipitation (especially during June and August) kept drought concerns at a minimum across the local area, according to weekly issuances of the U.S. Drought Monitor. In fact, some further improvement even took place during September within North Central Kansas, as any lingering areas of category D1 Moderate Drought mainly south of the Highway 24 corridor improved to no-worse-than category D0 Abnormally Dry conditions (considered to be one category better than “true” drought). AS A RESULT, FOR THE FIRST TIME IN OVER 27 MONTHS, SINCE LATE-MAY 2012, THE ENTIRE 30-COUNTY NWS HASTINGS COVERAGE AREA IS NOW VOID OF ALL CATEGORY D1-OR-WORSE DROUGHT CLASSIFICATION!
At month's end, the U.S. Drought Monitor indicated that at least 90% of the coverage area was void of ALL drought categories (including D0). The only counties that still contained at-least-partial coverage of D0 Abnormally Dry classification included Webster, Adams, Nuckolls and Thayer in South Central Nebraska...and Jewell, Mitchell, Smith and Osborne in North Central Kansas. Of these aforementioned eight counties, only Jewell, Mitchell and Webster featured significant coverage of D0.
- SEVERE THUNDERSTORMS/HIGH WINDS (for all official/finalized storm reports please refer to NCDC Storm Data)...Compared to August, September was a fairly tranquil month in terms of severe thunderstorm wind gusts and/or large hail, as NWS Hastings issued only 14 Severe Thunderstorm Warnings. There were no tornadoes confirmed within the area during the month. The majority of Severe Thunderstorm Warnings were issued on the 3rd and 9th, although a few warnings were also issued on the 17th, 18th, 23rd and 30th. Here are a few of the most noteworthy September 2014 severe weather tidbits, in brief:
On the afternoon/evening of the 3rd, quarter size hail was reported near Loup City, Elba, Greeley and Spalding in NE and also near Stockton KS.
On the late afternoon/evening of the 9th, quarter size hail was reported near Chester, Hubbell, Benedict and Gresham NE, and wind gusts to around 65 MPH were reported near Lovewell State Park KS.
On the evening of the 17th, an isolated severe storm produced golf ball size hail near Alton KS.
Early in the evening on the 30th, quarter size hail and 60 MPH winds were reported in southeastern Mitchell County KS.
- Number of Severe Thunderstorm Warning polygons issued by NWS Hastings in September 2014: 14 (9 more than Sep. 2013)
- Number of Tornado Warning polygons issued by NWS Hastings in September 2014: 1 (1 more than Sep. 2013)
- Number of confirmed tornadoes within the NWS Hastings coverage area in September 2014: ZERO (same as Sep. 2013)
Click on the link below for September 2014 climate summaries specifically for Grand Island, Hastings, Kearney and Ord
Grand Island - Hastings - Kearney - Ord
|
...A FEW OF THE HOTTEST HIGH TEMPERATURES DURING SEPTEMBER 2014 |
Various graphs and tables depicting September 2014 climate data for
South Central Nebraska and North Central Kansas:
* Please Note: These data are preliminary and have not undergone final quality control by the National Climatic Data Center (NCDC). Therefore, these data are subject to revision. Final and certified climate data can be accessed at WWW.NCDC.NOAA.GOV
 |
 |
| Grand Island Temperature Summary: Observed daily maximum and minimum temperatures are connected by blue bars. Area between normal maximum and minimum temperatures is shaded green. Red bars connect record high temperatures. Blue bars connect record low temperatures. |
Hastings Temperature Summary: Observed daily maximum and minimum temperatures are connected by blue bars. Area between normal maximum and minimum temperatures is shaded green. Red bars connect record high temperatures. Blue bars connect record low temperatures. |
 |
 |
| Grand Island Precipitation Summary: Green line indicates cumulative observed precipitation for September 2014. Brown line indicates "normal" September precipitation based on 30-year data from 1981-2010. | Hastings Precipitation Summary: Green line indicates cumulative observed precipitation for September 2014. Brown line indicates "normal" September precipitation based on 30-year data from 1981-2010. |
| Grand Island (Regional Airport) - Sept. 2013 - Sept. 2014 | |||||||||||||||||||||||||
| Sep. 2013 | Oct. | Nov. | Dec. | Jan. | Feb. | Mar. | Apr. | May | June | July | Aug. | Sep. | |||||||||||||
| Average High (F) | 82.5 | 64.0 | 50.6 | 37.1 | 38.5 | 33.5 | 51.3 | 64.2 | 76.3 | 83.6 | 84.9 | 84.5 | 76.3 | ||||||||||||
| Average Low (F) | 58.0 | 40.4 | 25.5 | 12.6 | 12.7 | 13.4 | 23.3 | 39.0 | 49.6 | 61.8 | 61.9 | 63.8 | 52.9 | ||||||||||||
| Average Temperature (F) | 70.2 | 52.2 | 38.1 | 24.9 | 25.6 | 23.4 | 37.2 | 51.6 | 62.9 | 72.7 | 73.4 | 74.1 | 64.6 | ||||||||||||
| Departure from Normal (F) | +5.1 | 0.0 | 0.0 | -1.8 | +0.5 | -5.7 | -2.2 | +1.0 | +1.7 | +1.4 | -2.8 | +0.1 | -0.5 | ||||||||||||
| Precipitation (inches) | 2.38 | 4.05 | 0.97 | 0.11 | 0.32 | 0.33 | 0.19 | 2.91 | 0.74 | 9.65 | 2.19 | 5.87 | 3.03 | ||||||||||||
| Departure from Normal | +0.15 | +2.19 | -0.20 | -0.52 | -0.21 | -0.35 | -1.61 | +0.38 | -3.67 | +5.35 | -1.21 | +2.75 | +0.80 | ||||||||||||
| Snowfall (inches) | 0.0 | 0.0 | 0.2 | 2.2 | 4.5 | 6.6 | 1.2 | 1.7 | 0.0 | 0.0 | 0.0 | 0.0 | 0.0 | ||||||||||||
| Departure from Normal | -0.1 | -1.0 | -2.9 | -2.9 | -2.0 | +0.3 | -4.2 | +0.2 | 0.0 | 0.0 | 0.0 | 0.0 | -0.1 | ||||||||||||
| Hastings (Municipal Airport) - Sept. 2013 - Sept. 2014 | |||||||||||||||||||||||||
| Sep. 2013 | Oct. | Nov. | Dec. | Jan. | Feb. | Mar. | Apr. | May | June | July | Aug. | Sep. | |||||||||||||
| Average High (F) | 82.3 | 63.4 | 49.9 | 36.3 | 39.0 | 33.6 | 51.5 | 63.9 | 75.2 | 82.4 | 84.8 | 84.5 | 75.2 | ||||||||||||
| Average Low (F) | 57.6 | 40.4 | 25.1 | 12.4 | 12.8 | 13.2 | 22.5 | 39.2 | 50.3 | 61.9 | 62.4 | 63.7 | 53.5 | ||||||||||||
| Average Temperature (F) | 69.9 | 51.9 | 37.5 | 24.3 | 25.9 | 23.4 | 37.0 | 51.6 | 62.7 | 72.2 | 73.6 | 74.1 | 64.3 | ||||||||||||
| Departure from Normal (F) | +4.3 | -0.7 | -1.2 | -3.3 | -0.1 | -6.5 | -2.9 | +0.9 | +1.4 | +0.4 | -3.5 | -0.2 | -1.3 | ||||||||||||
| Precipitation (inches) | 1.26 | 4.75 | 1.00 | 0.14 | 0.37 | 0.34 | 0.15 | 3.93 | 2.15 | 8.69 | 1.48 | 7.79 | 1.78 | ||||||||||||
| Departure from Normal | -1.30 | +2.76 | -0.29 | -0.47 | -0.04 | -0.15 | -1.64 | +1.37 | -2.42 | +4.89 | -2.26 | +4.49 | -0.78 | ||||||||||||
| Snowfall NWS Office (inches) | 0.0 | 0.0 | 0.4 | 5.0 | 5.4 | 7.5 | 1.2 | 2.2 | 0.0 | 0.0 | 0.0 | 0.0 | 0.0 | ||||||||||||
| Departure from Normal | -0.2 | -1.0 | -2.2 | -1.1 | -0.6 | +1.0 | -4.0 | +1.0 | 0.0 | 0.0 | 0.0 | 0.0 | -0.2 | ||||||||||||
| Kearney (Regional Airport) - Sept. 2013 - Sept. 2014 (*All data from NWS coop observer with daily 24-hour obs taken around 7 AM. As a result, data may vary slightly from true "calendar day" averages) |
|||||||||||||||||||||||||
| Sep. 2013 | Oct. | Nov. | Dec. | Jan. | Feb. | Mar. | Apr. | May | June | July | Aug. | Sep. | |||||||||||||
| Average High (F)* | 82.8 | 63.0 | 49.9 | 36.9 | 39.0 | 33.2 | 49.1 | 62.0 | 73.5 | 82.0 | 84.4 | 85.1 | 74.5 | ||||||||||||
| Average Low (F)* | 55.9 | 39.5 | 25.2 | 12.6 | 12.6 | 13.2 | 19.7 | 35.7 | 46.1 | 59.7 | 59.2 | 61.4 | 51.1 | ||||||||||||
| Average Temperature (F)* | 69.3 | 51.2 | 37.5 | 24.7 | 25.8 | 23.2 | 34.4 | 48.8 | 59.8 | 70.9 | 71.8 | 73.2 | 62.8 | ||||||||||||
| Departure from Normal (F)* | +5.8 | +0.3 | +0.5 | -1.2 | +1.2 | -4.9 | -3.3 | +0.1 | +0.3 | +1.1 | -2.9 | +0.6 | -0.7 | ||||||||||||
| Precipitation (inches) | 3.77 | 3.73 | 0.72 | 0.10 | 0.28 | 0.36 | 0.11 | 3.35 | 0.71 | 8.53 | 0.17 | 7.60 | 2.40 | ||||||||||||
| Departure from Normal | +1.70 | +1.69 | -0.30 | -0.47 | -0.21 | -0.19 | -1.68 | +1.12 | -3.47 | +4.60 | -3.11 | +4.52 | +0.33 | ||||||||||||
| Snowfall (inches) | 0.0 | 0.0 | Trace | 2.7 | 2.8 | 5.8 | 1.3 | 0.7 | 0.0 | 0.0 | 0.0 | 0.0 | 0.0 | ||||||||||||
| Departure from Normal | -0.2 | -0.7 | -3.1 | -0.8 | -1.6 | +0.7 | -3.3 | -1.1 | 0.0 | 0.0 | 0.0 | 0.0 | -0.2 | ||||||||||||
| Ord (Evelyn Sharp Field Airport) - Sept. 2013 - Sept. 2014 (*Winter precipitation data may include coop observer reports due to automated airport equipment under-measuring snowfall liquid equivalent) |
|||||||||||||||||||||||||
| Sep. 2013 | Oct. | Nov. | Dec. | Jan. | Feb. | Mar. | Apr. | May | June | July | Aug. | Sep. | |||||||||||||
| Average High (F) | 81.9 | 61.0 | 48.7 | MSG | 38.3 | 33.1 | 49.8 | 62.7 | 73.1 | 80.3 | 82.9 | 83.8 | 75.2 | ||||||||||||
| Average Low (F) | 54.3 | 35.0 | 20.3 | MSG | 9.8 | 7.8 | 18.6 | 33.7 | 44.4 | 56.7 | 57.4 | 60.9 | 49.0 | ||||||||||||
| Average Temperature (F) | 68.1 | 48.0 | 34.5 | MSG | 24.0 | 20.4 | 34.2 | 48.2 | 58.7 | 68.5 | 70.1 | 72.4 | 62.1 | ||||||||||||
| Departure from Normal (F) | +4.5 | -1.6 | -1.8 | MSG | -0.6 | -7.4 | -3.5 | -0.6 | -0.6 | -0.7 | -4.3 | -0.6 | -1.5 | ||||||||||||
| Precipitation (inches)* | 2.80 | 1.62 | 0.50 | Trace | 0.06 | 0.19 | 0.20 | 1.26 | 0.51 | 8.08 | 2.07 | 5.27 | 1.68 | ||||||||||||
| Departure from Normal | +0.36 | -0.31 | -0.57 | -0.59 | -0.31 | -0.25 | -1.25 | -1.33 | -3.30 | +3.96 | -0.90 | +2.11 | -0.76 | ||||||||||||
| Snowfall (Coop Observer) | 0.0 | 0.0 | 3.5 | 0.5 | 2.5 | 5.5 | 4.0 | 2.5 | 0.0 | 0.0 | 0.0 | 0.0 | 0.0 | ||||||||||||
| Departure from Normal | 0.0 | -1.1 | -1.8 | -6.9 | -4.3 | -0.5 | -1.9 | 0.0 | 0.0 | 0.0 | 0.0 | 0.0 | 0.0 | ||||||||||||
| Smith Center, KS (Cooperative Observer) - Sept. 2013 - Sept. 2014 (*All data from NWS coop observer with daily 24-hour obs taken around 7 AM. As a result, data may vary slightly from true "calendar day" averages) |
|||||||||||||||||||||||||
| Sep. 2013 | Oct. | Nov. | Dec. | Jan. | Feb. | Mar. | Apr. | May | June | July | Aug. | Sep. | |||||||||||||
| Average High (F)* | 86.1 | 68.4 | 52.8 | 38.9 | 41.4 | 36.1 | 52.8 | 66.9 | 77.4 | 85.4 | 89.9 | 91.3 | 80.2 | ||||||||||||
| Average Low (F)* | 58.1 | 40.2 | 25.5 | 13.8 | 12.7 | 13.3 | 21.9 | 37.7 | 48.3 | 61.7 | 61.9 | 63.3 | 52.1 | ||||||||||||
| Average Temperature (F)* | 72.1 | 54.3 | 39.2 | 26.4 | 27.1 | 24.7 | 37.4 | 52.3 | 62.8 | 73.6 | 75.9 | 77.3 | 66.1 | ||||||||||||
| Departure from Normal (F)* | +3.9 | -0.5 | -1.2 | -2.4 | -0.6 | -7.3 | -4.2 | -0.2 | -0.9 | -0.4 | -3.8 | +0.1 | -2.1 | ||||||||||||
| Precipitation (inches) | 1.93 | 0.87 | 1.29 | 0.23 | 0.35 | 0.84 | 0.12 | 1.93 | 2.70 | 8.59 | 2.72 | 6.42 | 1.11 | ||||||||||||
| Departure from Normal | -0.11 | -1.01 | +0.07 | -0.43 | -0.14 | +0.26 | -1.75 | -0.34 | -1.22 | +4.98 | -1.15 | +3.12 | -0.93 | ||||||||||||
| Snowfall (inches) | 0.0 | 0.0 | Trace | 5.3 | 6.9 | 14.8 | 2.4 | 0.7 | 0.0 | 0.0 | 0.0 | 0.0 | 0.0 | ||||||||||||
| Departure from Normal | -0.2 | -0.4 | -1.8 | +2.1 | +3.2 | +10.7 | -0.2 | +0.1 | 0.0 | 0.0 | 0.0 | 0.0 | -0.2 | ||||||||||||
Most of the following images depicting September 2014 Precipitation and Temperatures are courtesy of the High Plains Regional Climate Center:
* Please note: These maps are a "best-approximation" of actual measured values, and data reflected on these maps may not exactly match actual values due to the effects of interpolation and "smoothing" used to create the maps. In addition, some "bullseyes" may be a result of missing data.
Click Images To Enlarge
| Nebraska: September 2014 Measured Precipitation (Inches) |
Kansas: September 2014 Measured Precipitation (Inches) |
 |
 |
| Nebraska: September 2014 Percent of Normal Measured Precip. |
Kansas: September 2014 Percent of Normal Measured Precip. |
 |
 |
| NWS Hastings Area: September 2014 Total "Observed" Precipitation Based On AHPS Precipitation Analysis Including Radar Data |
|
 |
While the precipitation images above are based strictly on gauge-measured data, this image on the left utilizes an "Observed" multisensor approach created by River Forecast Centers. Hourly precipitation estimates from WSR-88D NEXRAD radar are compared to ground rainfall gauge reports, and a bias (correction factor) is calculated and applied to the radar field. For much more information on these types of images, and to create your own precipitation maps, please visit the following site: https://www.srh.noaa.gov/ridge2/ |
| Nebraska: September 2014 Temperature Departure from Normal (F) |
Kansas: September 2014 Temperature Departure from Normal (F) |
 |
 |
The following drought category images, current as of September 30, 2014, are courtesy of the U.S. Drought Monitor (see narrative above for more details):
Click Images To Enlarge
 |
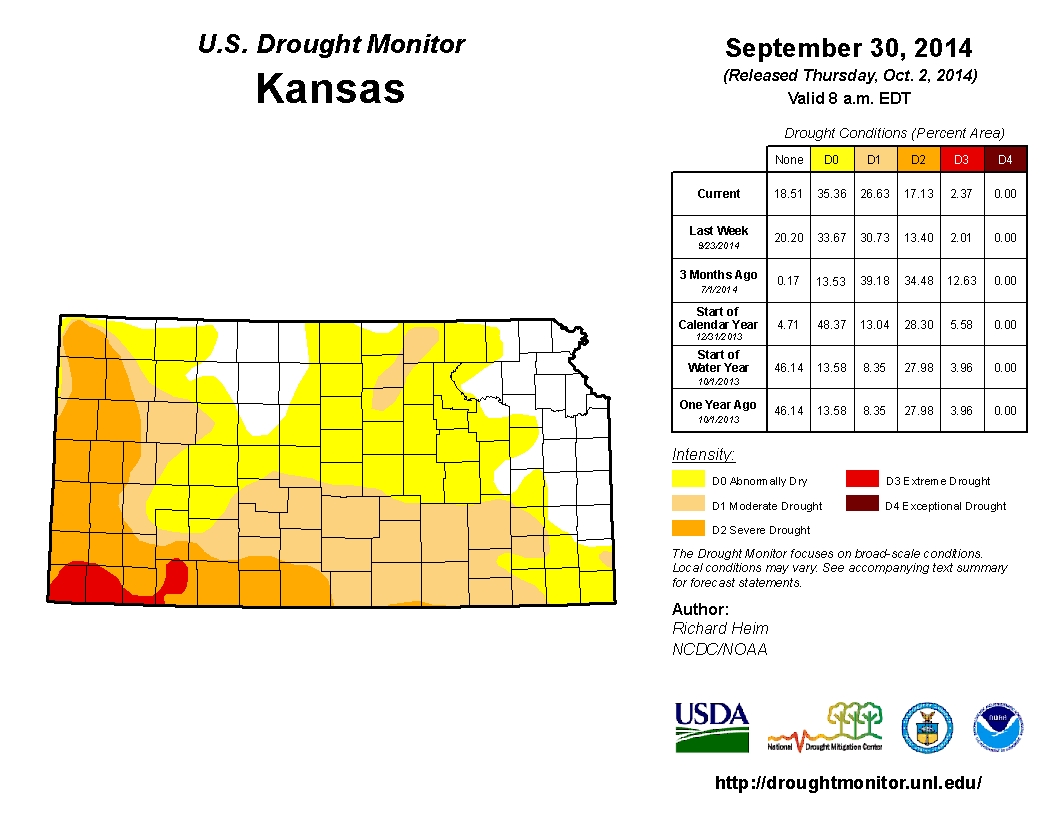 |
| Nebraska - U.S. Drought Monitor as of September 30, 2014 | Kansas - U.S. Drought Monitor as of September 30, 2014 |
For more climate related information, check out the following websites:
| This page was composed by the staff at the National Weather Service in Hastings, Nebraska. |

