(Click on the links in gray boxes below to quickly jump to information located farther down the page)
| Tri-Cities & Ord Details & Monthly Extremes |
Graphs, Tables, Maps | Drought Monitor Graphics |
Monthly Precipitation & Snowfall Tables & Archive of These Monthly Reviews |
* Please Note: All climate data presented here are preliminary and have not undergone final quality control by the National Climatic Data Center (NCDC). Therefore, these data are subject to revision. Final and certified climate data can be accessed at: WWW.NCDC.NOAA.GOV.
November 2014 Climate And Weather Review For South Central Nebraska
And Portions Of North Central Kansas
...November Was A Very Dry Month...But Will Likely Be Most Remembered For Temperature Extremes Including a Record-Cold Mid-Month Stretch and Two Record-Warm Days Toward the End...
The following narrative focuses on climate and weather highlights for the month of November 2014 across the NWS Hastings coverage area, encompassing 24 counties in south central and central Nebraska, and 6 counties in north central Kansas. Click here for a map of this coverage area. The temperature and precipitation data presented here are largely based on the NWS Cooperative Observer network, along with data from a handful of automated airport sites. All climate averages and "normals" presented here are based on the official NCDC 1981-2010 normals.
- TEMPERATURES...(According to 30-year averages, "normal" November high temperatures in South Central Nebraska gradually decrease from the mid-upper 50s early in the month to the lower-mid 40s by the end of the month, while highs in North Central Kansas gradually decrease from the lower-60s to the mid-40s. "Normal" November low temperatures across most of the 30-county area gradually decrease from the lower-mid 30s early in the month to between 17-23° by month's end....)
Based on the monthly average temperature (resulting from averaging together the daily highs and lows), temperatures for the month of November 2014 as a whole across the 30-county area generally finished somewhere between 3-5° colder than the 30-year normal, which is a fairly significant departure. Not surprisingly, this was cold enough to put many places among their Top 10 to 15 coldest months of November on record (including the Nebraska Tri Cities). When taking a closer look at monthly temperature trends, however, Nov. 2014 was truly a "roller coaster ride": the opening one-third of the month averaged seasonably mild, followed by a record-cold middle 10 days, and then a pair of extremely warm days toward the end of the month, only to be followed by one last blast of cold on the very last day. At Hastings airport, where temperature trends were generally representative of much of the 30-county area as a whole, 18 of 30 November days featured a below normal average temperature and 12 were above normal. Following below are several temperature highlights/details for the month of November 2014:
The overall-biggest temperature story during the month was the notable cold snap that gripped the area during the middle 10 days from the 11th-20th. At both Grand Island and Hastings airport, this marked the coldest 10-day stretch on record that occurred during the first three weeks of November. During these 10 days, high temperatures at Grand Island only topped out in the 20s on six days, and eight-of-ten days climbed no higher than 36°. During this same stretch, daily low temperatures at Grand Island dropped below 10° seven times. For much of the 30-county area, one of the outright-coldest days of the month was the 17th, as highs in most places only topped out between 19-25°. Most sites notched their coldest low temperatures of the month between the 16th-18th, with many locations dropping into the single digits below zero for the first time this fall-winter.
While most places experienced their overall-warmest week during the opening one-third of the month, likely the second-biggest temperature story of Nov. 2014 centered around the notable two-day blast of late-fall "heat" that arrived on the 28th-29th. On both of these days, most of the 30-county area soared well into the 70s, with some places even reaching 80°. Needless to say, both Grand Island and Hastings smashed record highs for the date on both days. More significantly, this marked the first time on record that Hastings reached 80° during the second half of November. At both Grand Island and Hastings, this was the second-latest occurrence of an 80+° reading during the calendar year, as both sites had reached 80° once before during the month of December. Needless to say, this brief warm stretch came to a screeching halt on the last day of the month, as the passage of an Arctic cold front knocked high temperatures well down into the 20s on the 30th.
Per dozens of NWS cooperative observers and a few automated airport sites, the entire 30-county area observed its warmest readings of the month on either the 28th or 29th. A few of these "hottest" highs featured: 81° three miles north of York, 80° at Hastings airport, Aurora airport and Clay Center, and 78° at Grand Island airport, Cambridge and Franklin. (please refer to the extremes section below for a longer list of warmest/coldest temperatures)
Per dozens of NWS cooperative observers and a few automated airport sites, the coldest low temperatures of the month across most all of the 30-county area occurred between the 16th-18th, featuring seasonably-frigid values of: -6° at Ord airport and four miles east of Superior, -5° at Greeley and Cambridge, and -3° at Grand Island airport, Aurora airport, Gothenburg, Holdrege, Osceola and two miles southwest of Alton KS. (please refer to the extremes section below for a longer list of warmest/coldest temperatures)
Among the official Nebraska Tri-Cities airport temperature stations, the warmest November high temperatures at each site occurred on the 29th, featuring 80° at Hastings, 78° at Grand Island and 76° at Kearney. The coldest Tri-Cities low temperatures all occurred on the 16th, consisting of -3° at Grand Island, -2° at Kearney and 1° at Hastings. For the monthly average temperature as a whole, Hastings had its 10th-coldest November on record out of 106 years, Kearney tied for its 13-coldest out of 112 years, and Grand Island notched its 15th-coldest out of 120 years. (please refer to the web story linked at the top of this page for more specific Tri-Cities details)
The most extreme day-to-day change in November high temperatures at Hastings airport was an incredible 54°, consisting of a major chill-down from 80° on the 29th to only 26° on the 30th.
(Please look farther down the page for more information on November 2014 temperatures and extremes, including detailed breakdowns for Grand Island, Hastings, Kearney and Ord.)
- PRECIPITATION/FLOODING...(According to 30-year averages, "normal" November precipitation across the NWS Hastings coverage area (rainfall and snow liquid equivalent) ranges between 0.85"- 1.10" across roughly the western half of the area including places such as Kearney, Cambridge and Plainville KS, up to between 1.30" - 1.45" in eastern locations such as York and Hebron. November snowfall normals range from 2.5 - 4" across most of South Central Nebraska, and 1-2" in North Central Kansas...)
Needless to say, November was a VERY dry month across the 30-county NWS Hastings coverage area compared to the 30-year precipitation normal. However, there were in fact a few minor snow events during the month, putting most areas reasonably close to "typical" November snow totals.
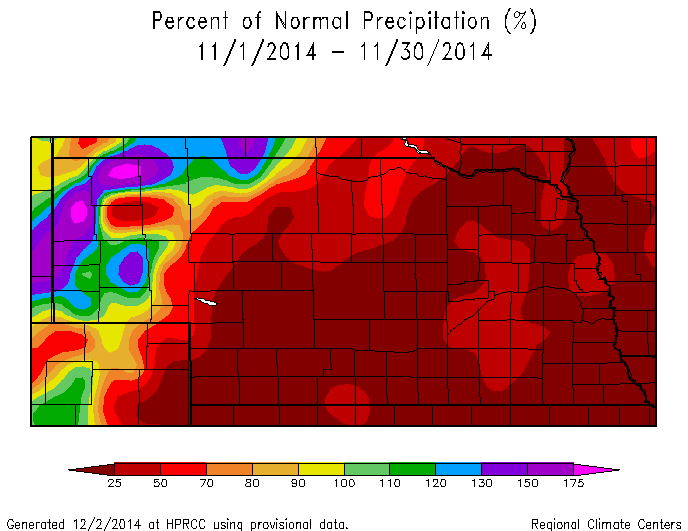
Based on reports from around 65 NWS Cooperative Observers and a few automated airport gauges, and also incorporating radar-derived estimation, not only did the ENTIRE AREA HAVE BELOW NORMAL November precipitation, but likely at least 75% of the area measured LESS THAN ONE-FOURTH OF NORMAL monthly precipitation (based on a general, area-wide normal November precipitation of 1.20")! Somewhat surprisingly though, this was not even a Top-10 Driest November on record for most of the area, given that several prior Novembers were even drier.
Among the official Nebraska Tri-Cities airport precipitation sites, Grand Island led the way with only 0.29”, followed by Hastings (0.23”) and Kearney (0.06”). (please refer to the web story linked at the top of this page for more specific Tri-Cities details)
As for monthly precipitation extremes within the 30-county area, a few of the highest-known November totals per a combination of NWS cooperative observers and the NeRAIN network are as follows: 0.73" in Bruning (NWS), 0.52" three miles north of York (NWS), 0.50" in Osceola (NWS), 0.45" at Benedict (NeRAIN) and six miles southeast of Davenport (NeRAIN), and 0.43" at Central City (NWS) and six miles southwest of Columbus (NeRAIN). (please refer to the extremes section below for a longer list of highest/lowest precipitation amounts)
On the outright-driest side of things during November, a few of the lowest monthly precipitation totals per NWS cooperative observers featured: only a non-measurable Trace at Cozad, six miles north-northwest of Oxford and at Long Island KS, 0.02" at Red Cloud, Glen Elder Dam KS and four miles west-northwest of Plainville KS, and 0.03" at the following sites: Naponee, Webster Dam KS, Lovewell Dam KS and Lebanon KS. (please refer to the extremes section below for a longer list of highest/lowest precipitation amounts)
Snowfall: Although there were certainly no "major" snow events during the month, there were a few fairly "minor" ones in most areas. Of these, the most significant occurred on Saturday the 15th, as several counties generally along and especially east of the Highway 281 corridor in South Central Nebraska received somewhere between 1.5-3.0", with a few locally higher totals from NWS cooperative observers including 3.8" four miles north of Aurora and 3.3" three miles north of York. Meanwhile, most counties west of Highway 281 in South Central Nebraska and southward into North Central Kansas averaged around 1.0" or less. As for the NWS observer sites with the highest monthly totals, they were as follows: 5.0" at Hubbell, 4.3" three miles north of York, 4.0" at Ord, 3.8" four miles north of Aurora and 3.6" at Hebron. (please refer to the extremes section below for a longer list of highest snowfall amounts)
Flooding: Given the notable lack of precipitation during the month, there was certainly no flooding due to excessive rainfall/snowfall. However, from the 25th-28th there was at least one instance of localized minor flooding in Hall County due to an ICE JAM. This occurred along a small stretch of the Platte River that tends to see minor ice jam flooding on a semi-regular basis, generally near the Highway 281/Interstate 80 interchange south of Grand Island. As with most ice jams, this one was sparked by temperatures warming back above freezing following a notable cold stretch. In this case, all flooding was confined to agricultural/pasture areas near the river and did not affect any businesses on the south side of Interstate 80 exit 312. Because ice jams are often difficult (if not impossible) to detect using the sparse network of automated gauges, it is possible that other ice jams might have occurred within other parts of the 30-county local area during the month, but NWS Hastings received no reports of them.
(Please look farther down the page for more information on November 2014 precipitation/snowfall and extremes, including rankings of wettest and driest locations, percent-of-normal plots, and a detailed breakdown for Grand Island, Hastings, Kearney and Ord. In addition, the link on the far upper right of this page contains an archive of monthly/annual precipitation and snowfall totals for around 70 locations.)
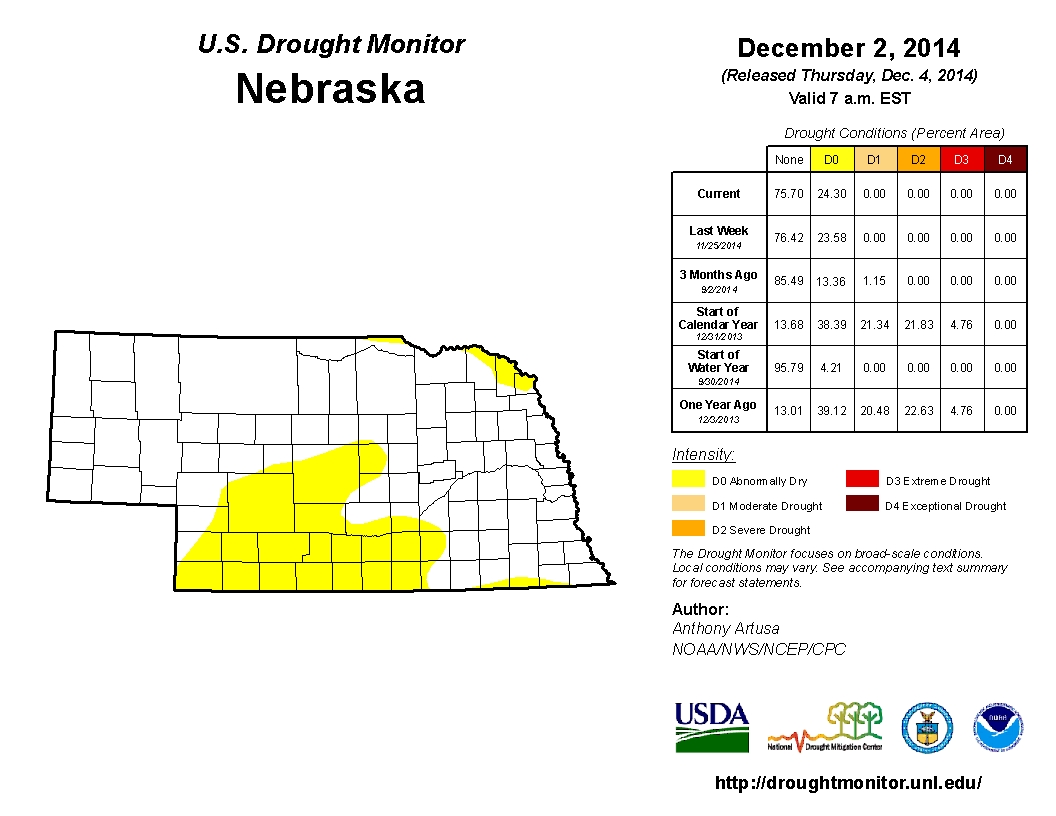
- DROUGHT STATUS (see images at bottom of page)...Given that November was a VERY dry month across the entire 30-county NWS Hastings coverage area , it should come as no surprise that the very lowest level of drought classification (D0 Abnormally Dry) crept back into much of the area during the month, according to weekly issuances of the U.S. Drought Monitor. Of course, the month began with NO DROUGHT CLASSIFICATION WHATSOEVER within the local area. However, by month's end, roughly 60% of the local area had degraded back to category D0 Abnormally Dry (considered to be one category better than “true” drought). This included all of North Central Kansas, along with most (but not all) South Central Nebraska counties along and west of Highway 281. Meanwhile, most (but not all) counties east of the Highway 281 corridor, along with a few other counties such as Greeley and Howard, still remained void of all drought classification whatsoever.
In hindsight, given how dry the combined months of October-November (and in some places September-November) ended up being across most of the local area, this only emphasized just how crucial it was for long-term drought relief that the summer months of June and August featured abundant, well-above normal rainfall.
- SEVERE THUNDERSTORMS/HIGH WINDS (for all official/finalized storm reports please refer to NCDC Storm Data)...There were likely no thunderstorms whatsoever within the NWS Hastings coverage area during November 2014, and there were certainly no strong to severe storms. Furthermore, there were no "significant" wind events featuring widespread gusts of 50+ MPH. However, as is typical during the fall there were several "minor" windy days with gusts of 40+ MPH behind passing cold fronts. For example, at Central Nebraska Regional Airport in Grand Island, there were eight days with peak northwesterly gusts of 40+ MPH, led by 46 MPH gusts on both the 10th and 26th.
- Number of Severe Thunderstorm Warning polygons issued by NWS Hastings in November 2014: 0 (Same as November 2013)
- Number of Tornado Warning polygons issued by NWS Hastings in November 2014: 0 (Same as November 2013)
- Number of confirmed tornadoes within the NWS Hastings coverage area in November 2014: 0 (same as November 2013)
Click on the link below for November 2014 climate summaries specifically for Grand Island, Hastings, Kearney and Ord
Grand Island - Hastings - Kearney - Ord
|
...A FEW OF THE WARMEST HIGH TEMPERATURES DURING NOVEMBER 2014 |
Various graphs and tables depicting November 2014 climate data for
South Central Nebraska and North Central Kansas:
* Please Note: These data are preliminary and have not undergone final quality control by the National Climatic Data Center (NCDC). Therefore, these data are subject to revision. Final and certified climate data can be accessed at WWW.NCDC.NOAA.GOV
 |
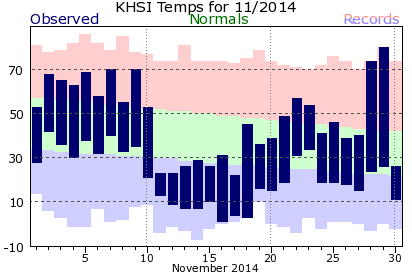 |
| Grand Island Temperature Summary: Observed daily maximum and minimum temperatures are connected by blue bars. Area between normal maximum and minimum temperatures is shaded green. Red bars connect record high temperatures. Blue bars connect record low temperatures. |
Hastings Temperature Summary: Observed daily maximum and minimum temperatures are connected by blue bars. Area between normal maximum and minimum temperatures is shaded green. Red bars connect record high temperatures. Blue bars connect record low temperatures. |
 |
 |
| Grand Island Precipitation Summary: Green line indicates cumulative observed precipitation for November 2014. Brown line indicates "normal" November precipitation based on 30-year data from 1981-2010. | Hastings Precipitation Summary: Green line indicates cumulative observed precipitation for November 2014. Brown line indicates "normal" November precipitation based on 30-year data from 1981-2010. |
| Grand Island (Regional Airport) - Nov. 2013 - Nov. 2014 | |||||||||||||||||||||||||
| Nov. 2013 | Dec. | Jan. | Feb. | Mar. | Apr. | May | June | July | Aug. | Sep. | Oct. | Nov. | |||||||||||||
| Average High (F) | 50.6 | 37.1 | 38.5 | 33.5 | 51.3 | 64.2 | 76.3 | 83.6 | 84.9 | 84.5 | 76.3 | 68.7 | 47.3 | ||||||||||||
| Average Low (F) | 25.5 | 12.6 | 12.7 | 13.4 | 23.3 | 39.0 | 49.6 | 61.8 | 61.9 | 63.8 | 52.9 | 41.1 | 21.0 | ||||||||||||
| Average Temperature (F) | 38.1 | 24.9 | 25.6 | 23.4 | 37.2 | 51.6 | 62.9 | 72.7 | 73.4 | 74.1 | 64.6 | 54.9 | 34.2 | ||||||||||||
| Departure from Normal (F) | 0.0 | -1.8 | +0.5 | -5.7 | -2.2 | +1.0 | +1.7 | +1.4 | -2.8 | +0.1 | -0.5 | +2.7 | -3.9 | ||||||||||||
| Precipitation (inches) | 0.97 | 0.11 | 0.32 | 0.33 | 0.19 | 2.91 | 0.74 | 9.65 | 2.19 | 5.87 | 3.03 | 1.28 | 0.29 | ||||||||||||
| Departure from Normal | -0.20 | -0.52 | -0.21 | -0.35 | -1.61 | +0.38 | -3.67 | +5.35 | -1.21 | +2.75 | +0.80 | -0.58 | -0.88 | ||||||||||||
| Snowfall (inches) | 0.2 | 2.2 | 4.5 | 6.6 | 1.2 | 1.7 | 0.0 | 0.0 | 0.0 | 0.0 | 0.0 | 0.0 | 2.2 | ||||||||||||
| Departure from Normal | -2.9 | -2.9 | -2.0 | +0.3 | -4.2 | +0.2 | 0.0 | 0.0 | 0.0 | 0.0 | -0.1 | -1.0 | -0.9 | ||||||||||||
| Hastings (Municipal Airport) - Nov. 2013 - Nov. 2014 | |||||||||||||||||||||||||
| Nov. 2013 | Dec. | Jan. | Feb. | Mar. | Apr. | May | June | July | Aug. | Sep. | Oct. | Nov. | |||||||||||||
| Average High (F) | 49.9 | 36.3 | 39.0 | 33.6 | 51.5 | 63.9 | 75.2 | 82.4 | 84.8 | 84.5 | 75.2 | 67.9 | 47.7 | ||||||||||||
| Average Low (F) | 25.1 | 12.4 | 12.8 | 13.2 | 22.5 | 39.2 | 50.3 | 61.9 | 62.4 | 63.7 | 53.5 | 41.6 | 21.2 | ||||||||||||
| Average Temperature (F) | 37.5 | 24.3 | 25.9 | 23.4 | 37.0 | 51.6 | 62.7 | 72.2 | 73.6 | 74.1 | 64.3 | 54.8 | 34.4 | ||||||||||||
| Departure from Normal (F) | -1.2 | -3.3 | -0.1 | -6.5 | -2.9 | +0.9 | +1.4 | +0.4 | -3.5 | -0.2 | -1.3 | +2.2 | -4.3 | ||||||||||||
| Precipitation (inches) | 1.00 | 0.14 | 0.37 | 0.34 | 0.15 | 3.93 | 2.15 | 8.69 | 1.48 | 7.79 | 1.78 | 1.76 | 0.23 | ||||||||||||
| Departure from Normal | -0.29 | -0.47 | -0.04 | -0.15 | -1.64 | +1.37 | -2.42 | +4.89 | -2.26 | +4.49 | -0.78 | -0.23 | -1.06 | ||||||||||||
| Snowfall NWS Office (inches) | 0.4 | 5.0 | 5.4 | 7.5 | 1.2 | 2.2 | 0.0 | 0.0 | 0.0 | 0.0 | 0.0 | 0.0 | 1.7 | ||||||||||||
| Departure from Normal | -2.2 | -1.1 | -0.6 | +1.0 | -4.0 | +1.0 | 0.0 | 0.0 | 0.0 | 0.0 | -0.2 | -1.0 | -0.9 | ||||||||||||
| Kearney (Regional Airport) - Nov. 2013 - Nov. 2014 (*All data from NWS coop observer with daily 24-hour obs taken around 7 AM. As a result, data may vary slightly from true "calendar day" averages) |
|||||||||||||||||||||||||
| Nov. 2013 | Dec. | Jan. | Feb. | Mar. | Apr. | May | June | July | Aug. | Sep. | Oct. | Nov. | |||||||||||||
| Average High (F)* | 49.9 | 36.9 | 39.0 | 33.2 | 49.1 | 62.0 | 73.5 | 82.0 | 84.4 | 85.1 | 74.5 | 68.3 | 47.5 | ||||||||||||
| Average Low (F)* | 25.2 | 12.6 | 12.6 | 13.2 | 19.7 | 35.7 | 46.1 | 59.7 | 59.2 | 61.4 | 51.1 | 38.5 | 19.2 | ||||||||||||
| Average Temperature (F)* | 37.5 | 24.7 | 25.8 | 23.2 | 34.4 | 48.8 | 59.8 | 70.9 | 71.8 | 73.2 | 62.8 | 53.4 | 33.4 | ||||||||||||
| Departure from Normal (F)* | +0.5 | -1.2 | +1.2 | -4.9 | -3.3 | +0.1 | +0.3 | +1.1 | -2.9 | +0.6 | -0.7 | +2.5 | -3.6 | ||||||||||||
| Precipitation (inches) | 0.72 | 0.10 | 0.28 | 0.36 | 0.11 | 3.35 | 0.71 | 8.53 | 0.17 | 7.60 | 2.40 | 0.99 | 0.06 | ||||||||||||
| Departure from Normal | -0.30 | -0.47 | -0.21 | -0.19 | -1.68 | +1.12 | -3.47 | +4.60 | -3.11 | +4.52 | +0.33 | -1.05 | -0.96 | ||||||||||||
| Snowfall (inches) | Trace | 2.7 | 2.8 | 5.8 | 1.3 | 0.7 | 0.0 | 0.0 | 0.0 | 0.0 | 0.0 | 0.0 | 1.7 | ||||||||||||
| Departure from Normal | -3.1 | -0.8 | -1.6 | +0.7 | -3.3 | -1.1 | 0.0 | 0.0 | 0.0 | 0.0 | -0.2 | -0.7 | -1.4 | ||||||||||||
| Ord (Evelyn Sharp Field Airport) - Nov. 2013 - Nov. 2014 (*Winter precipitation data may include coop observer reports due to automated airport equipment under-measuring snowfall liquid equivalent) |
|||||||||||||||||||||||||
| Nov. 2013 | Dec. | Jan. | Feb. | Mar. | Apr. | May | June | July | Aug. | Sep. | Oct. | Nov. | |||||||||||||
| Average High (F) | 48.7 | MSG | 38.3 | 33.1 | 49.8 | 62.7 | 73.1 | 80.3 | 82.9 | 83.8 | 75.2 | 66.8 | 45.6 | ||||||||||||
| Average Low (F) | 20.3 | MSG | 9.8 | 7.8 | 18.6 | 33.7 | 44.4 | 56.7 | 57.4 | 60.9 | 49.0 | 36.0 | 16.0 | ||||||||||||
| Average Temperature (F) | 34.5 | MSG | 24.0 | 20.4 | 34.2 | 48.2 | 58.7 | 68.5 | 70.1 | 72.4 | 62.1 | 51.4 | 30.8 | ||||||||||||
| Departure from Normal (F) | -1.8 | MSG | -0.6 | -7.4 | -3.5 | -0.6 | -0.6 | -0.7 | -4.3 | -0.6 | -1.5 | +1.8 | -5.5 | ||||||||||||
| Precipitation (inches)* | 0.50 | Trace | 0.06 | 0.19 | 0.20 | 1.26 | 0.51 | 8.08 | 2.07 | 5.27 | 1.68 | 1.14 | 0.06 | ||||||||||||
| Departure from Normal | -0.57 | -0.59 | -0.31 | -0.25 | -1.25 | -1.33 | -3.30 | +3.96 | -0.90 | +2.11 | -0.76 | -0.79 | -1.01 | ||||||||||||
| Snowfall (Coop Observer) | 3.5 | 0.5 | 2.5 | 5.5 | 4.0 | 2.5 | 0.0 | 0.0 | 0.0 | 0.0 | 0.0 | 0.0 | 4.0 | ||||||||||||
| Departure from Normal | -1.8 | -6.9 | -4.3 | -0.5 | -1.9 | 0.0 | 0.0 | 0.0 | 0.0 | 0.0 | 0.0 | -1.1 | -1.3 | ||||||||||||
| Smith Center, KS (Cooperative Observer) - Nov. 2013 - Nov. 2014 (*All data from NWS coop observer with daily 24-hour obs taken around 7 AM. As a result, data may vary slightly from true "calendar day" averages) |
|||||||||||||||||||||||||
| Nov. 2013 | Dec. | Jan. | Feb. | Mar. | Apr. | May | June | July | Aug. | Sep. | Oct. | Nov. | |||||||||||||
| Average High (F)* | 52.8 | 38.9 | 41.4 | 36.1 | 52.8 | 66.9 | 77.4 | 85.4 | 89.9 | 91.3 | 80.2 | 71.8 | 51.3 | ||||||||||||
| Average Low (F)* | 25.5 | 13.8 | 12.7 | 13.3 | 21.9 | 37.7 | 48.3 | 61.7 | 61.9 | 63.3 | 52.1 | 42.2 | 20.7 | ||||||||||||
| Average Temperature (F)* | 39.2 | 26.4 | 27.1 | 24.7 | 37.4 | 52.3 | 62.8 | 73.6 | 75.9 | 77.3 | 66.1 | 57.0 | 36.0 | ||||||||||||
| Departure from Normal (F)* | -1.2 | -2.4 | -0.6 | -7.3 | -4.2 | -0.2 | -0.9 | -0.4 | -3.8 | +0.1 | -2.1 | +2.2 | -4.4 | ||||||||||||
| Precipitation (inches) | 1.29 | 0.23 | 0.35 | 0.84 | 0.12 | 1.93 | 2.70 | 8.59 | 2.72 | 6.42 | 1.11 | 0.54 | 0.08 | ||||||||||||
| Departure from Normal | +0.07 | -0.43 | -0.14 | +0.26 | -1.75 | -0.34 | -1.22 | +4.98 | -1.15 | +3.12 | -0.93 | -1.34 | -1.14 | ||||||||||||
| Snowfall (inches) | Trace | 5.3 | 6.9 | 14.8 | 2.4 | 0.7 | 0.0 | 0.0 | 0.0 | 0.0 | 0.0 | 0.0 | 1.3 | ||||||||||||
| Departure from Normal | -1.8 | +2.1 | +3.2 | +10.7 | -0.2 | +0.1 | 0.0 | 0.0 | 0.0 | 0.0 | -0.2 | -0.4 | -0.5 | ||||||||||||
Most of the following images depicting November 2014 Precipitation and Temperatures are courtesy of the High Plains Regional Climate Center:
* Please note: These maps are a "best-approximation" of actual measured values, and data reflected on these maps may not exactly match actual values due to the effects of interpolation and "smoothing" used to create the maps. In addition, some "bullseyes" may be a result of missing data.
Click Images To Enlarge
| Nebraska: November 2014 Measured Precipitation (Inches) |
Kansas: November 2014 Measured Precipitation (Inches) |
 |
 |
| Nebraska: November 2014 Percent of Normal Measured Precip. |
Kansas: November 2014 Percent of Normal Measured Precip. |
 |
 |
| NWS Hastings Area: November 2014 Total "Observed" Precipitation Based On AHPS Precipitation Analysis Including Radar Data |
|
 |
While the precipitation images above are based strictly on gauge-measured data, this image on the left utilizes an "Observed" multisensor approach created by River Forecast Centers. Hourly precipitation estimates from WSR-88D NEXRAD radar are compared to ground rainfall gauge reports, and a bias (correction factor) is calculated and applied to the radar field. For much more information on these types of images, and to create your own precipitation maps, please visit the following site: https://www.srh.noaa.gov/ridge2/ |
| Nebraska: November 2014 Temperature Departure from Normal (F) |
Kansas: November 2014 Temperature Departure from Normal (F) |
 |
 |
The following drought category images, current as of December 2, 2014, are courtesy of the U.S. Drought Monitor (see narrative above for more details):
Click Images To Enlarge
 |
 |
| Nebraska - U.S. Drought Monitor as of December 2, 2014 | Kansas - U.S. Drought Monitor as of December 2, 2014 |
For more climate related information, check out the following websites:
| This page was composed by the staff at the National Weather Service in Hastings, Nebraska. |

