(Click on the links in gray boxes below to quickly jump to information located farther down the page)
| Tri-Cities & Ord Details & Monthly Extremes |
Graphs, Tables, Maps | Drought Monitor Graphics |
Monthly Precipitation & Snowfall Tables & Archive of These Monthly Reviews |
* Please Note: All climate data presented here are preliminary and have not undergone final quality control by the National Climatic Data Center (NCDC). Therefore, these data are subject to revision. Final and certified climate data can be accessed at: WWW.NCDC.NOAA.GOV.
August 2014 Climate And Weather Review For South Central Nebraska
And Portions Of North Central Kansas
...** Monthly narrative/highlights for August 2014 may be added to this section at a later time **...
The following narrative focuses on climate and weather highlights for the month of July 2014 across the NWS Hastings coverage area, encompassing 24 counties in south central and central Nebraska, and 6 counties in north central Kansas. Click here for a map of this coverage area. The temperature and precipitation data presented here are largely based on the NWS Cooperative Observer network, along with data from a handful of automated airport sites. All climate averages and "normals" presented here are based on the official NCDC 1981-2010 normals.
- TEMPERATURES...(According to 30-year averages, "normal" August high temperatures in South Central Nebraska gradually decrease from the upper-80s early in the month to the low-mid 80s by the end of the month, while highs in North Central Kansas gradually decrease from the low-90s to the upper-80s. August low temperatures across most of the 30-county area gradually decrease from the mid-60s early in the month to the upper-50s or low-60s by month's end...)
** Monthly narrative/highlights may be added to this section at a later time **
(Please look farther down the page for more information on August 2014 temperatures and extremes, including detailed breakdowns for Grand Island, Hastings, Kearney and Ord.)
- PRECIPITATION/FLOODING...(According to 30-year averages, "normal" August rainfall across the NWS Hastings coverage area is relatively uniform, with nearly all locations expected to receive between 2.75 - 3.50 inches...)
As was the case two months ago in June, the #1 story across the NWS Hastings coverage area during August 2014 was again widespread, soaking rainfall, as a large percentage of the 30-county area observed at least a Top-10, if not a Top-5 wettest August on record based on long term records reaching back around 100 or more years. Following below are a few precipitation highlights/details for the month of August 2014:
Based on reports from around 65 NWS Cooperative Observers and a few automated airport gauges, and also incorporating radar-derived estimation, the vast majority of the 30-county area observed above normal rainfall during August 2014. More significantly, at least 40% of the area measured AT LEAST TWICE NORMAL August rainfall (meaning generally more than 6.25"). Although very limited in nature, somewhere around 5% of the coverage area even exceeded THREE TIMES NORMAL August rainfall (meaning generally more than 9.40")!.
Although most places with long-term observing histories did not lay claim to the outright-wettest August on record, one NWS cooperative observer site that did was 3N York which measured a whopping 12.86", crushing the former top-spot of 10.03" in 1977!
Among the official Nebraska Tri-Cities airport precipitation sites, Hastings led the way with 7.79”, followed by Kearney (7.60”) and Grand Island (5.87”). At Kearney, this was the 2nd-wettest August on record out of 120 years, at Hastings it was the 5th-wettest August out of 120 years and at Grand Island it was the 9th-wettest August out of 119 years.
(Please look farther down the page for more information on August 2014 precipitation/snowfall and extremes, including rankings of wettest and driest locations, percent-of-normal plots, and a detailed breakdown for Grand Island, Hastings, Kearney and Ord. In addition, the link on the far upper right of this page contains an archive of monthly/annual precipitation and snowfall totals for around 70 locations.)
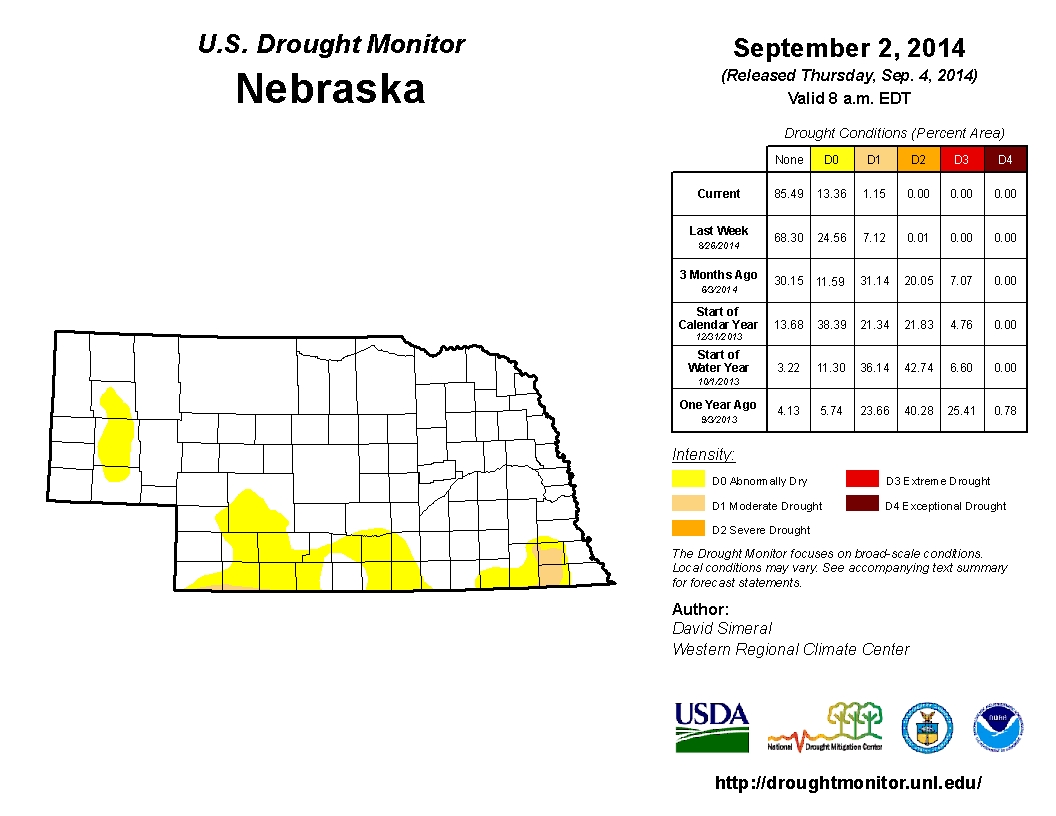
- DROUGHT STATUS (see images at bottom of page)... ** Monthly narrative/highlights may be added to this section at a later time **
- SEVERE THUNDERSTORMS/HIGH WINDS (for all official/finalized storm reports please refer to NCDC Storm Data)
August was an unusually-active month in the severe weather department, with many dozens of reports of large hail and 58+ MPH severe thunderstorm wind gusts across the 30-county coverage area. Fortunately, no tornadoes were confirmed. Although there were far too many severe weather events during August 2014 to provide significant detail here, PLEASE refer to the web story links at the top of this page for an in-depth summary of a few of the most widespread/significant severe weather events of the month.
- Number of Severe Thunderstorm Warning polygons issued by NWS Hastings in August 2014: 91 (73 more than August 2013)
- Number of Tornado Warning polygons issued by NWS Hastings in August 2014: 1 (1 fewer than August 2013)
- Number of confirmed tornadoes within the NWS Hastings coverage area in August 2014: ZERO (same as Aug. 2013)
Click on the link below for August 2014 climate summaries specifically for Grand Island, Hastings, Kearney and Ord
Grand Island - Hastings - Kearney - Ord
|
...A FEW OF THE HOTTEST HIGH TEMPERATURES DURING AUGUST 2014 |
Various graphs and tables depicting August 2014 climate data for
South Central Nebraska and North Central Kansas:
* Please Note: These data are preliminary and have not undergone final quality control by the National Climatic Data Center (NCDC). Therefore, these data are subject to revision. Final and certified climate data can be accessed at WWW.NCDC.NOAA.GOV
 |
 |
| Grand Island Temperature Summary: Observed daily maximum and minimum temperatures are connected by blue bars. Area between normal maximum and minimum temperatures is shaded green. Red bars connect record high temperatures. Blue bars connect record low temperatures. |
Hastings Temperature Summary: Observed daily maximum and minimum temperatures are connected by blue bars. Area between normal maximum and minimum temperatures is shaded green. Red bars connect record high temperatures. Blue bars connect record low temperatures. |
 |
 |
| Grand Island Precipitation Summary: Green line indicates cumulative observed precipitation for August 2014. Brown line indicates "normal" August precipitation based on 30-year data from 1981-2010. | Hastings Precipitation Summary: Green line indicates cumulative observed precipitation for August 2014. Brown line indicates "normal" August precipitation based on 30-year data from 1981-2010. |
| Grand Island (Regional Airport) - August 2013 - August 2014 | |||||||||||||||||||||||||
| Aug. 2013 | Sep. | Oct. | Nov. | Dec. | Jan. | Feb. | Mar. | Apr. | May | June | July | Aug. | |||||||||||||
| Average High (F) | 85.8 | 82.5 | 64.0 | 50.6 | 37.1 | 38.5 | 33.5 | 51.3 | 64.2 | 76.3 | 83.6 | 84.9 | 84.5 | ||||||||||||
| Average Low (F) | 66.0 | 58.0 | 40.4 | 25.5 | 12.6 | 12.7 | 13.4 | 23.3 | 39.0 | 49.6 | 61.8 | 61.9 | 63.8 | ||||||||||||
| Average Temperature (F) | 75.9 | 70.2 | 52.2 | 38.1 | 24.9 | 25.6 | 23.4 | 37.2 | 51.6 | 62.9 | 72.7 | 73.4 | 74.1 | ||||||||||||
| Departure from Normal (F) | +1.9 | +5.1 | 0.0 | 0.0 | -1.8 | +0.5 | -5.7 | -2.2 | +1.0 | +1.7 | +1.4 | -2.8 | +0.1 | ||||||||||||
| Precipitation (inches) | 3.02 | 2.38 | 4.05 | 0.97 | 0.11 | 0.32 | 0.33 | 0.19 | 2.91 | 0.74 | 9.65 | 2.19 | 5.87 | ||||||||||||
| Departure from Normal | -0.10 | +0.15 | +2.19 | -0.20 | -0.52 | -0.21 | -0.35 | -1.61 | +0.38 | -3.67 | +5.35 | -1.21 | +2.75 | ||||||||||||
| Snowfall (inches) | 0.0 | 0.0 | 0.0 | 0.2 | 2.2 | 4.5 | 6.6 | 1.2 | 1.7 | 0.0 | 0.0 | 0.0 | 0.0 | ||||||||||||
| Departure from Normal | 0.0 | -0.1 | -1.0 | -2.9 | -2.9 | -2.0 | +0.3 | -4.2 | +0.2 | 0.0 | 0.0 | 0.0 | 0.0 | ||||||||||||
| Hastings (Municipal Airport) - August 2013 - August 2014 | |||||||||||||||||||||||||
| Aug. 2013 | Sep. | Oct. | Nov. | Dec. | Jan. | Feb. | Mar. | Apr. | May | June | July | Aug. | |||||||||||||
| Average High (F) | 84.6 | 82.3 | 63.4 | 49.9 | 36.3 | 39.0 | 33.6 | 51.5 | 63.9 | 75.2 | 82.4 | 84.8 | 84.5 | ||||||||||||
| Average Low (F) | 65.3 | 57.6 | 40.4 | 25.1 | 12.4 | 12.8 | 13.2 | 22.5 | 39.2 | 50.3 | 61.9 | 62.4 | 63.7 | ||||||||||||
| Average Temperature (F) | 75.0 | 69.9 | 51.9 | 37.5 | 24.3 | 25.9 | 23.4 | 37.0 | 51.6 | 62.7 | 72.2 | 73.6 | 74.1 | ||||||||||||
| Departure from Normal (F) | +0.7 | +4.3 | -0.7 | -1.2 | -3.3 | -0.1 | -6.5 | -2.9 | +0.9 | +1.4 | +0.4 | -3.5 | -0.2 | ||||||||||||
| Precipitation (inches) | 3.25 | 1.26 | 4.75 | 1.00 | 0.14 | 0.37 | 0.34 | 0.15 | 3.93 | 2.15 | 8.69 | 1.48 | 7.79 | ||||||||||||
| Departure from Normal | -0.05 | -1.30 | +2.76 | -0.29 | -0.47 | -0.04 | -0.15 | -1.64 | +1.37 | -2.42 | +4.89 | -2.26 | +4.49 | ||||||||||||
| Snowfall NWS Office (inches) | 0.0 | 0.0 | 0.0 | 0.4 | 5.0 | 5.4 | 7.5 | 1.2 | 2.2 | 0.0 | 0.0 | 0.0 | 0.0 | ||||||||||||
| Departure from Normal | 0.0 | -0.2 | -1.0 | -2.2 | -1.1 | -0.6 | +1.0 | -4.0 | +1.0 | 0.0 | 0.0 | 0.0 | 0.0 | ||||||||||||
| Kearney (Regional Airport) - August 2013 - August 2014 (*All data from NWS coop observer with daily 24-hour obs taken around 7 AM. As a result, data may vary slightly from true "calendar day" averages) |
|||||||||||||||||||||||||
| Aug. 2013 | Sep. | Oct. | Nov. | Dec. | Jan. | Feb. | Mar. | Apr. | May | June | July | Aug. | |||||||||||||
| Average High (F)* | 85.7 | 82.8 | 63.0 | 49.9 | 36.9 | 39.0 | 33.2 | 49.1 | 62.0 | 73.5 | 82.0 | 84.4 | 85.1 | ||||||||||||
| Average Low (F)* | 63.9 | 55.9 | 39.5 | 25.2 | 12.6 | 12.6 | 13.2 | 19.7 | 35.7 | 46.1 | 59.7 | 59.2 | 61.4 | ||||||||||||
| Average Temperature (F)* | 74.8 | 69.3 | 51.2 | 37.5 | 24.7 | 25.8 | 23.2 | 34.4 | 48.8 | 59.8 | 70.9 | 71.8 | 73.2 | ||||||||||||
| Departure from Normal (F)* | +2.2 | +5.8 | +0.3 | +0.5 | -1.2 | +1.2 | -4.9 | -3.3 | +0.1 | +0.3 | +1.1 | -2.9 | +0.6 | ||||||||||||
| Precipitation (inches) | 2.19 | 3.77 | 3.73 | 0.72 | 0.10 | 0.28 | 0.36 | 0.11 | 3.35 | 0.71 | 8.53 | 0.17 | 7.60 | ||||||||||||
| Departure from Normal | -0.89 | +1.70 | +1.69 | -0.30 | -0.47 | -0.21 | -0.19 | -1.68 | +1.12 | -3.47 | +4.60 | -3.11 | +4.52 | ||||||||||||
| Snowfall (inches) | 0.0 | 0.0 | 0.0 | Trace | 2.7 | 2.8 | 5.8 | 1.3 | 0.7 | 0.0 | 0.0 | 0.0 | 0.0 | ||||||||||||
| Departure from Normal | 0.0 | -0.2 | -0.7 | -3.1 | -0.8 | -1.6 | +0.7 | -3.3 | -1.1 | 0.0 | 0.0 | 0.0 | 0.0 | ||||||||||||
| Ord (Evelyn Sharp Field Airport) - August 2013 - August 2014 (*Winter precipitation data may include coop observer reports due to automated airport equipment under-measuring snowfall liquid equivalent) |
|||||||||||||||||||||||||
| Aug. 2013 | Sep. | Oct. | Nov. | Dec. | Jan. | Feb. | Mar. | Apr. | May | June | July | Aug. | |||||||||||||
| Average High (F) | 84.4 | 81.9 | 61.0 | 48.7 | MSG | 38.3 | 33.1 | 49.8 | 62.7 | 73.1 | 80.3 | 82.9 | 83.8 | ||||||||||||
| Average Low (F) | 62.5 | 54.3 | 35.0 | 20.3 | MSG | 9.8 | 7.8 | 18.6 | 33.7 | 44.4 | 56.7 | 57.4 | 60.9 | ||||||||||||
| Average Temperature (F) | 73.5 | 68.1 | 48.0 | 34.5 | MSG | 24.0 | 20.4 | 34.2 | 48.2 | 58.7 | 68.5 | 70.1 | 72.4 | ||||||||||||
| Departure from Normal (F) | +0.5 | +4.5 | -1.6 | -1.8 | MSG | -0.6 | -7.4 | -3.5 | -0.6 | -0.6 | -0.7 | -4.3 | -0.6 | ||||||||||||
| Precipitation (inches)* | 3.77 | 2.80 | 1.62 | 0.50 | Trace | 0.06 | 0.19 | 0.20 | 1.26 | 0.51 | 8.08 | 2.07 | 5.27 | ||||||||||||
| Departure from Normal | +0.61 | +0.36 | -0.31 | -0.57 | -0.59 | -0.31 | -0.25 | -1.25 | -1.33 | -3.30 | +3.96 | -0.90 | +2.11 | ||||||||||||
| Snowfall (Coop Observer) | 0.0 | 0.0 | 0.0 | 3.5 | 0.5 | 2.5 | 5.5 | 4.0 | 2.5 | 0.0 | 0.0 | 0.0 | 0.0 | ||||||||||||
| Departure from Normal | 0.0 | 0.0 | -1.1 | -1.8 | -6.9 | -4.3 | -0.5 | -1.9 | 0.0 | 0.0 | 0.0 | 0.0 | 0.0 | ||||||||||||
| Smith Center, KS (Cooperative Observer) - August 2013 - August 2014 (*All data from NWS coop observer with daily 24-hour obs taken around 7 AM. As a result, data may vary slightly from true "calendar day" averages) |
|||||||||||||||||||||||||
| Aug. 2013 | Sep. | Oct. | Nov. | Dec. | Jan. | Feb. | Mar. | Apr. | May | June | July | Aug. | |||||||||||||
| Average High (F)* | 88.9 | 86.1 | 68.4 | 52.8 | 38.9 | 41.4 | 36.1 | 52.8 | 66.9 | 77.4 | 85.4 | 89.9 | 91.3 | ||||||||||||
| Average Low (F)* | 64.6 | 58.1 | 40.2 | 25.5 | 13.8 | 12.7 | 13.3 | 21.9 | 37.7 | 48.3 | 61.7 | 61.9 | 63.3 | ||||||||||||
| Average Temperature (F)* | 76.8 | 72.1 | 54.3 | 39.2 | 26.4 | 27.1 | 24.7 | 37.4 | 52.3 | 62.8 | 73.6 | 75.9 | 77.3 | ||||||||||||
| Departure from Normal (F)* | -0.4 | +3.9 | -0.5 | -1.2 | -2.4 | -0.6 | -7.3 | -4.2 | -0.2 | -0.9 | -0.4 | -3.8 | +0.1 | ||||||||||||
| Precipitation (inches) | 3.16 | 1.93 | 0.87 | 1.29 | 0.23 | 0.35 | 0.84 | 0.12 | 1.93 | 2.70 | 8.59 | 2.72 | 6.42 | ||||||||||||
| Departure from Normal | -0.14 | -0.11 | -1.01 | +0.07 | -0.43 | -0.14 | +0.26 | -1.75 | -0.34 | -1.22 | +4.98 | -1.15 | +3.12 | ||||||||||||
| Snowfall (inches) | 0.0 | 0.0 | 0.0 | Trace | 5.3 | 6.9 | 14.8 | 2.4 | 0.7 | 0.0 | 0.0 | 0.0 | 0.0 | ||||||||||||
| Departure from Normal | 0.0 | -0.2 | -0.4 | -1.8 | +2.1 | +3.2 | +10.7 | -0.2 | +0.1 | 0.0 | 0.0 | 0.0 | 0.0 | ||||||||||||
Most of the following images depicting August 2014 Precipitation and Temperatures are courtesy of the High Plains Regional Climate Center:
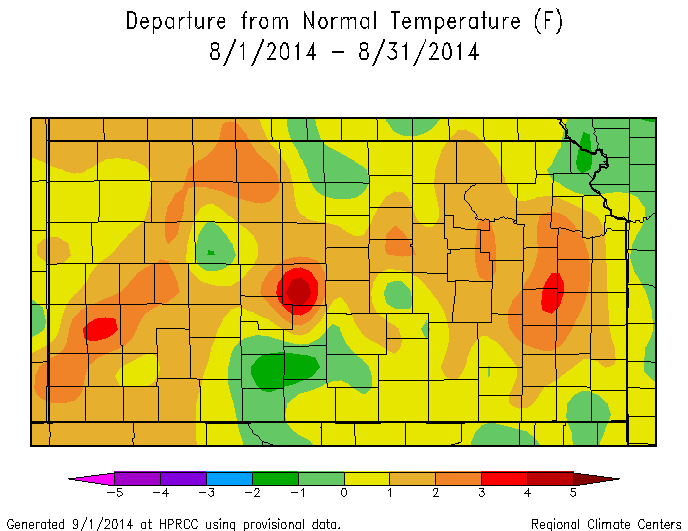
* Please note: These maps are a "best-approximation" of actual measured values, and data reflected on these maps may not exactly match actual values due to the effects of interpolation and "smoothing" used to create the maps. In addition, some "bullseyes" may be a result of missing data.
Click Images To Enlarge
| Nebraska: August 2014 Measured Precipitation (Inches) |
Kansas: August 2014 Measured Precipitation (Inches) |
 |
 |
| Nebraska: August 2014 Percent of Normal Measured Precip. |
Kansas: August 2014 Percent of Normal Measured Precip. |
 |
 |
| NWS Hastings Area: August 2014 Total "Observed" Precipitation Based On AHPS Precipitation Analysis Including Radar Data |
|
 |
While the precipitation images above are based strictly on gauge-measured data, this image on the left utilizes an "Observed" multisensor approach created by River Forecast Centers. Hourly precipitation estimates from WSR-88D NEXRAD radar are compared to ground rainfall gauge reports, and a bias (correction factor) is calculated and applied to the radar field. For much more information on these types of images, and to create your own precipitation maps, please visit the following site: https://www.srh.noaa.gov/ridge2/ |
| Nebraska: August 2014 Temperature Departure from Normal (F) |
Kansas: August 2014 Temperature Departure from Normal (F) |
 |
 |
The following drought category images, current as of September 2, 2014, are courtesy of the U.S. Drought Monitor (see narrative above for more details):
Click Images To Enlarge
 |
 |
| Nebraska - U.S. Drought Monitor as of September 2, 2014 | Kansas - U.S. Drought Monitor as of September 2, 2014 |
For more climate related information, check out the following websites:
| This page was composed by the staff at the National Weather Service in Hastings, Nebraska. |

