
Tropical system in the Gulf expected to gradually strengthen the next couple of days off the Florida Panhandle and Alabama coasts. Instances of flash flooding will be possible through Thursday along the eastern and central Gulf Coast. Severe thunderstorms will develop and move along a cold front crossing the Upper Midwest, and through the Ohio Valley/Mid-Atlantic on Tuesday. Read More >
2023 Precipitation Recap for Our Entire Coverage Area...Including Map, Tables, Extremes, Tri Cities Details, etc.
(click tabs below narrative for a wealth of 2023 precip data...including totals/extremes for not only the Tri Cities but also for our ENTIRE coverage area)
- IN BRIEF: |
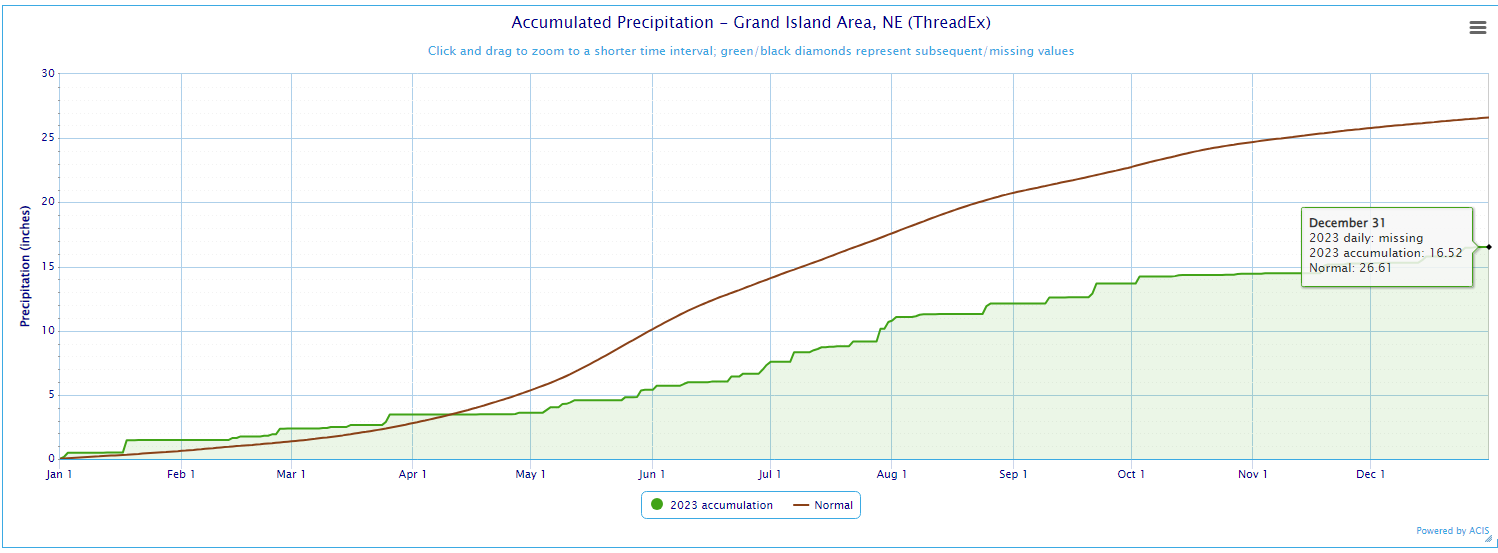
Grand Island - 2023 Monthly Data/Annual Extremes at Central Nebraska Regional Airport (GRI):
Nearly all data is from the official automated ASOS sensor. The main exception involves all snowfall measurements and some associated liquid equivalent (melted snow), which is manually measured by our official NWS observer near the airport. All data is collected on a "calendar day" basis (midnight-to-midnight CST).
| Grand Island (Regional Airport ASOS) - 2023 Monthly Breakdown | |||||||||||||
| Jan | Feb | Mar | Apr | May | June | July | Aug | Sep | Oct | Nov | Dec | 2023 | |
| Average High (F) | 35.0 | 43.2 | 48.1 | 66.9 | 79.4 | 86.7 | 87.1 | 89.0 | 84.9 | 66.0 | 57.1 | 44.3 | 65.6 |
| Average Low (F) | 19.7 | 19.3 | 24.5 | 36.4 | 51.7 | 60.7 | 64.4 | 64.7 | 57.0 | 40.3 | 29.6 | 24.6 | 41.1 |
| Overall Avg. Temperature (F) | 27.4 | 31.3 | 36.3 | 51.6 | 65.5 | 73.7 | 75.8 | 76.9 | 70.9 | 53.1 | 43.3 | 34.5 | 53.4 |
| Departure From Normal | +1.5 | +1.6 | -4.4 | +0.6 | +3.5 | +0.9 | -1.2 | +2.3 | +4.3 | 0.0 | +3.7 | +5.6 | +1.6 |
| Precipitation (in) | 1.49 | 0.88 | 1.09 | 0.15 | 1.78 | 1.94 | 3.35 | 1.44 | 1.55 | 0.77 | 0.79 | 1.29 | 16.52 |
| Departure From Normal | +0.88 | +0.14 | -0.30 | -2.37 | -2.92 | -2.07 | -0.16 | -1.76 | -0.45 | -1.22 | -0.31 | +0.45 | -10.09 |
| Snowfall (in) | 12.3 | 5.0 | 7.1 | 0.0 | 0.0 | 0.0 | 0.0 | 0.0 | 0.0 | 0.9 | 0.9 | 3.3 | |
| Departure From Normal | +5.5 | -2.3 | +3.3 | -1.6 | 0.0 | 0.0 | 0.0 | 0.0 | -0.1 | -0.2 | -1.4 | -1.4 | |
| Hottest Daily HIGH Temperature: | 106°...Aug. 21 |
| Warmest Daily LOW Temperature: | 76°.....Aug. 21, Aug. 24 |
| Warmest Month (Avg Temp): | 76.9°....August |
| Warmest Month VERSUS NORMAL: | December...5.6° warmer than normal |
| This tied for the 6th-WARMEST DECEMBER ON RECORD out of 129 years...warmest since 2021 | |
| Coldest Daily LOW Temperature: | -2°...Feb. 23 |
| Coldest Daily HIGH Temperature: | 8°...Jan. 29 |
| Coldest Month (Avg Temp): | 27.4°....January |
| Coldest Month VERSUS NORMAL: | March...4.4° colder than normal |
| Annual 2023 Average Temperature: | 53.3° (1.6º ABOVE normal) |
| 2023 tied with 2016 for the 6th-WARMEST YEAR ON RECORD out of 128 years of records | |
| Highest Daily Rainfall: | 1.00"...July 29 |
| Highest 2-Day Rainfall: | 1.06"...Sep. 21-22 |
| Wettest Calendar Month: | July...3.35" |
| Driest Calendar Month: | April...0.15" |
| This was the 3RD-DRIEST APRIL ON RECORD out of 128 years...driest since 1989 | |
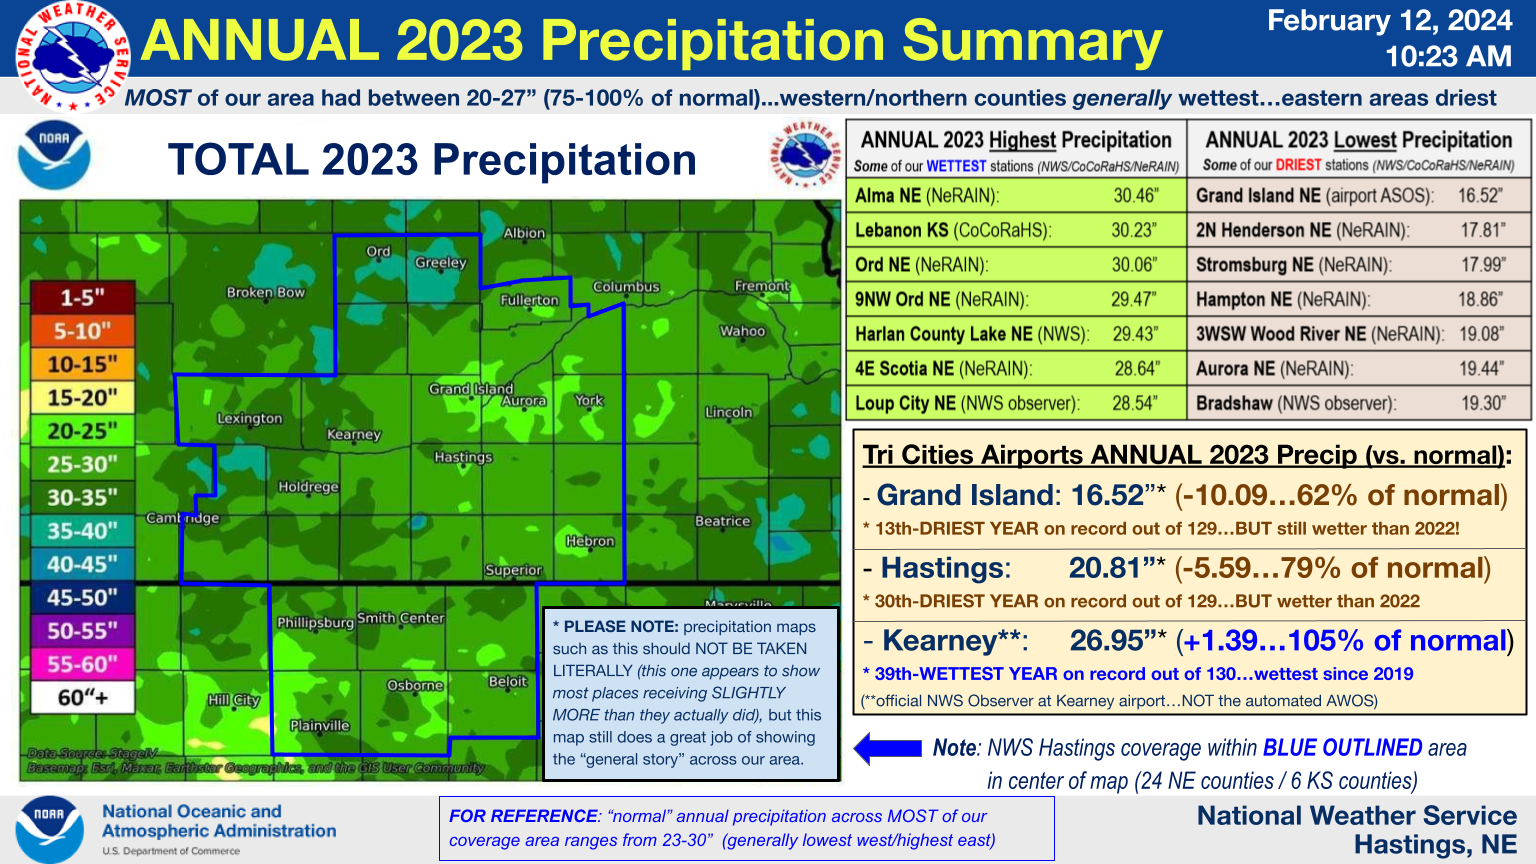
| Annual 2023 Precipitation: | 16.52" (10.09" BELOW normal / 62% of normal) |
| 2023 was the 13th-DRIEST year on record out of 128 (BUT not as dry as 2022) | |
| 2022+2023 COMBINED totaled only 31.70"...an astounding 21.52" BELOW normal / 60% of normal ! | |
| Highest Calendar Day Snowfall: | 10.0"...Jan. 18 |
| Highest 2-Day Snowfall: | same as highest 1-day snowfall |
| Deepest Snow Depth (6 AM CST): | 10"...Jan. 19 |
| Snowiest Calendar Month: | January...12.3" |
| Highest Wind Gust: | 58 MPH on July 29...out of the NW during a morning thunderstorm |
 |
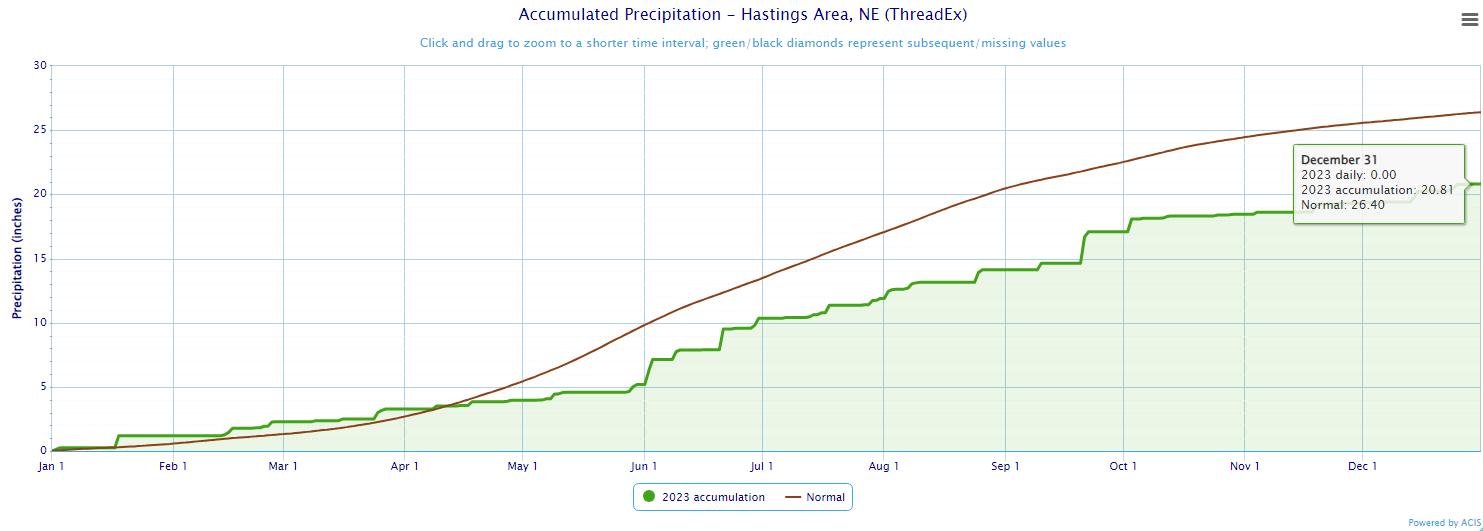
Hastings - 2023 Monthly Data/Annual Extremes at Hastings Municipal Airport (HSI):
Nearly all data is from the official automated ASOS sensor. The main exception involves all snowfall measurements and most associated snowfall liquid equivalent (melted snow), which is manually measured here at NWS Hastings. All data is collected on a "calendar day" basis (midnight-to-midnight CST).
| Hastings (Municipal Airport ASOS) - 2023 Monthly Breakdown | |||||||||||||
| Jan | Feb | Mar | Apr | May | June | July | Aug | Sep | Oct | Nov | Dec | 2023 | |
| Average High (F) | 35.2 | 41.3 | 48.2 | 66.0 | 78.0 | 83.7 | 86.7 | 88.5 | 84.0 | 65.1 | 56.2 | 42.9 | 64.6 |
| Average Low (F) | 19.1 | 18.7 | 25.0 | 36.2 | 52.2 | 60.8 | 63.9 | 63.6 | 56.5 | 41.2 | 30.2 | 25.0 | 41.0 |
| Overall Avg. Temperature (F) | 27.1 | 30.0 | 36.6 | 51.1 | 65.1 | 72.2 | 75.3 | 76.1 | 70.2 | 53.2 | 43.2 | 34.0 | 52.8 |
| Departure From Normal | +0.7 | 0.0 | -4.3 | +0.1 | +3.3 | -0.5 | -1.7 | +1.6 | +3.8 | 0.0 | +3.5 | +4.8 | +0.9 |
| Precipitation (in) | 1.19 | 1.09 | 0.99 | 0.69 | 1.22 | 5.17 | 1.54 | 2.23 | 2.96 | 1.37 | 0.85 | 1.51 | 20.81 |
| Departure From Normal | +0.64 | +0.34 | -0.34 | -2.01 | -3.13 | +1.50 | -2.08 | -1.19 | +0.90 | -0.59 | -0.28 | +0.65 | -5.59 |
| Snowfall (in) | 11.5 | 9.8 | 3.6 | T (hail) | 0.0 | 0.0 | T (hail) | 0.0 | 0.0 | 0.7 | 0.6 | 6.1 | |
| Departure From Normal | +5.0 | +2.3 | -0.2 | -1.7 | 0.0 | 0.0 | 0.0 | 0.0 | 0.0 | -0.5 | -1.7 | +0.5 | |
| Hottest Daily HIGH Temperature: | 104°...Aug. 21 |
| Warmest Daily LOW Temperature: | 77°....Aug. 21 |
| Warmest Month (Avg Temp): | 76.1°....August |
| Warmest Month VERSUS NORMAL: | December...4.8° warmer than normal |
| This was the 13th-WARMEST DECEMBER ON RECORD out of 115 years...warmest since 2021 | |
| Coldest Daily LOW Temperature: | -2°....Feb. 23 |
| Coldest Daily HIGH Temperature: | 7°....Jan. 29 |
| Coldest Month (Avg Temp): | 27.1°....January |
| Coldest Month VERSUS NORMAL: | March...4.3° colder than normal |
| Annual 2023 Average Temperature: | 52.8° (0.9º ABOVE normal) |
| 2023 was the 21st-WARMEST YEAR ON RECORD out of the 97 years ​with no more than 30 days of incomplete temperature data |
|
| Highest Daily Rainfall: | 2.03"...Sep. 21 |
| Highest 2-Day Rainfall: | 2.45"...Sep. 21-22 |
| Wettest Calendar Month: | June...5.17" |
| Driest Calendar Month: | April...0.69" |
| This was the 14th-driest April on record out of 126 years...driest since 1990 | |
| Annual 2023 Precipitation: | 20.81" (5.59" BELOW normal / 79% of normal) |
| 2023 was the 30th-DRIEST YEAR ON RECORD out of 129 | |
| 2022+2023 COMBINED totaled only 36.90"...a notable 15.90" BELOW normal / 70% of normal | |
| Highest Calendar Day Snowfall: | 10.8"...Jan. 18 |
| Highest 2-Day Snowfall: | 11.0"...Jan. 18-19 |
| Deepest Snow Depth (6 AM CST): | 11"...Jan. 19-20 |
| Snowiest Calendar Month: | January...11.5" |
| Highest Wind Gust: | 75 MPH on Aug. 2...out of the west during an early-AM thunderstorm |
 |
​
Kearney - 2023 Monthly Data/Annual Extremes from NWS COOP Observer at Kearney Airport (KRNN1):
| Kearney Airport (NWS COOP Observer) - 2023 Monthly Breakdown | |||||||||||||
| Jan | Feb | Mar | Apr | May | June | July | Aug | Sep | Oct | Nov | Dec | 2023 | |
| Average High (F) | 34.7 | 38.4 | 46.2 | 65.8 | 76.5 | 84.3 | 86.3 | 88.0 | 83.5 | 66.3 | 55.7 | 44.4 | 64.2 |
| Average Low (F) | 18.6 | 16.2 | 23.0 | 33.3 | 49.6 | 58.7 | 62.2 | 61.8 | 53.7 | 40.1 | 27.8 | 23.8 | 39.1 |
| Overall Avg. Temperature (F) | 26.7 | 27.3 | 34.6 | 49.5 | 63.1 | 71.5 | 74.2 | 74.9 | 68.6 | 53.2 | 41.8 | 34.1 | 51.6 |
| Departure From Normal | +1.9 | -0.5 | -3.7 | +0.9 | +3.6 | +1.1 | -0.6 | +2.3 | +4.1 | +1.9 | +3.9 | +6.7 | +1.8 |
| Precipitation (in) | 1.81 | 1.16 | 1.07 | 0.20 | 2.90 | 6.48 | 2.44 | 3.17 | 4.73 | 1.58 | 0.49 | 0.92 | 26.95 |
| Departure From Normal | +1.30 | +0.57 | -0.39 | -2.48 | -1.50 | +2.58 | -0.92 | +0.16 | +2.89 | -0.55 | -0.51 | +0.24 | +1.39 |
| Snowfall (in) | 13.1 | 6.2 | 10.6 | Trace | 0.0 | 0.0 | 0.0 | 0.0 | 0.0 | 0.0 | 1.1 | 4.1 | |
| Departure From Normal | +9.4 | +0.6 | +7.1 | -1.9 | -0.1 | 0.0 | 0.0 | 0.0 | 0.0 | -0.8 | -1.7 | +0.7 | |
| Hottest Daily HIGH Temperature: | 103°...reported July 27, Aug. 24 (actually occurred the day prior) |
| Warmest Daily LOW Temperature: | 72°....reported July 26, Aug. 21, Aug. 25 |
| Warmest Month (Avg Temp): | 74.9°....August |
| Warmest Month VERSUS NORMAL: | December...6.8° warmer than normal |
| This tied for the 3rd-WARMEST DECEMBER ON RECORD out of 120 years...warmest since 2021 | |
| Coldest Daily LOW Temperature: | -9°...reported Feb. 24-25 |
| Coldest Daily HIGH Temperature: | 5°... reported Jan. 30 (actually occurred Jan. 29) |
| Coldest Month (Avg Temp): | 26.7°....January |
| Coldest Month VERSUS NORMAL: | March...3.7° colder than normal |
| Annual 2023 Average Temperature: | 51.6° (1.8º ABOVE normal) |
| 2023 was the 19th-WARMEST YEAR ON RECORD out of the 101 years ​with no more than 30 days of incomplete temperature data |
|
| Highest 24-Hour Rainfall (7am-7am) | 4.03"...reported Sep. 22 |
| Highest 48-Hour Rainfall (7am-7am): | 4.05"...reported Sep. 22-23 |
| Wettest Calendar Month: | June...6.48" |
| This was the 19th-WETTEST JUNE ON RECORD out of 128 years...wettest since 2015 | |
| Driest Calendar Month: | April...0.20" |
| This was the 2nd-DRIEST APRIL ON RECORD out of 128 years...driest since 1989 | |
| Annual 2023 Precipitation: | 26.95" (1.39" ABOVE normal / 105% of normal) |
| 2023 was the 39th-WETTEST year on record out of 130 | |
| 2022+2023 COMBINED still totaled only 44.57"...6.55" BELOW normal / 87% of normal | |
| Highest 24-Hour Snowfall (7am-7am): | 9.0"...reported Jan. 19, March 26 |
| Highest 48-Hour Snowfall (7am-7am): | 10.6"...Jan. 18-19 |
| Deepest Snow Depth (7 AM CST): | 11"...Jan. 19-20 |
| Snowiest Calendar Month: | 13.1"...January |
 |
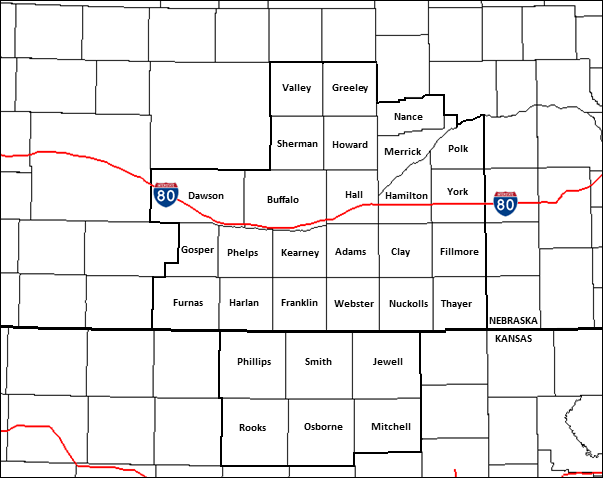
2023 SOUTH CENTRAL NEBRASKA
NWS COOPERATIVE OBSERVER PRECIPITATION
(for 24 counties in the NWS Hastings coverage area)
(see bottom tables for winter 2022-2023 and 2023-2024 seasonal snowfall)
The highest reported amount under each month indicated in BLUE, the lowest amount in RED.
According to 30-year data from NCDC 1981-2010, normal annual precipitation across this 24-county area generally ranges from 23-30 inches, with the lowest part of this range including far western locations such as Gothenburg and Cambridge, and the highest part of this range including far eastern locations near Highway 81 such as York and Hebron.
| Station | Jan | Feb | Mar | Apr | May | Jun | July | Aug | Sep | Oct | Nov | Dec | 2023 Total |
| Arcadia 2W | 2.32 | 0.49 | 0.30 | 0.24 | 5.21 | 3.24 | 3.35 | 1.08 | 1.98 | 3.84 | 0.64 | 1.45 | 24.14 |
| Beaver City | 1.66 | 1.40 | 0.32 | 0.46 | 5.95 | 3.85 | 3.10 | 4.23 | 1.91 | 1.38 | 0.26 | 0.68 | 25.20 |
| Belgrade | 1.49 | 1.00 | 0.72 | 0.64 | 3.08 | 1.71 | 3.12 | 2.05 | 3.61 | 2.10 | 0.85 | 0.92 | 21.26 |
| Blue Hill 4SW | 1.56 | 0.97 | 0.82 | 0.33 | 2.04 | 3.69 | 2.61 | 3.34 | 2.50 | 1.05 | 1.22 | 1.86 | 21.99 |
| Bradshaw | 1.15 | 1.13 | 0.81 | 1.40 | 0.60 | 1.89 | 4.96 | 2.97 | 1.30 | 0.78 | 0.67 | 1.64 | 19.30 |
| Cambridge | 1.87 | 0.94 | 0.50 | 0.24 | 4.94 | 3.25 | 2.67 | 4.30 | 1.38 | 1.06 | 0.36 | 0.33 | 21.84 |
| Lexington 6SSE (Canaday) | 2.00 | 0.99 | 0.96 | 0.17 | 3.53 | 3.23 | 3.54 | 3.03 | 4.41 | 2.13 | 0.58 | 0.50 | 24.45 |
| Clay Center 6 ESE | 0.90 | 0.98 | 0.66 | 0.69 | 1.16 | 2.28 | 7.31 | 3.98 | 1.81 | 1.58 | 1.32 | 1.65 | 24.32 |
| Clay Center | 1.33 | 1.14 | 0.65 | 0.30 | 1.06 | 3.12 | 5.19 | 2.53 | 2.87 | 0.97 | 1.02 | 1.75 | 21.93 |
| Edison | 1.35 | 0.99 | 0.63 | 0.22 | 5.05 | 2.19 | 3.14 | 3.30 | 1.59 | 1.03 | 0.58 | 0.51 | 20.58 |
| Elwood 8S | 1.69 | 1.06 | 1.16 | 0.24 | 3.52 | 4.19 | 3.15 | 2.64 | 3.11 | 2.63 | 0.31 | 0.61 | 24.31 |
| Geneva | 1.15 | 0.67 | 0.64 | 0.43 | 0.21 | 3.53 | 7.23 | 1.89 | 1.41 | MSG | MSG | MSG | MSG |
| Genoa 2W | 1.16 | 1.10 | 0.89 | 0.89 | 2.12 | 2.04 | 5.21 | 2.29 | 3.33 | 2.57 | 0.41 | 1.73 | 23.74 |
| Gothenburg | 2.05 | 0.52 | 0.51 | 0.35 | 5.64 | 2.81 | 2.18 | 3.36 | 2.86 | 1.57 | 0.54 | 1.02 | 23.41 |
| Grand Island Airport | 1.49 | 0.88 | 1.09 | 0.15 | 1.78 | 1.94 | 3.35 | 1.44 | 1.55 | 0.77 | 0.79 | 1.29 | 16.56 |
| Greeley | 1.43 | 0.70 | 0.26 | 0.43 | 3.27 | 3.37 | 3.63 | 3.82 | 2.92 | 4.14 | 1.05 | 0.74 | 25.76 |
| Gresham 3W | 1.05 | 1.27 | 0.86 | 1.84 | 1.34 | 2.11 | 7.17 | 1.37 | 0.88 | 1.51 | 0.47 | 1.52 | 21.39 |
| Harlan County Lake | 1.67 | 1.24 | 0.48 | 0.74 | 5.72 | 3.03 | 4.99 | 6.54 | 2.77 | 0.78 | 0.37 | 1.10 | 29.43 |
| Hastings Airport | 1.19 | 1.09 | 0.99 | 0.69 | 1.22 | 5.17 | 1.54 | 2.23 | 2.96 | 1.37 | 0.85 | 1.51 | 20.81 |
| Hastings NWS Office | 1.24 | 1.10 | 0.99 | 1.86 | 2.06 | 4.34 | 1.98 | 2.04 | 2.29 | 1.09 | 0.85 | 1.70 | 21.54 |
| Hebron | 0.88 | 0.90 | 1.01 | 0.69 | 2.76 | 2.54 | 2.83 | 3.89 | 2.79 | 1.53 | 0.95 | 2.02 | 22.79 |
| Holdrege | 2.00 | 1.39 | 1.32 | 0.17 | 4.18 | 5.05 | 2.20 | 3.72 | 2.93 | 0.79 | 0.58 | 0.85 | 25.18 |
| Hubbell | 1.20 | 0.80 | 0.70 | 1.28 | 2.04 | 3.10 | 2.52 | 6.13 | 2.36 | 1.24 | 1.24 | 1.94 | 24.55 |
| Kearney Airport | 1.81 | 1.16 | 1.07 | 0.20 | 2.90 | 6.48 | 2.44 | 3.17 | 4.73 | 1.58 | 0.49 | 0.92 | 26.95 |
| Loup City | 2.02 | 0.67 | 0.34 | 0.22 | 4.98 | 5.40 | 6.63 | 1.20 | 1.89 | 3.79 | 0.49 | 0.91 | 28.54 |
| Miller | 1.63 | 0.72 | 0.93 | 0.29 | 3.07 | 4.73 | 3.00 | 2.58 | 2.22 | 2.14 | 0.65 | 0.71 | 22.66 |
| Minden | 1.06 | 1.01 | 0.50 | 0.27 | 3.73 | 5.07 | 1.62 | 2.77 | 3.75 | 2.11 | 0.53 | 1.10 | 23.52 |
| Naponee | 1.38 | 1.21 | 0.40 | 0.54 | 5.02 | 3.67 | 4.26 | 5.09 | 2.65 | 1.02 | 0.18 | 1.25 | 26.67 |
| North Loup | 1.88 | 0.53 | 0.18 | 0.41 | 5.58 | 2.65 | 8.27 | 0.92 | 2.00 | 3.46 | 0.78 | 0.90 | 27.56 |
| Orleans 1W | 1.30 | 0.99 | 0.37 | 0.39 | 6.23 | 3.76 | 3.58 | 3.40 | 2.08 | 0.78 | 0.52 | 1.02 | 24.42 |
| Ord Airport | 2.06 | 0.44 | 0.47 | 0.27 | 4.76 | 3.10 | 5.63 | 1.40 | 2.39 | 3.90 | 0.73 | 1.35 | 26.50 |
| Ord | 2.07 | 0.46 | 0.49 | 0.30 | 4.30 | 3.63 | 6.49 | 1.07 | 2.36 | 3.80 | 0.84 | 1.54 | 27.35 |
| Osceola | 1.40 | 0.99 | 1.13 | 0.77 | 1.45 | 2.14 | 6.27 | 1.23 | 1.24 | 1.38 | 0.29 | 1.71 | 20.00 |
| Oxford 6NNW | 1.47 | 1.10 | 0.75 | 0.27 | 5.47 | 4.29 | 2.78 | 3.33 | 1.68 | 1.08 | 0.47 | 0.75 | 23.44 |
| Polk | 1.37 | 0.88 | 0.89 | 0.97 | 1.20 | 2.56 | 5.42 | 1.91 | 1.39 | 1.39 | 0.49 | 1.67 | 20.14 |
| Ravenna | 2.02 | 0.97 | 0.66 | 0.11 | 2.64 | 5.60 | 2.80 | 2.48 | 2.13 | 2.85 | 0.77 | 0.86 | 23.89 |
| Red Cloud | 1.53 | 1.15 | 0.57 | 0.46 | 2.95 | 3.88 | 1.68 | 4.97 | 4.21 | 1.43 | 1.20 | 2.13 | 26.16 |
| St. Paul | 1.73 | 1.04 | 0.96 | 0.37 | 2.81 | 2.56 | 6.02 | 1.23 | 1.26 | 1.09 | 0.82 | 0.81 | 20.70 |
| Shelby 3NE | 0.84 | 0.98 | 0.91 | 0.77 | 0.68 | 3.55 | 5.95 | 2.74 | 1.34 | 1.70 | 0.15 | 1.40 | 21.01 |
| Shickley 4S | 0.82 | 0.74 | 0.66 | 0.47 | 0.81 | 4.88 | 6.31 | 1.95 | 4.79 | 1.42 | 1.07 | 1.65 | 25.57 |
| Superior | 1.13 | 1.28 | 0.62 | 0.80 | 0.84 | 2.81 | 2.34 | 2.83 | 3.77 | 0.74 | 1.47 | 1.67 | 20.30 |
| Wilsonville | 1.51 | 1.33 | 0.39 | 0.54 | 5.26 | 5.77 | 2.10 | 2.84 | 2.44 | 0.72 | 0.33 | 0.70 | 23.93 |
| York 3N | 1.26 | 1.11 | 0.83 | 1.68 | 0.42 | 1.67 | 7.31 | 1.93 | 1.52 | 1.91 | 0.72 | 1.75 | 22.11 |
2023 NORTH CENTRAL KANSAS
NWS COOPERATIVE OBSERVER PRECIPITATION
(for 6 counties in the NWS Hastings coverage area)
(see bottom tables for winter 2022-2023 and 2023-2024 seasonal snowfall)
The highest reported monthly/annual totals indicated in BLUE, the lowest in RED.
According to 30-year data from NCDC 1981-2010, normal annual precipitation across this six-county area generally ranges from 24-27",
with the highest amounts favoring the eastern counties of Jewell and Mitchell.
| Station | Jan | Feb | Mar | Apr | May | Jun | July | Aug | Sep | Oct | Nov | Dec | 2023 Total |
| Beloit | 0.99 | 0.49 | 0.38 | 0.43 | 1.36 | 3.49 | 5.84 | 4.57 | 1.11 | 0.62 | 1.59 | 1.65 | 22.52 |
| Cawker City | 1.26 | 0.70 | 0.31 | 0.14 | 1.62 | 4.25 | 4.34 | 3.59 | 0.76 | 0.99 | 0.76 | 2.14 | 20.86 |
| Glen Elder Lake | 1.07 | 0.75 | 0.19 | 0.34 | 2.54 | 3.73 | 3.46 | 3.92 | 1.18 | 0.60 | 1.04 | 1.93 | 20.75 |
| Ionia | 1.08 | 0.71 | 0.26 | 0.49 | 3.66 | 3.71 | 3.62 | 3.29 | 1.97 | 0.88 | 0.94 | 2.02 | 22.63 |
| Kirwin Dam | 1.75 | 1.12 | 0.24 | 0.38 | 3.28 | 3.18 | 6.16 | 5.67 | 1.24 | 0.78 | 1.02 | 1.69 | 26.51 |
| Lebanon | 1.30 | 0.61 | 0.39 | 0.57 | 3.96 | 6.05 | 2.85 | 7.84 | 2.05 | 1.14 | 0.85 | 1.96 | 29.57 |
| Logan | 1.48 | 0.98 | 0.26 | 0.16 | 3.67 | 1.95 | 3.54 | 5.38 | 1.92 | 1.56 | 0.26 | 1.08 | 22.24 |
| Lovewell Dam | 1.09 | 1.03 | 0.49 | 0.92 | 2.99 | 5.75 | 2.19 | 5.06 | 3.80 | 1.17 | 1.62 | 1.74 | 27.85 |
| Natoma | 1.53 | 0.30 | 0.09 | 0.87 | 2.97 | 5.04 | 4.00 | 4.51 | 0.31 | 1.15 | 0.59 | 1.92 | 23.28 |
| Phillipsburg | 1.60 | 1.10 | 0.25 | 0.35 | 3.62 | 3.65 | 3.87 | 6.69 | 3.28 | 0.57 | 0.36 | 1.20 | 26.10 |
| Plainville 4WNW | 1.53 | 1.04 | 0.30 | 0.06 | 3.42 | 3.17 | 3.89 | 3.89 | 0.63 | 0.12 | 1.03 | 2.01 | 21.09 |
| Smith Center | 1.35 | 0.68 | 0.23 | 0.50 | 1.98 | 5.70 | 2.09 | 7.06 | 2.08 | 0.65 | 0.78 | 2.13 | 25.23 |
| Webster Dam | 1.20 | 0.77 | 0.29 | 0.10 | 2.39 | 5.32 | 3.80 | 3.01 | 0.95 | 0.65 | 0.62 | 1.60 | 20.70 |
NWS Hastings 30-County Coverage Area (data mainly from NWS Cooperative Observers & CocCoRaHS/NeRAIN observers) |
(*Please Note: All data presented here are preliminary and subject to revision. Final and certified climate data is available through National Centers for Environmental Information (NCEI).
Extremes Across our ENTIRE 30-County Area:
Highest 2022 TOTAL Precipitation ("normal" annual precip across our area generally ranges 23-30"...lowest west/highest east)
Lowest 2022 TOTAL Precipitation (only includes stations with no more than 6 days of missing data for the year)
Wettest Calendar Month in 2022
Highest 24-HOUR Rainfall in 2022 (covering a 24-hour period ending around 7am on the specified date)
Please visit the following sites for a wealth of additional local climate information:
- NOWData....official temp/precip/snow data for any NWS observation site in our coverage area
- Daily/Monthly/Annual Precipitation Maps (page maintained by NWS Hastings)
- Daily/Monthly/Seasonal Snowfall Maps (page maintained by NWS Hastings)
- NWS Hastings Local Climate Page (various additional weather/climate info)
- High Plains Regional Climate Center (HPRCC)...information for the entire High Plains region (not just our coverage area)
 |
Media use of NWS Web News Stories is encouraged! Please acknowledge the NWS as the source of any news information accessed from this site. |
|

