
Severe thunderstorms will remain possible in the Mid-Atlantic through Tuesday. Severe thunderstorms and heavy rain will also be possible in the central/southern Plains on Tuesday and Wednesday. Hazardous heat will linger across the southern U.S. and build across the West through mid-week. Hot and dry weather will create Elevated to Critical fire weather conditions in the Four Corners Region. Read More >
2017 Precipitation Summary and Monthly Stats For 5 "Key" Sites
|
Generally speaking, at least 75% of the 30-county NWS Hastings coverage area observed at least slightly ABOVE NORMAL precipitation during 2017, despite what ended up being a markedly-dry final two-and-half months from mid-October onward. Compared to 30-year normals, two of the overall-wettest official NWS stations included Osceola (6.94" above normal) and Ord airport (4.13" above). All in all though, there really weren't any "bone dry" or "sopping wet" areas for the year as a whole, with most places ending up somewhere between 75-125% of normal/average totals.
|
 2017 Precipitation Map and list of several official totals (click to enlarge) |
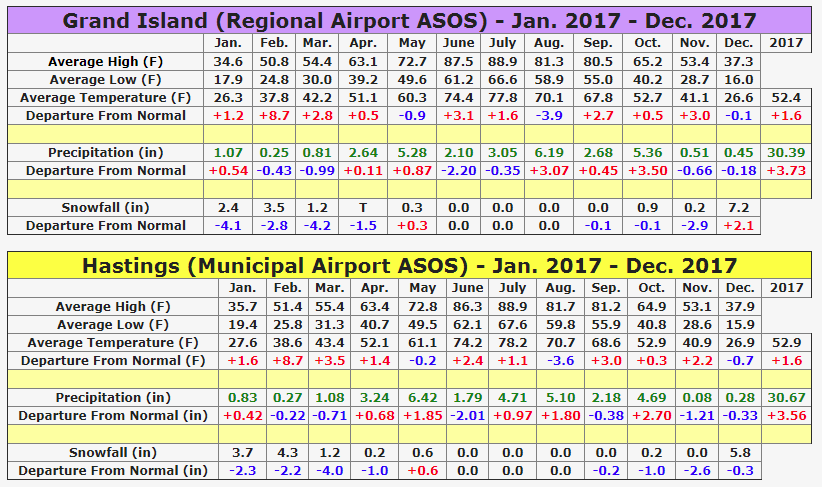 |
| 2017 Monthly Stats for Grand Island and Hastings airports (Hastings snow measured at NWS office) |
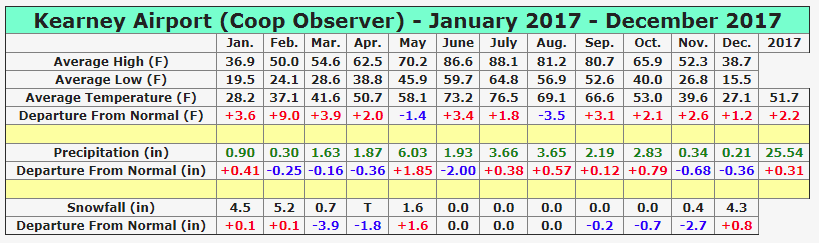 |
| 2017 Monthly Stats for Kearney airport (official NWS coop observer, not the unofficial automated AWOS) |
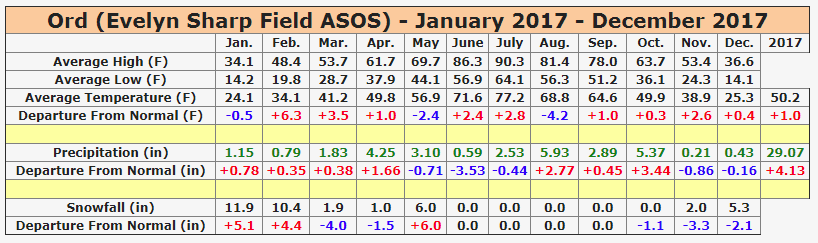 |
| 2017 Monthly Stats for Ord airport (snowfall data provided by NWS coop observer in town) |
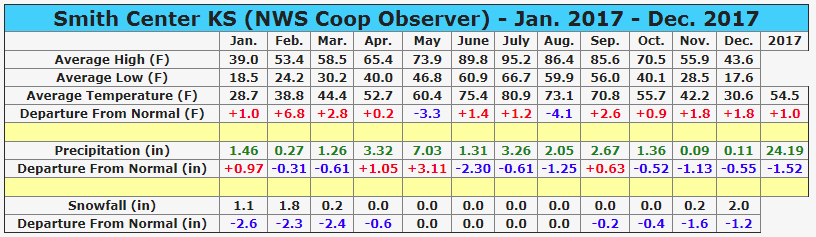 |
| 2017 Monthly Stats for Smith Center (NWS coop observer) |
 |
Media use of NWS Web News Stories is encouraged! Please acknowledge the NWS as the source of any news information accessed from this site. |
|

