
Dangerous and extreme heat will remain across portions of the central U.S. this week, persisting across the mid to lower Mississippi Valley, Gulf Coast, southern Plains and portions of Texas. A heat wave over the Southwest U.S. will peak this weekend. Heavy to excessive rainfall may produce flash flooding from the Delmarva Peninsula north into the Hudson Valley today and tonight. Read More >
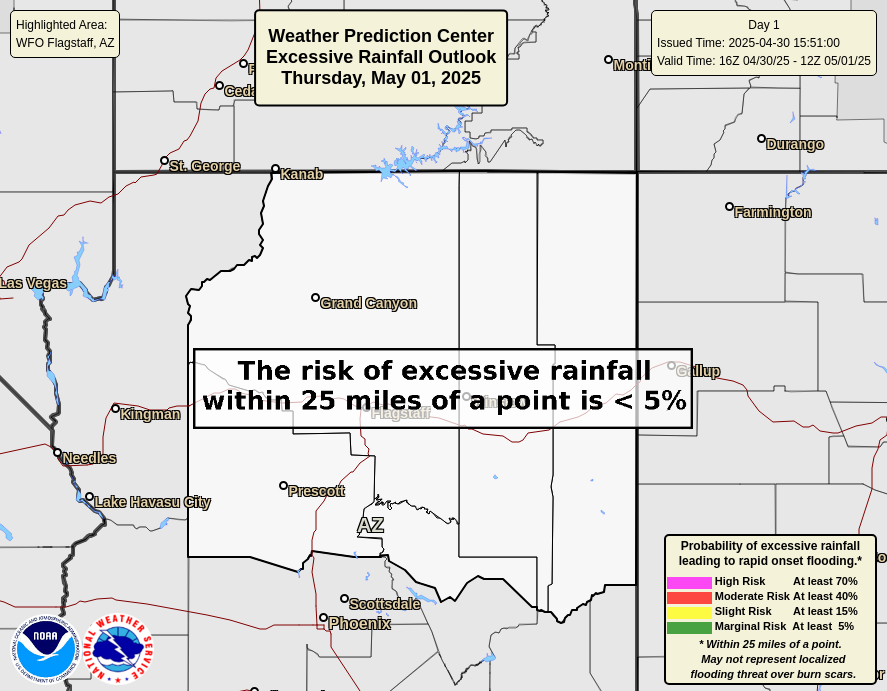
Day 1 |
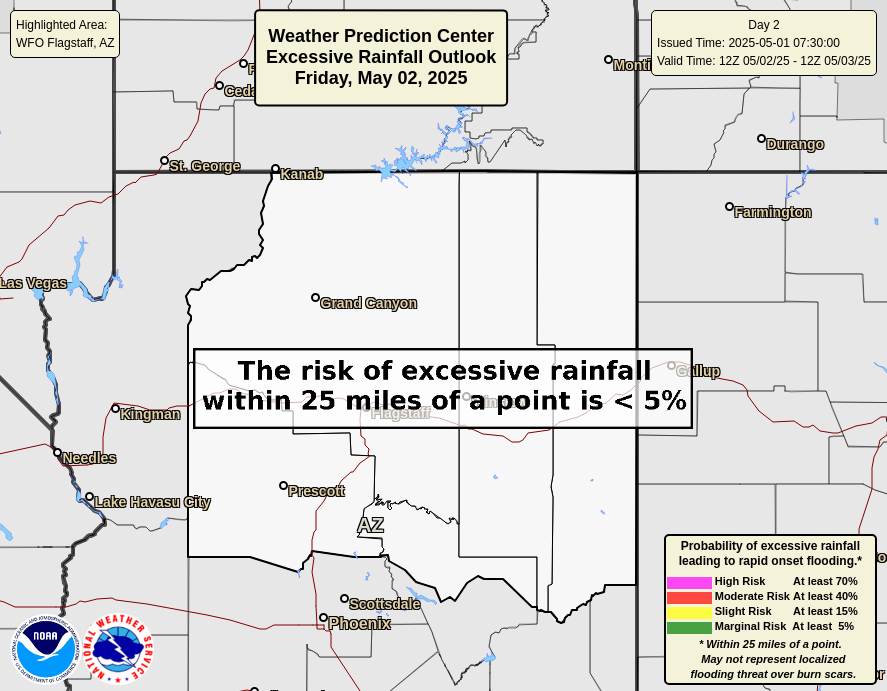
Day 2 |

Day 3 |

Day 1 |

Day 2 |

Day 3 |
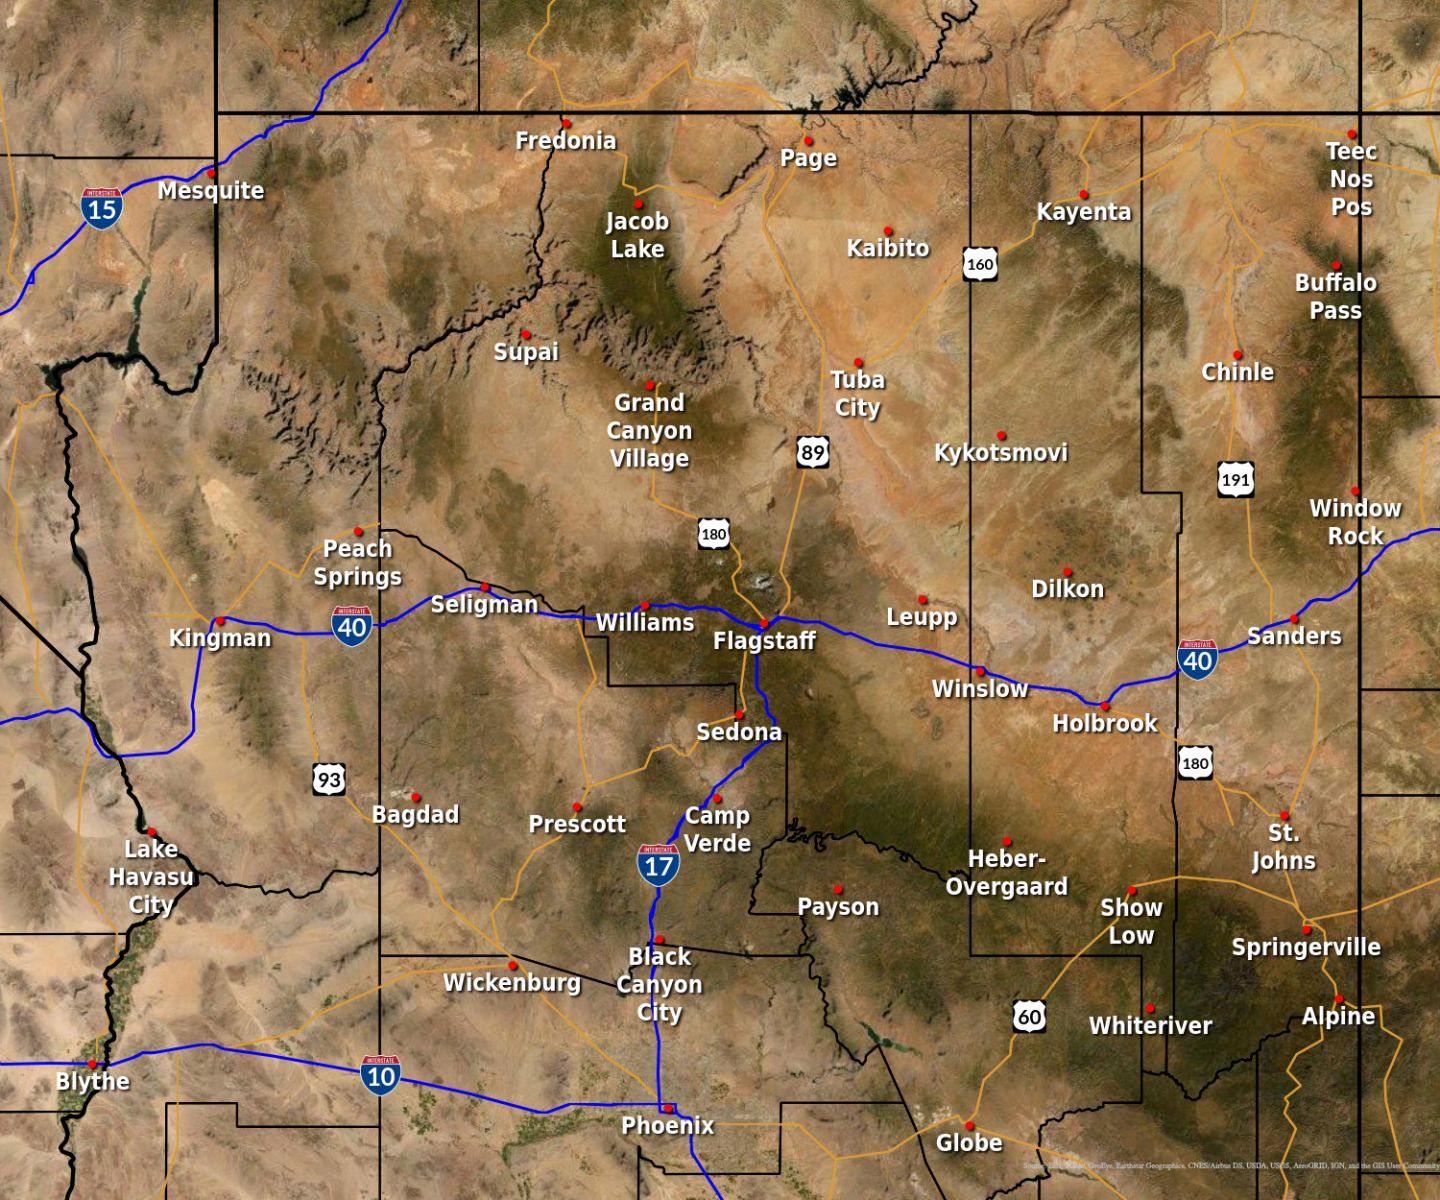
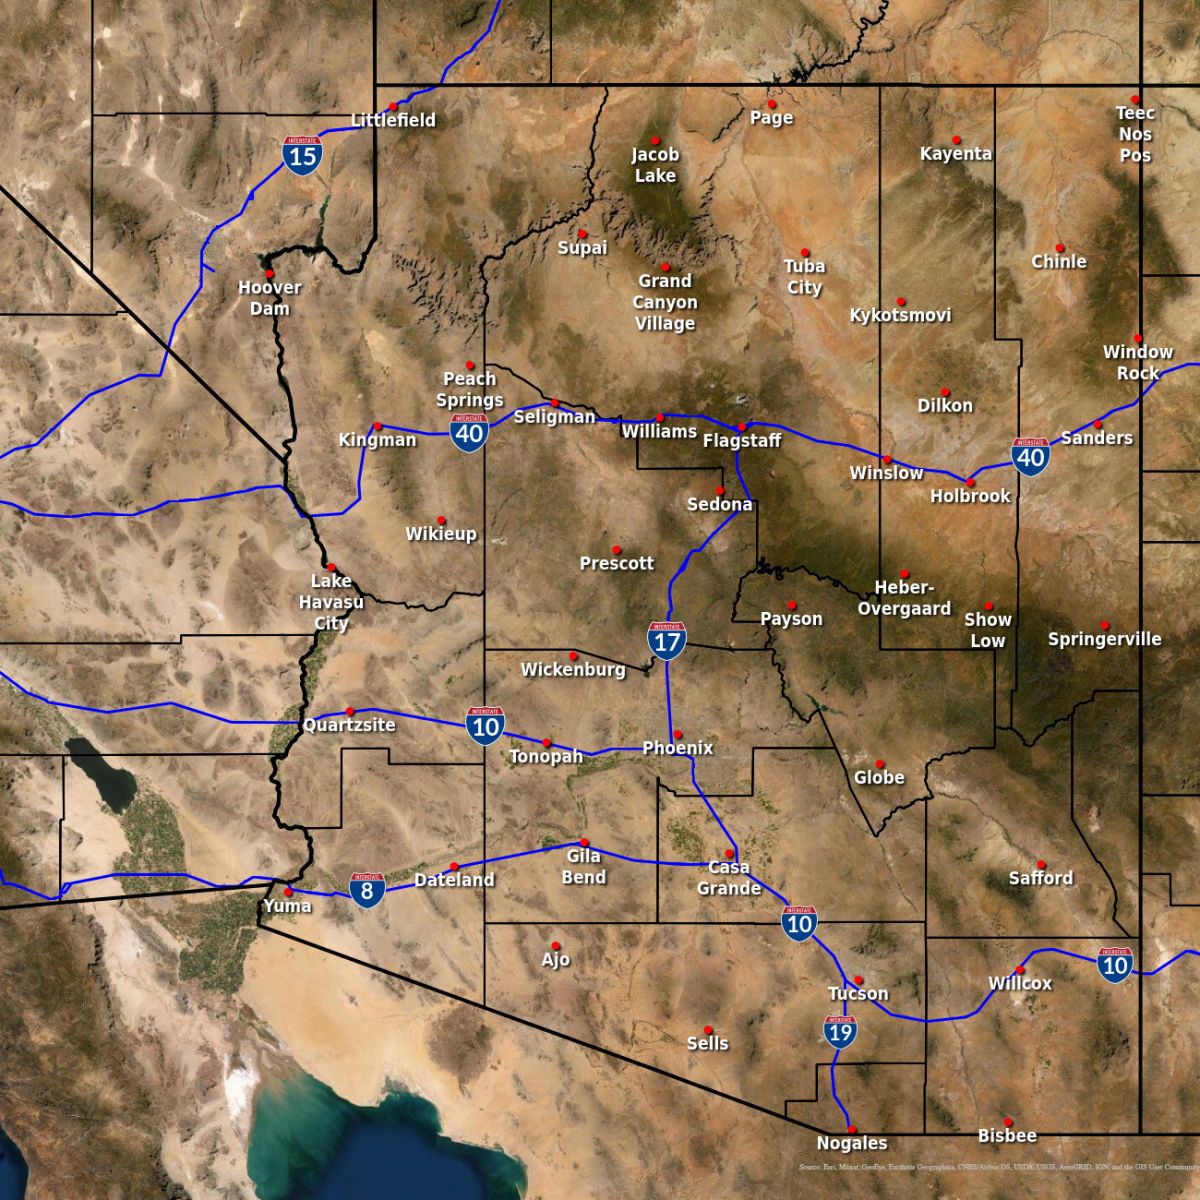
Northern Arizona
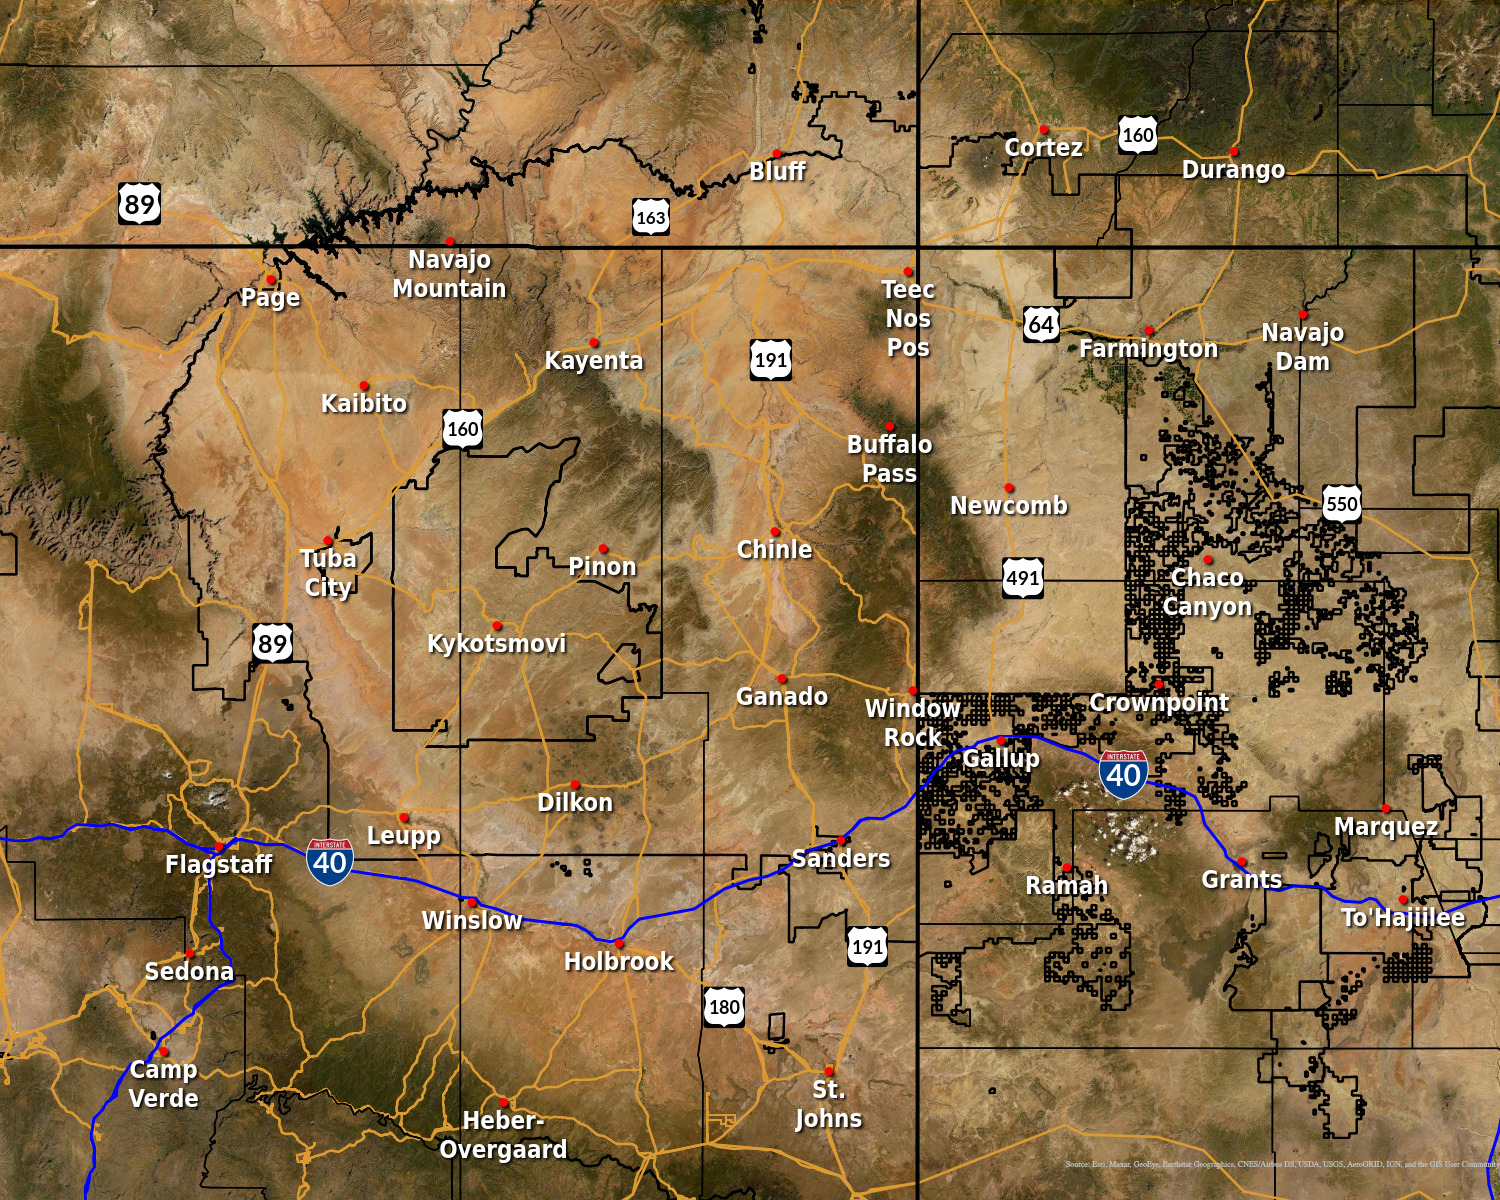
Navajo Nation
State of Arizona
|
Monsoon Information |
Radar |
Satellite |
Forecast Discussion |
Fire Scar Flood Risk |
Recreational Forecasts |

