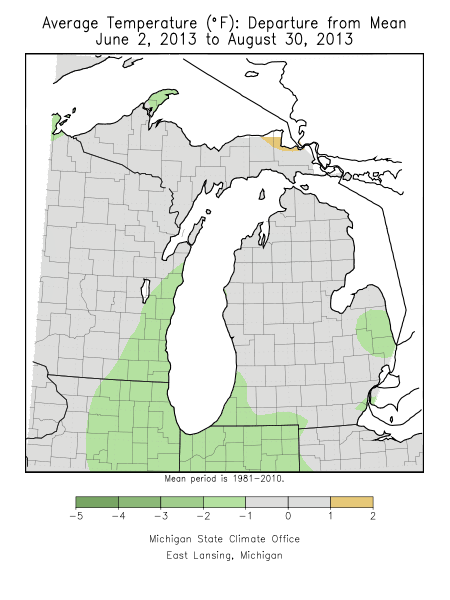
The final statistics are in for the Summer of 2013, and it turns out that this summer was quite the normal one. After a relatively cool start, the bulk of the warmth came in a couple of episodes in mid-to-late July and again in late August, with a cool period in middle during August that featured multiple days of average temperatures around 10 degrees below normal. Nonetheless, despite much talk regarding the "cool" nature of this year's summer, all three Southeast Michigan climate sites finished slightly warmer than normal. So, why did this summer seem to so many to be so cool? Have recent summers just been that hot? See for yourself in the table below. On the right side of the table, you can see how this year's summer ranks compared to the last three summers, all three of which have been among the area's hottest on record.
Average temperature and comparison to recent years
| Summer 2013 | Average Temperature (Departure from Normal) | Summer Normal* | Summer 2013 | Summer 2012 | Summer 2011 | Summer 2010 |
| Detroit Area | 71.9 (+1.1) | 70.8 | 36th warmest | T-1st | T-5th | T-5th |
| Flint Area | 70.5 (+1.1) | 69.4 | 25th warmest | 13th | T-10th | T-7th |
| Tri-Cities | 69.7 (+0.7) | 69.0 | 36th warmest | T-4th | 11th | T-4th |

Boosted by a wet June during which it received over 6" of rain and over 2" of thunderstorm rainfall on August 29th, Detroit remains one of the wettest locations in all of Michigan this summer. The bulk of the state remains near to slightly above average, with the exception of a region of below normal rainfall in Northern Lower.
| Summer 2013 | Total Rainfall (Departure from Normal) | Normal | Summer 2013 |
| Detroit Area | 16.13" (+6.24") | 9.89" | 3rd wettest |
| Flint Area | 8.83" (-.74") | 9.57" | 45th wettest |
| Tri-Cities | 6.53" (-2.34") | 8.87" | 27th driest |

Last update: September 1, 2013