National Weather Service United States Department of Commerce

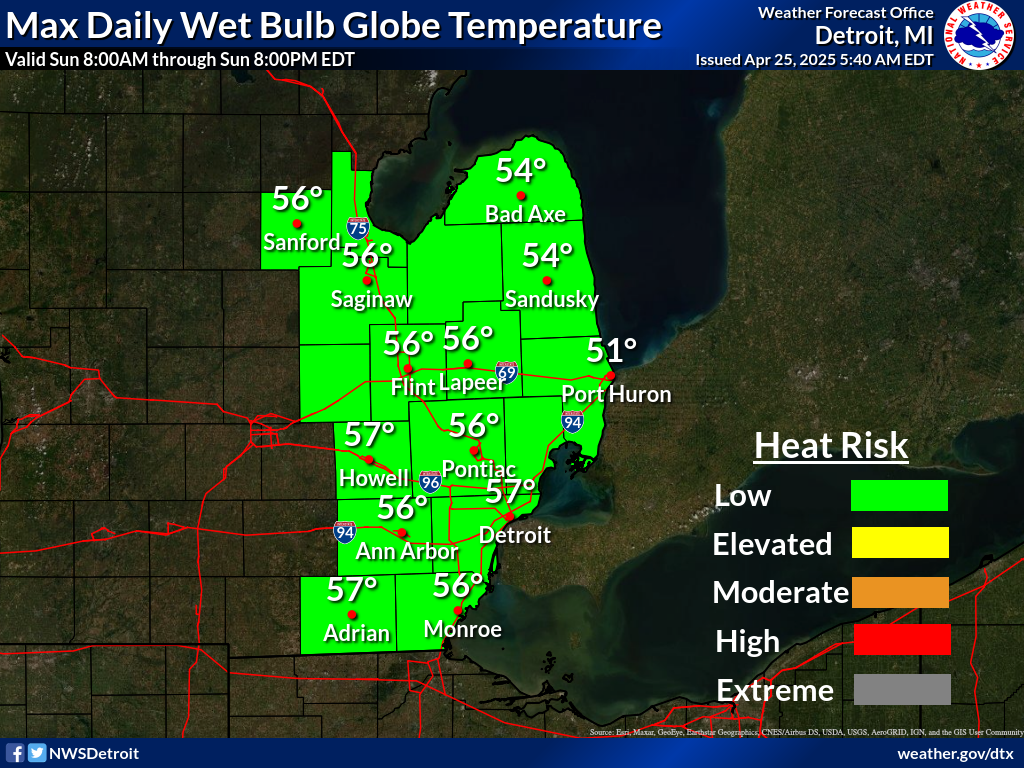
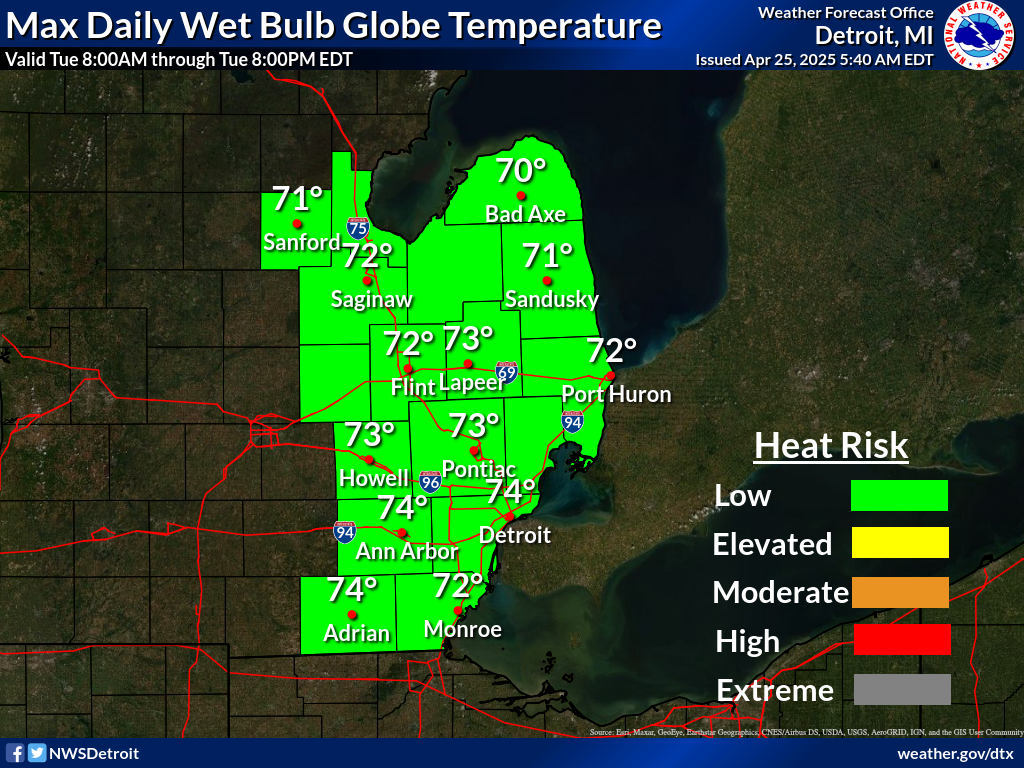
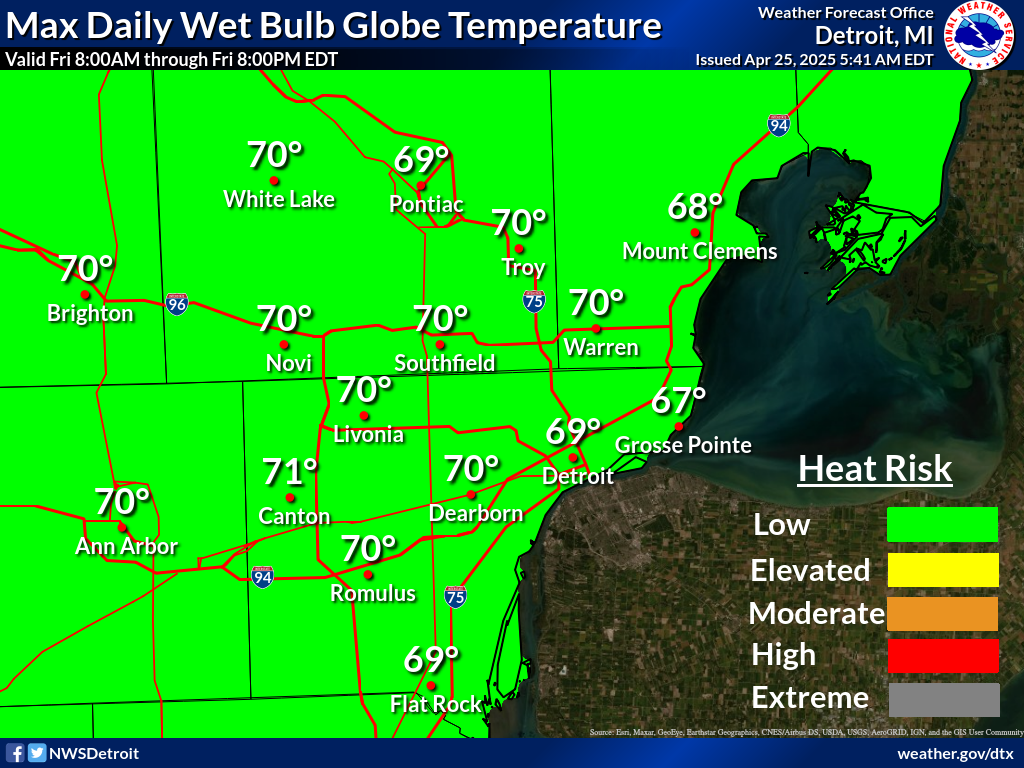
5 Day Forecast of Wet Bulb (Heat Stress) Temperature For Metro Michigan


Global Wet Bulb (Heat Stress) Temperature Forecasts


This series of maps shows the probability (that is, the likelihood) that snowfall will equal or exceed specific amounts during the time period shown on the graphic. These forecasts are based on many computer model simulations of possible snowfall totals.


UPDATES ARE BEING MADE FOR 2025...THIS PAGE MAY OCCASIONALLY CHANGE THROUGH MAY 15, 2025
 
Hover over thumbnails below to scroll through images or click each image to view a larger image.


Day 1 Max WBGT

>=0.1"
>=0.1"


Day 2 Max WBGT

>=1"
>=1"


Day 3 Max WBGT

>=2"
>=2"


Day 4 Max WBGT

>=4"
>=4"


Day 5 Max WBGT

>=6"
>=6"


Current City of Detroit Observation (Updated Hourly)


Latest 48 Hour Forecast For The City of Detroit

for a more detailed forecast click here


Hazards


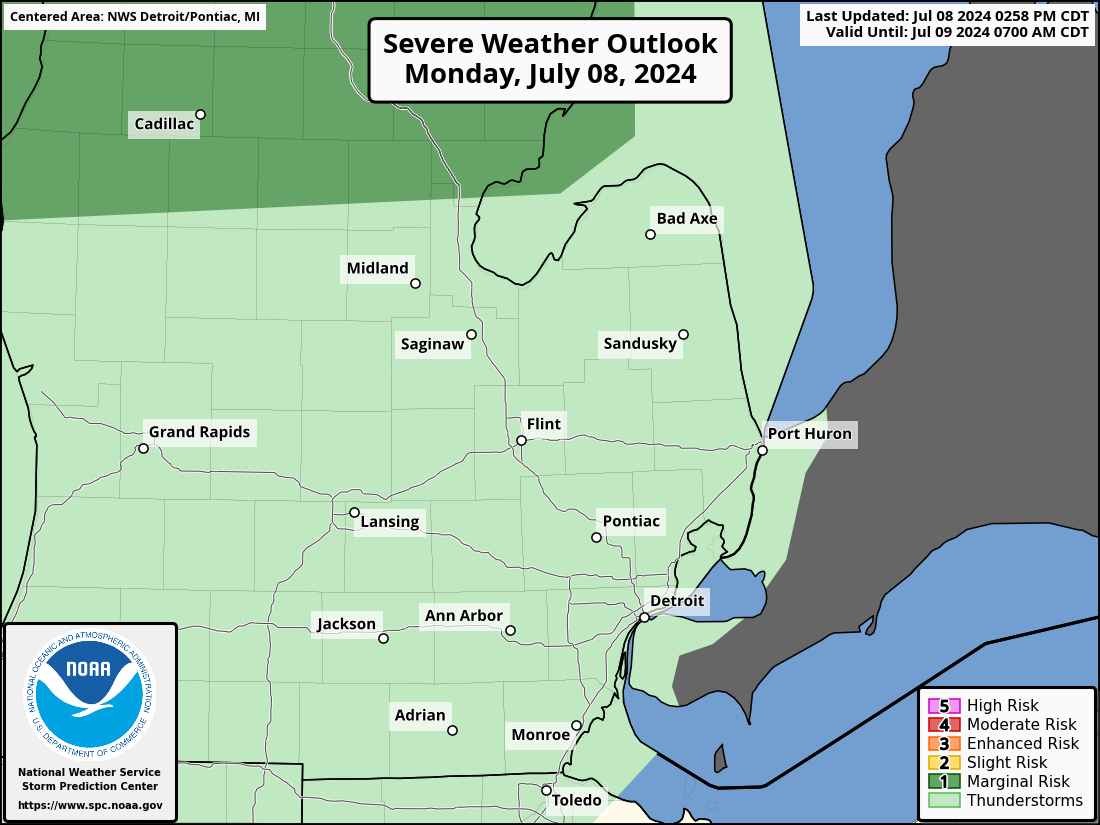
This section highlights additional weather hazards that may lead to widespread power outages, further increasing the impacts of heat-related stress illnesses.


Additional weather information (including if heat headlines are in effect) can be found via the latest Weather Story


Hover over thumbnails below to scroll through images or click each image to view a larger image.


Today's Severe Weather Risk

>=0.1"
>=0.1"


Tomorrow's Severe Weather Risk

>=1"
>=1"


Day 3 Severe Weather Risk

>=2"
>=2"

Long Range Heat Forecasts - Temperature Outlooks


Experimental Probabilistic Heat Index Guidance Days 5-7

 
Hover over thumbnails below to scroll through images or click each image to view a larger image.


Day 5 Chance of Heat Index Values of at Least 95 F

>=0.1"
>=0.1"


Day 6 Chance of Heat Index Values of at Least 95 F

>=1"
>=1"


Day 5 Chance of Heat Index Values of at Least 100 F

>=2"
>=2"


Day 6 Chance of Heat Index Values of at Least 100 F

>=4"
>=4"


Day 7 Potential Max Heat Index Values 

>=6"
>=6"

Additional probabilistic heat index guidance can be found here

 Climate Prediction Center Guidance

(NOTE: the guidance below is meant for planning purposes only)

 
Hover over thumbnails below to scroll through images or click each image to view a larger image.


Next Week's Risk of Hazardous Temperatures Days

>=0.1"
>=0.1"


Weeks 3-4 Temperature Outlook

>=1"
>=1"

Heat.gov Portal


Heat.gov is the web portal for the National Integrated Heat Health Information System (NIHHIS)


Heat.gov Information (click here)

Week-2 Global Probabilistic Extremes Forecast Tool (click here)

Info on Urban Heat Islands (click here)


Additional Resources


Experimental NWS HeatRisk

The NWS HeatRisk is an experimental color-numeric-based index that provides a forecast risk of heat-related impacts to occur over a 24-hour period.

For more information, (click here)


Heat Definitions

Heat Wave: At least 3 consecutive days with high temperatures of at least 90 degrees.

Heat Index: An estimate of how it feels when air temperature and humidity are combined.

Heat Advisory: Issued when the heat index is forecast to approach or reach 100 degrees F for 3 hours or more. Color coding is llll

Excessive Heat Warning: Issued when the heat index is forecast to approach or exceed 105 degrees F for 3 hours or more. Color coding is llll

NOTE: Often times, NWS Detroit will be more willing to consider heat headlines as other heat stress indicators are taken into consideration.


HeatHeat Safety (click here)

Red Cross Information (click here)

Frequently Asked Questions About Extreme Heat (click here)