National Weather Service United States Department of Commerce


Commemoration
     Ceremony Events
The Tornado
     Aftermath
     Survivor Stories
     Video Footage
     Beecher Tornado           Facts
Advancements
     Meteorology
     Radar
     NOAA Weather
        Radio
     What If?
Tornado Information
     Southeast MI
       Climatology
     Tornado Safety


Introduction


One of the nation's most devastating natural disasters occurred in the Flint, Michigan's Beecher district on Monday, June 8th, 1953, resulting in 116 deaths and injuring 844. To date, this F5 intensity tornado was the last one in the United States to result in over 100 fatalities. In a 2000 National Weather Service poll, both the general public, and area "weather experts" voted the Flint-Beecher Tornado as the worst natural disaster in the state of Michigan in the 20th century.

The year 1953 was also one of the nation's worst tornado years. Earlier that in the spring, a tornado ripped through Waco, TX, killing 114 and injuring 597. And the day following the Flint-Beecher tornado, the same storm system spawned a F4 Tornado in Worcester, Massachusetts that killed 90 people and injured over 1288. In fact, on May 21, 1953, an F4 intensity tornado roared through St. Clair County and the Port Huron area, killing 2 and injuring 68.


Background


Photograph of the F4 tornado near Erie, Michigan. June 8th, 1953. Besides the Flint-Beecher tornado, several other tornadoes occurred in Michigan and Ohio late on the afternoon of June 8th (Figure 1). An F4 intensity tornado touched down near Temperance, moved east through Erie, and then traveled 44 minutes as a waterspout over Lake Erie, one of the longest waterspout tracks on record. Another tornado touched down in southwestern Washtenaw County and tracked several miles before dissipating just south of the Ann Arbor- Ypsilanti area. Yet another tornado touched down just northeast of Brighton in Livingston County and moved northeast across GM Proving Grounds into the Milford area. In all, 8 tornadoes were reported in Michigan that day resulting in 125 deaths and 925 injuries.

Map showing the paths of the multiple tornadoes which occured on June 8th, 1953. The system that spawned these tornadoes was a classic severe weather producer in terms of its meteorological characteristics - and was very recognizable by forecasters of the day. Even in that early age of weather forecasting, when forecast accuracy was as much "miss" as "hit", the weather forecasts were astounding in their accuracy.

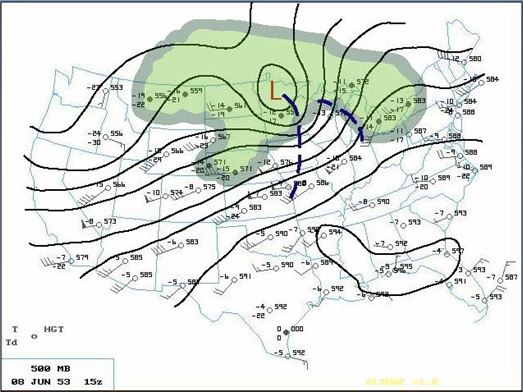
The forecast on the front page of the afternoon edition of the Flint Journal trumpeted "strong thunderstorms with hail and gusty winds over 50 mph" for the coming evening. Figure 2 shows the Weather Bureau Severe Storms Unit (precursor of today's NWS Storm Prediction Center) Severe Weather Bulletin #27 issued at approximately 730 pm the evening of June 8th - an hour prior to the Flint-Beecher tornado. The blue scalloped area denotes the expected severe thunderstorm threat, and the solid red area denotes the expected tornado threat. Even though it was not a perfect forecast, it was certainly a remarkable forecast given the total lack of today's satellite data, radar data, and computer processing.


Map Features


The upper air observations taken at 10 am on the morning of June 8th show the classic features of the event. At 500 mb (Figure 3), a closed upper low was in position just northwest of Michigan with strong winds in excess of 50 knots poised to move over southern lower Michigan during the subsequent afternoon and evening hours. The 500 mb trough axis had a decided "negative-tilt" yielding a broad area of divergence over the Great Lakes region.

At 700 mb (Figure 4), a large area of dry air in the middle troposphere was advancing over the southern Great Lakes, along with an area of strong winds approaching 50 knots. Also, temperatures at this level were at or above 11C south of the Great Lakes, strongly hinting at the likelihood of a mid-tropospheric capping inversion over the Ohio Valley that would prevent the initiation of thunderstorms significantly south of Michigan.

At 850 mb (Figure 5), a great deal of warm, moist air was moving into southern Michigan behind a lower atmospheric warm front and ahead of a lower atmospheric "dry-line" over the Mississippi Valley region. Temperatures at this level were approaching 19-20C with dewpoint likely reaching 14C. This would result in fairly steep late afternoon lapse rates between 850 and 500 mb (near 30C), and a Total Totals Index near 54, certainly supportive of strong thunderstorm potential.

In fact, the 4 pm radiosonde observation taken at Mt. Clemens, MI, after being modified for expected late afternoon temperatures and dew points (Figure 6) - yielded a convective available potential energy (CAPE) estimate through the troposphere of 4500 Joules per Kilogram.

The surface map at 130 pm that afternoon (Figure 7) showed strong lower pressure for early June over the Minnesota "arrowhead" region, with a warm front south of the Great Lakes, and an occluded front immediately west of Lake Michigan. By late afternoon, the warm front had moved quickly into southern lower Michigan, allowing temperatures to climb to near 80F and dewpoints to in excess of 70F.

Not only were the thermal and moisture profiles in the region conducive to strong, severe thunderstorms, but the wind profiles were suggestive of tornado-producing "supercell" thunderstorms. Winds in excess of 50 knots in the 700-500 mb layer were indicative of strong, deep shear through the lower troposphere (0-3 km Storm Relative Helicities ~300 m2/s2 and 0-6 km cumulative shear ~55 m/s) - and supportive of supercell thunderstorm formation. And, meanwhile, the presence of the warm front in southeast lower Michigan added a "veering" with height aspect to the winds in the lowest 1 to 3 thousand feet of the atmosphere, adding to the tornado potential that evening. By 130 am that night, the surface map (Figure 8) showed a cold front exiting southeast lower Michigan, essentially bringing an end to the severe weather threat.


Similarity with July 2, 1997 Outbreak


Radar image from July 2, 1997, showing a series of supercell thunderstorms ahead of a cold front in eastern lower Michigan. The supercell over Tuscola County at this time is producing a tornado in northern Genesee County near Clio, MI. Weather data in 1953 was certainly quite sketchy for forecast and post-mortem purposes. Yet we can draw many comparisons to a similar tornado outbreak that occurred on July 2, 1997. On that day, a F3 intensity tornado occurred along a track just a few miles north of the 1953 Flint-Beecher tornado track. The similarities between the two cases are hard to ignore. On the morning of July 2, a strong 500 mb low (Figure 9) was present over Minnesota with strong winds in excess of 50 knots just upstream over Wisconsin and Illinois. There was also plenty of mid-tropospheric dry air moving into the Great Lakes region at 700 mb (Figure 10), along with relatively warm temperatures at that level south of Michigan - thus suggesting a capping inversion to limit thunderstorm activity over Ohio and points south. At the surface (Figure 11), a low was also over northern Minnesota with a warm front moving northward through lower Michigan and an advancing cold front just west of Lake Michigan. Estimated CAPE values in this particular case were just shy of 4000 joules/kg over southern lower Michigan.

Using this case as an analog, we can perhaps have an idea of how the June 8, 1953 tornado outbreak may have appeared on radar and satellite. Figure 12 shows a water vapor image from 445 pm on July 2, 1997, showing thunderstorms occurring over southern lower Michigan, a significant amount of dry air to the immediate west, and a large upper level circulation over northern Minnesota. Radar imagery (Animation 1 and Figure 13) from 445 pm shows a series of supercell thunderstorms lined up ahead of a cold front in eastern lower Michigan. The supercell centered over Tuscola County at this time is producing a tornado in northern Genesee County near Clio, MI and is the "right-moving" storm following a storm split an hour earlier. The "left-moving" storm in this split is apparent over Saginaw Bay in this image. There is evidence that such a split may have occurred in the June 8, 1953 event as well.

Radar image from July 2, 1997, showing a series of supercell thunderstorms ahead of a cold front in eastern lower Michigan. The supercell over Tuscola County at this time is producing a tornado in northern Genesee County near Clio, MI.
Click on image to view the full Flash animation (805 kb)


Modern Retrospective of June 8, 1953


3 dimensional cloud/precipitation visualization, view from the 
southeast. Idealized simulation from the 2100 UTC June 8, 1953 
sounding at Mount Clemens, Michigan.
Technology advances have afforded us a means of peering into the inner workings of the atmosphere through the use of complex mathematical models. These models can depict, and to a certain degree predict, many aspects of atmospheric behavior. To investigate the thunderstorm development that resulted in the violent tornado outbreak across southeast Michigan on June 8, 1953, we have used a highly sophisticated model (the Weather Research and Forecasting model- WRF) to recreate, in an idealized manner, the events of that day. From this model depiction, we can gain a sense of the storm structure and evolution through the use of radar-like depictions and even three-dimensional graphical renderings.

 
3 dimensional cloud/precipitation visualization, view from the southeast. Idealized simulation from the 2100 UTC June 8, 1953 sounding at Mount Clemens, Michigan.
Click on image to view the full Flash animation (228 kb)

Pseudo-radar reflectivity at 2500 feet AGL. Idealized simulation from the 
2100 UTC June 8, 1953 sounding at Mount Clemens, Michigan.
Animation 2 demonstrates what the low-level (near ground height) radar reflectivity may have looked like shortly after the development of strong to severe thunderstorms and continuing through the mature phases of thunderstorm complex. A distinct cell split occurs, with the southern storm becoming a strong supercell. The simulation shows a developing "hook"-type echo structure with the southern storm along with the formation of strong outflow boundaries from both storms. This storm split is even more evident in Animation 3, which depicts what the mid-levels of the storm may have looked like from a radar perspective. Each storm has a deep strong "reflectivity" core indicating the presence of an intense updraft structure.


(Caption: Pseudo-radar reflectivity at 2500 feet AGL. Idealized simulation from the 2100 UTC June 8, 1953 sounding at Mount Clemens, Michigan.)

3 dimensional cloud/precipitation visualization, top view. Idealized 
simulation from the 2100 UTC June 8, 1953 sounding at Mount Clemens, 
Michigan.
Animation 4 is the top view of a 3 dimensional graphical rendering of the cloud water/ice associated with the storms. The overshooting tops associated with deep convective updrafts can be seen with both storms along with the formation of a well developed anvil structure and outflow induced cloud bands. Animation 5 is a 3 dimensional view of the storms' cloud field from the southeast. The simulation certainly depicts a well developed supercell complex capable of producing prolific severe weather.


(Caption: 3 dimensional cloud/precipitation visualization, top view. Idealized simulation from the 2100 UTC June 8, 1953 sounding at Mount Clemens, Michigan.)