
Heat expands across the Desert Southwest, Plains, Mississippi Valley and Midwest into Monday. Fire weather concerns continue for portions of the Intermountain West. Active monsoonal moisture fuels thunderstorms over the Southwest with possible flash flooding. Tropical cyclone Fausto in the Pacific, should weaken as it approaches Hawaii; Dangerous surf, swells and rip currents are expected. Read More >
Winter 2017-2018 Outlook for the Northland
(meteorological winter defined as December, January, and February)
|
|||||||||
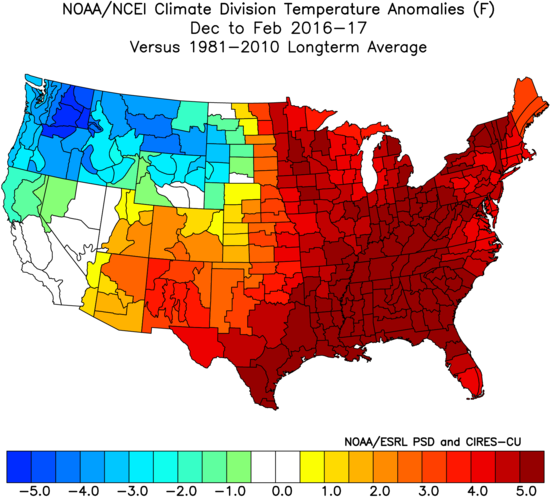
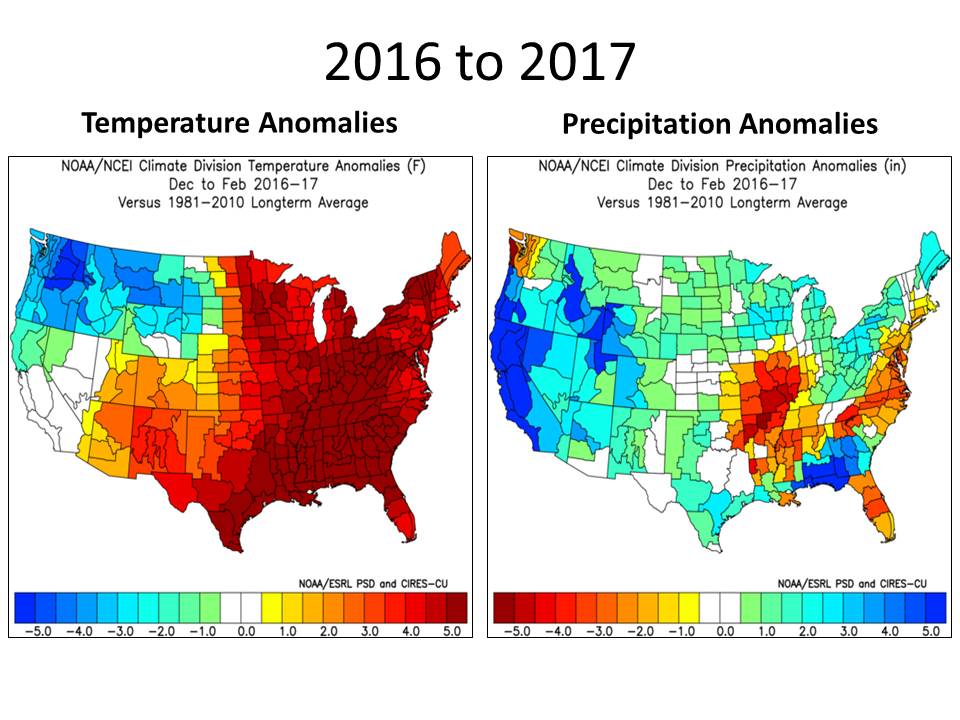
| Looking back at the 2016-2017 winter | |||||||||||||||||||||||||||||||||||||||||||||||||||||||||
| Temperature Anomalies | Precipitation Anomalies | ||||||||||||||||||||||||||||||||||||||||||||||||||||||||
 |
 |
||||||||||||||||||||||||||||||||||||||||||||||||||||||||
|
Last winter we had a weak La Niña. This brought the Northland, and the majority of the lower 48, temperatures that were above normal. Much of the Northland saw above normal precipitation.
Duluth saw its 14th warmest winter season on record last year with an average temperature of 18.1 degrees, which was 4.6 degrees above the normal of 13.3 degrees. A total of 5.03 inches of precipitation was recorded for the season, which was 2.05 inches above the normal of 2.98 inches. This made it the 13th wettest winter season on record for Duluth. 50.9 inches of snow fell through the season, which was 1.4 inches above the normal of 49.5 inches. International Falls saw its 11th warmest winter season on record last year with an average temperature of 13.0 degrees, which was 4.9 degrees above the normal of 8.1 degrees. A total of 4.94 inches of precipitation was recorded for the season, which was 2.94 inches above the normal of 2.00 inches. This made it the wettest winter season on record for International Falls. 54.9 inches of snow fell for the season, which was 14.1 inches above the normal of 40.8 inches. This made it the 11th snowiest winter season on record. Brainerd saw its 11th warmest winter season on record last year with an average temperature of 17.0 degrees, which was 2.6 degrees above the normal of 14.4 degrees. A total of 3.62 inches of precipitation was recorded for the season, which was 1.37 inches above the normal of 2.25 inches. This made it the 5th wettest winter season on record for Brainerd. 28.6 inches of snow fell through the season, which was 2.4 inches above the normal of 26.2 inches. Hibbing saw its 17th warmest winter season on record last year with an average temperature of 13.0 degrees, which was 3.0 degrees above the normal of 10.0 degrees. Ashland saw its 9th warmest winter season on record last year with an average temperature of 20.7 degrees, which was 4.2 degrees above the normal of 16.5 degrees. |
|||||||||||||||||||||||||||||||||||||||||||||||||||||||||
| Current El Niño/La Niña Conditions | |
.anom.month.gif) |
|
|
Current and Forecast El Nino/La Nina Conditions:
|
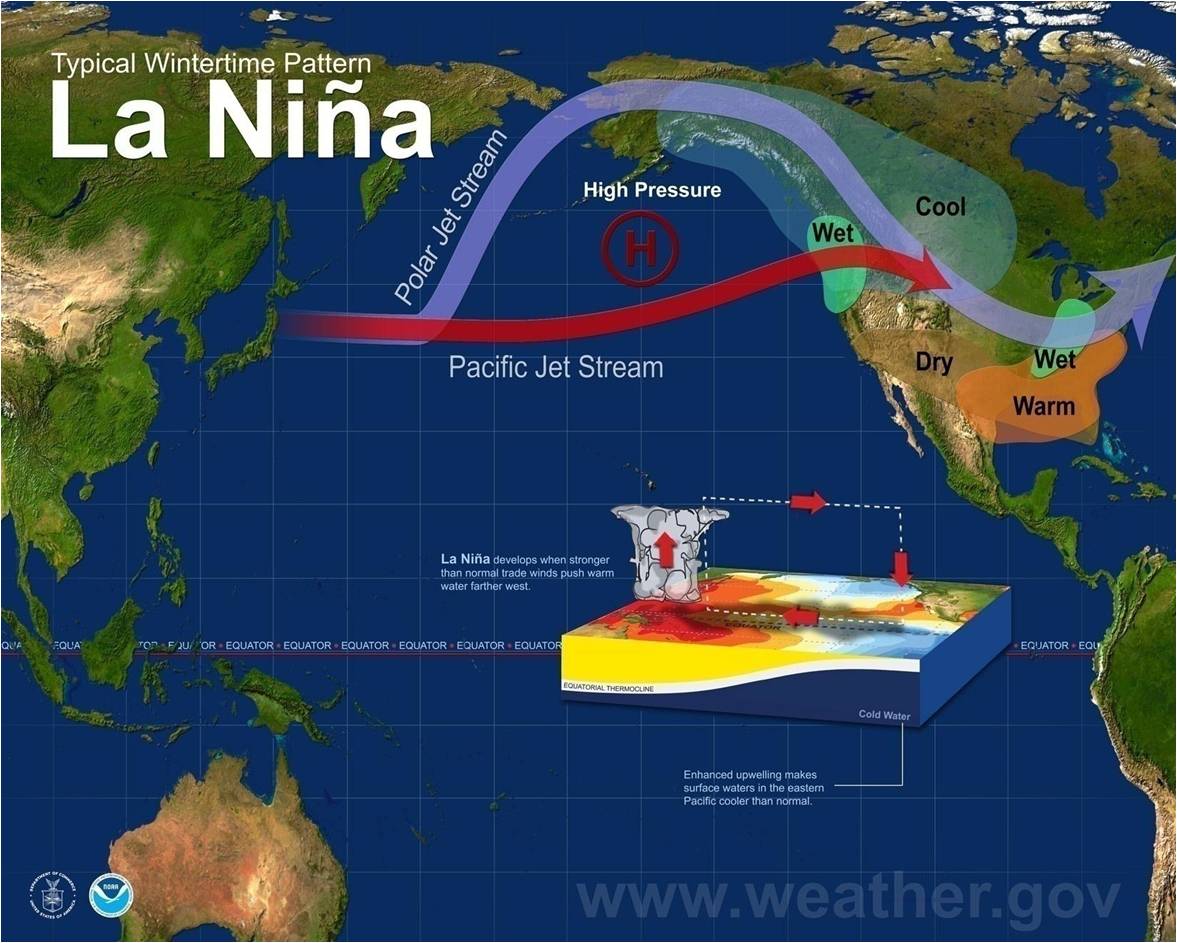
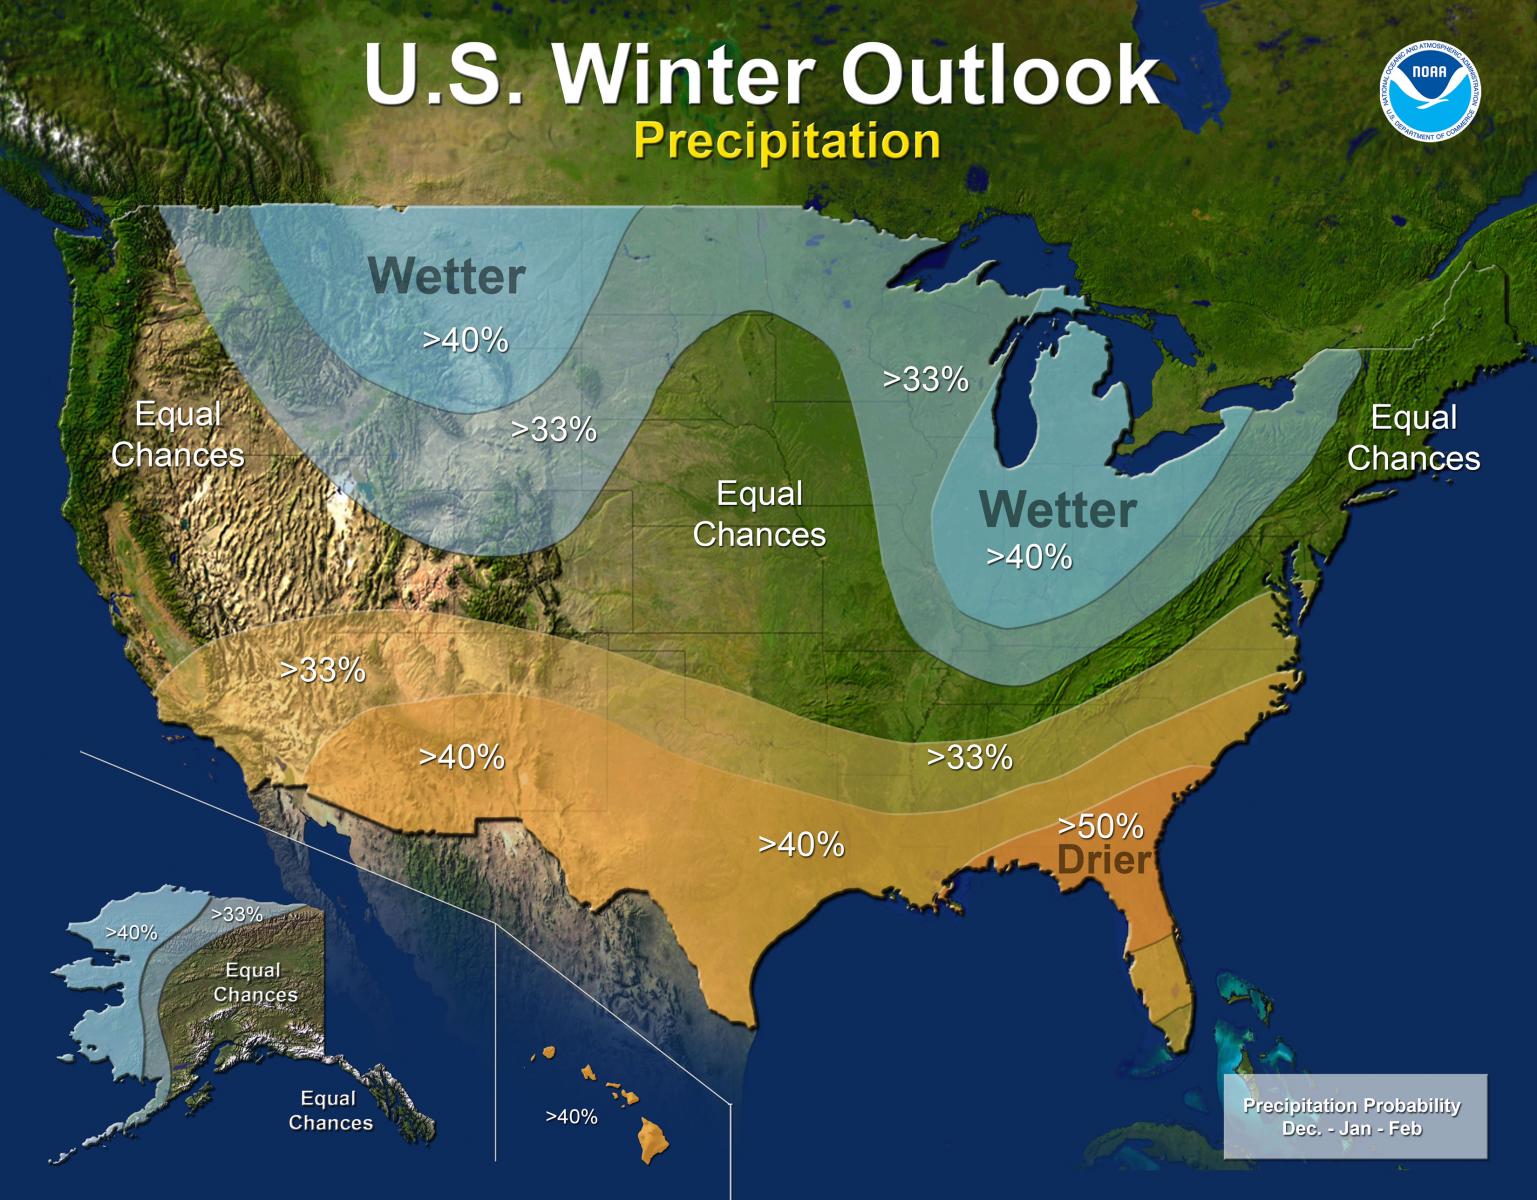
| Typical wintertime La Niña Impacts |
 |
|
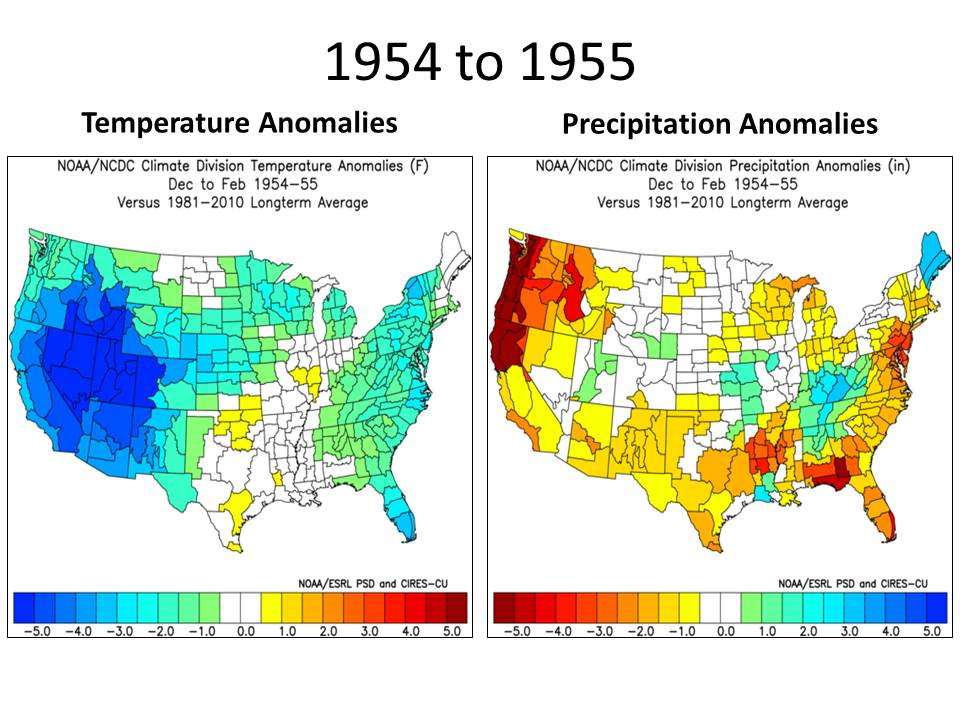
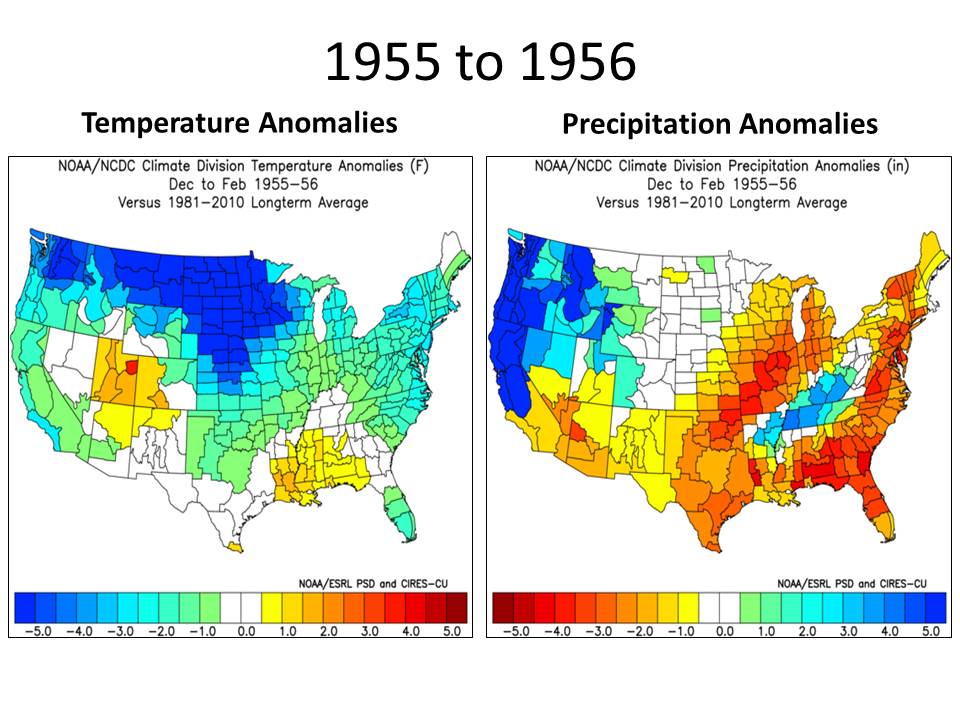
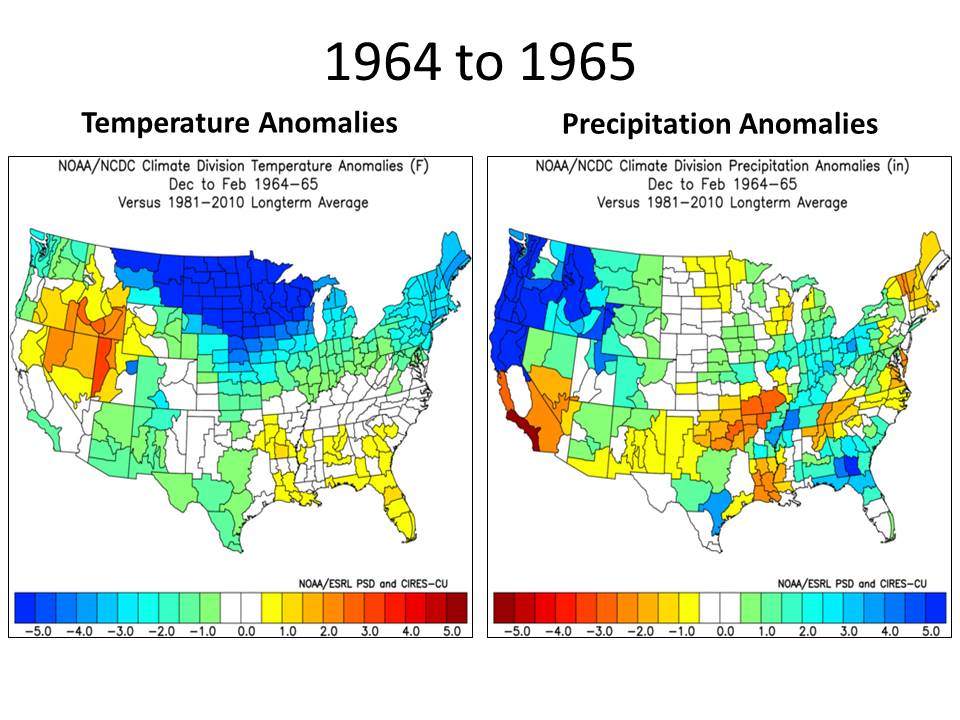
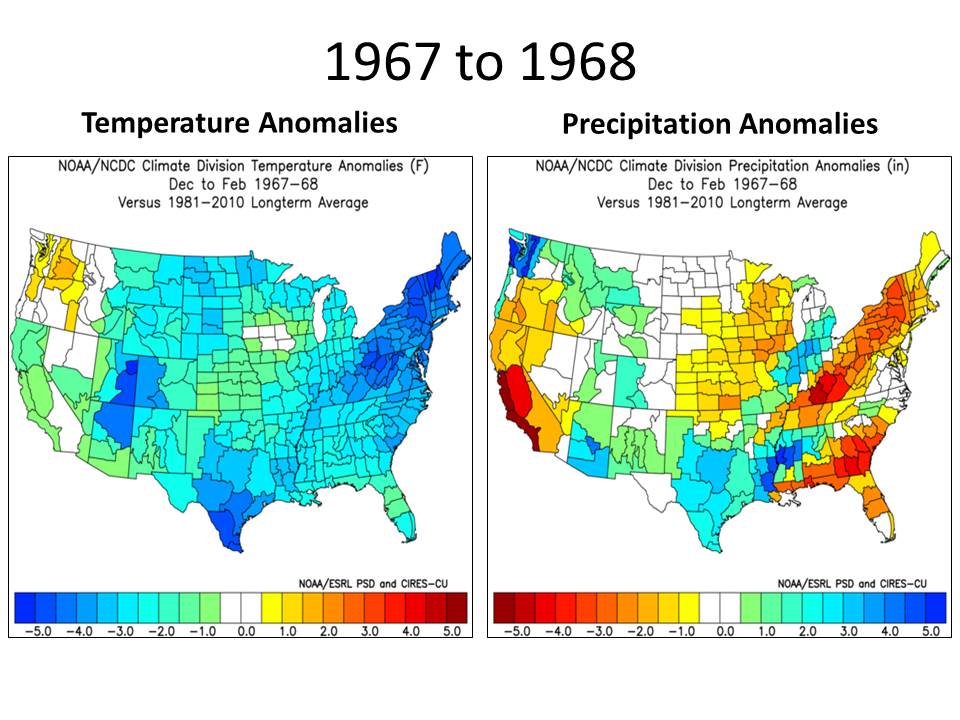
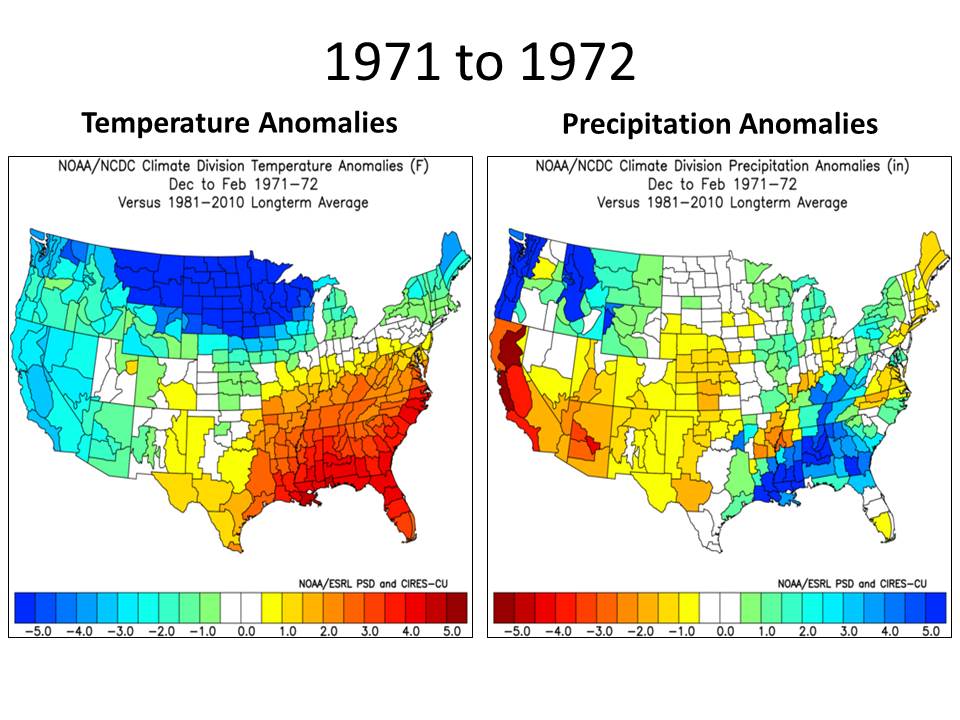
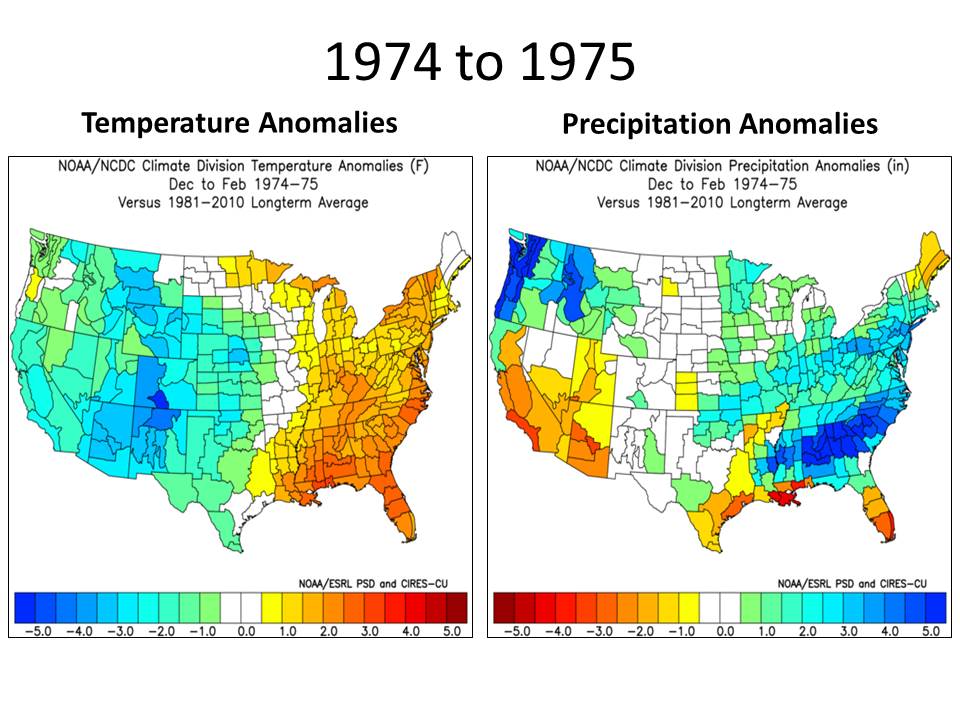
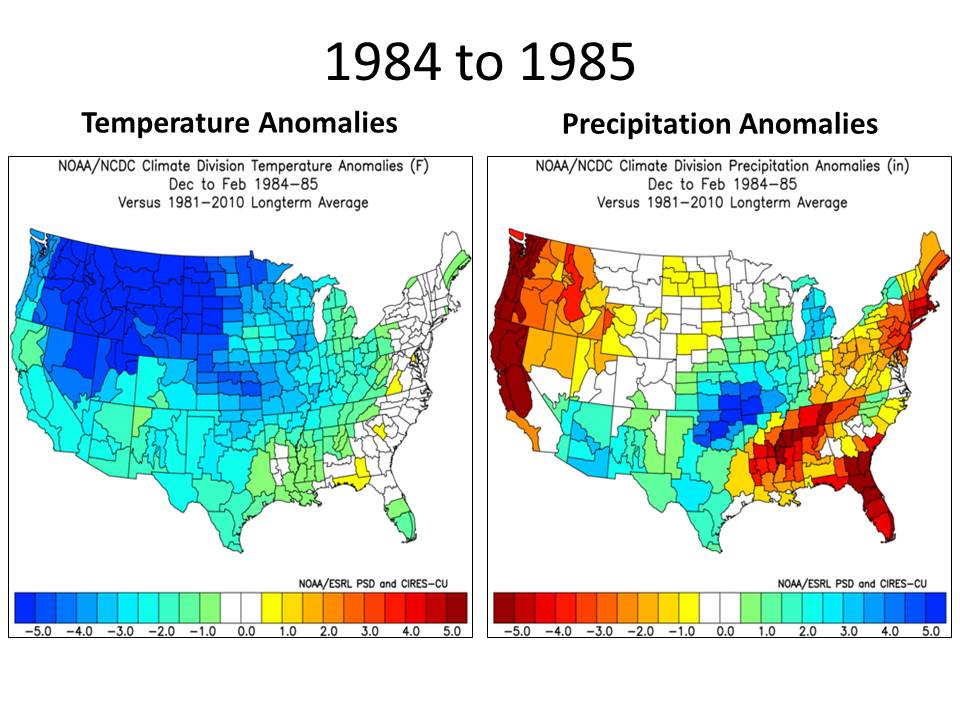
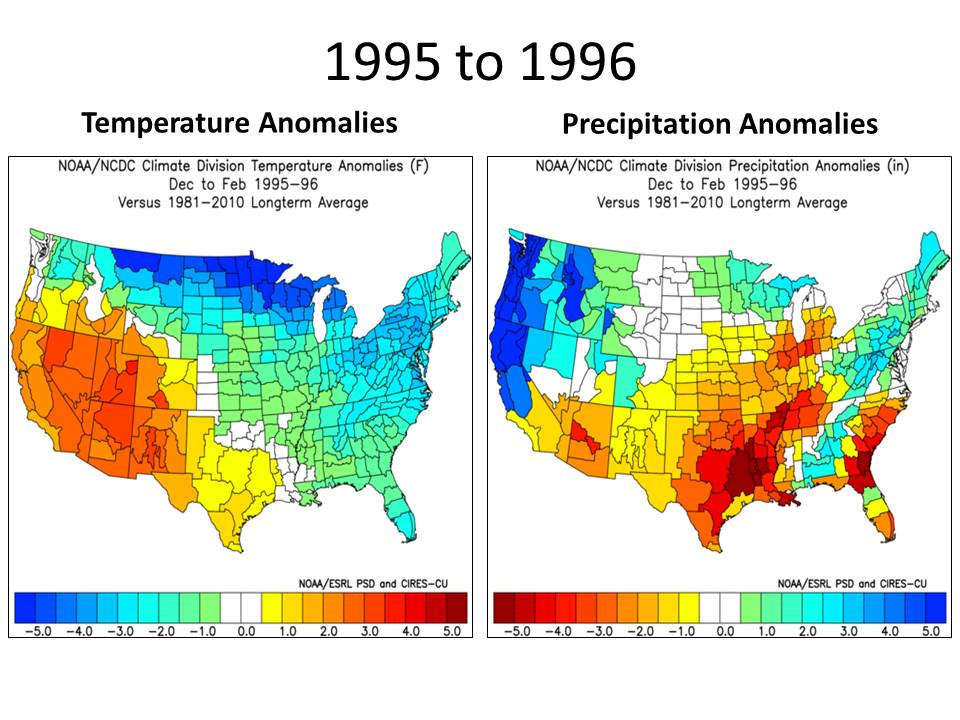
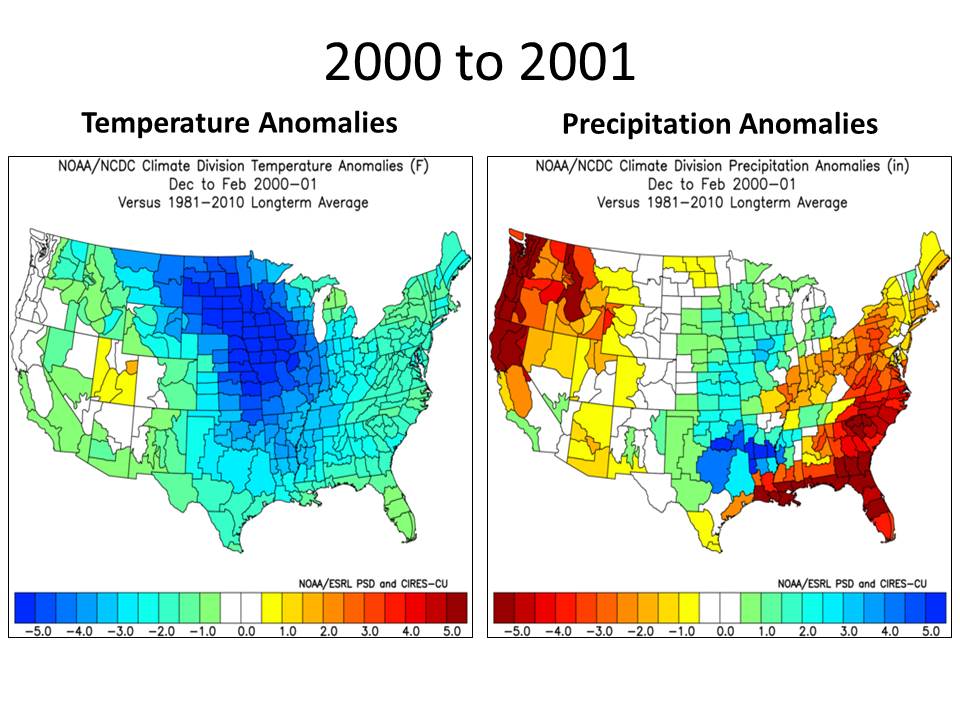
| Past weak La Niña winters | |||||||||||||||||||||||||||||||||||||||||||||||||||||||||||||||||||||||||||||||||||||||||||||||||||||||||||||||||||||||||||||||||||||||||||||||||||||||||||||||||||||||||||||||||||||||||||||||||||||||||||||||||||||||||||||||||||||||||||||||||||||||||||||||||||||||||||||||||||
| Composite Temperature Anomalies | Composite Precipitation Anomalies | ||||||||||||||||||||||||||||||||||||||||||||||||||||||||||||||||||||||||||||||||||||||||||||||||||||||||||||||||||||||||||||||||||||||||||||||||||||||||||||||||||||||||||||||||||||||||||||||||||||||||||||||||||||||||||||||||||||||||||||||||||||||||||||||||||||||||||||||||||
.png) |
.png) |
||||||||||||||||||||||||||||||||||||||||||||||||||||||||||||||||||||||||||||||||||||||||||||||||||||||||||||||||||||||||||||||||||||||||||||||||||||||||||||||||||||||||||||||||||||||||||||||||||||||||||||||||||||||||||||||||||||||||||||||||||||||||||||||||||||||||||||||||||
|
There have been 12 winters since 1950 where weak La Niña conditions have been observed. The images above are a composite of all the weak La Niña winter seasons.
On the table above, values in red are observed temperatures above normal, while values in blue are observed temperatures below normal.
On the table above, values in brown are observed precipitation below normal, while values in green are observed precipitation above normal.
On the table above, values in brown are observed snowfall below normal, while values in green are observed snowfall above normal. Highlights:
|
|||||||||||||||||||||||||||||||||||||||||||||||||||||||||||||||||||||||||||||||||||||||||||||||||||||||||||||||||||||||||||||||||||||||||||||||||||||||||||||||||||||||||||||||||||||||||||||||||||||||||||||||||||||||||||||||||||||||||||||||||||||||||||||||||||||||||||||||||||


