Overview
An extratropical cyclone of rare intensity impacted parts of Northeast Minnesota and Northwest Wisconsin on October 26-27, 2010. While the storm traveled directly across the Northland, it impacted the weather conditions across a large portion of North America.Summary
 |
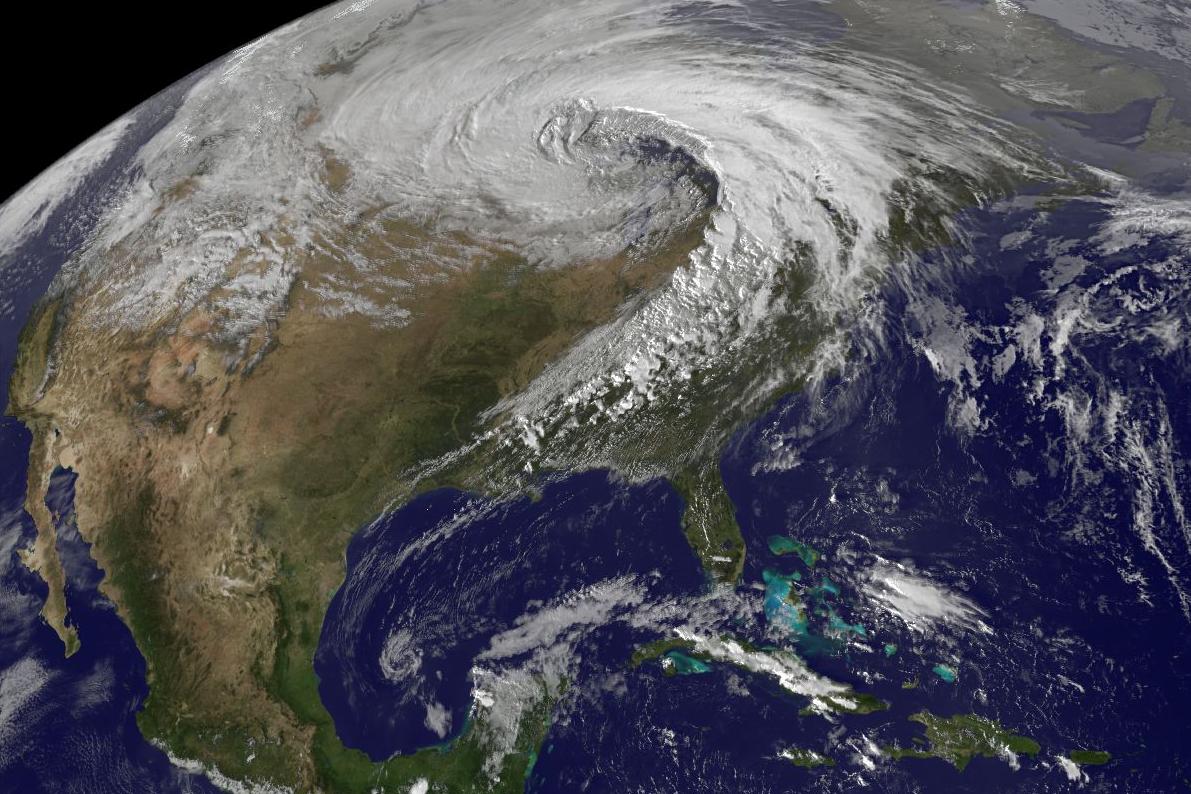 |
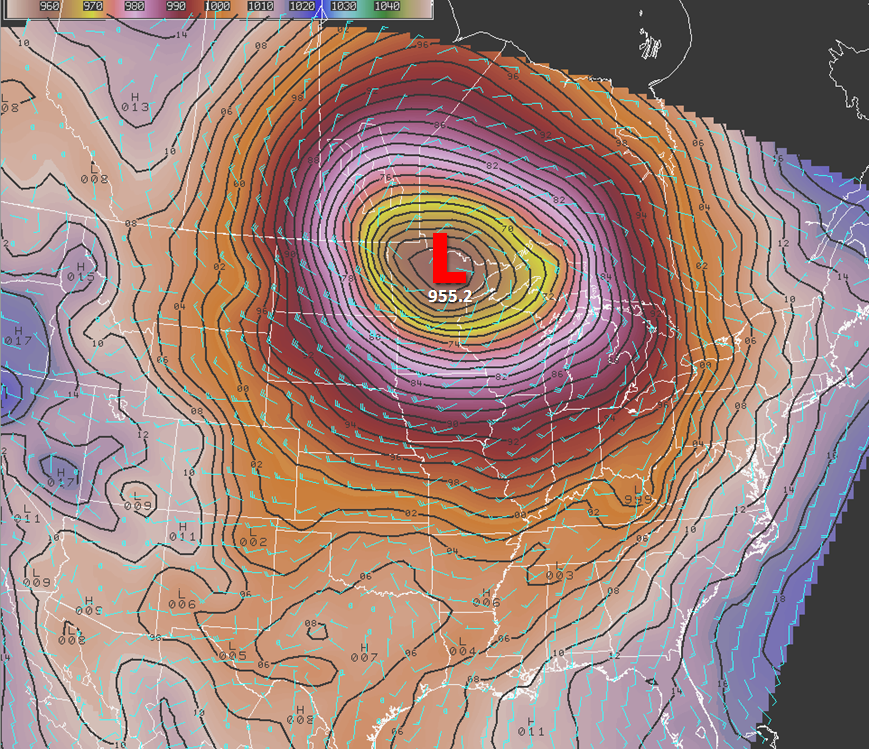
In the left hand image above, you can see that the low, while centered in northern Minnesota, was powerful and large enough to affect the wind field from Hudson Bay south to the Gulf Coast, and from the Rocky Mountains east to the Atlantic Coast. Wind barbs are in light blue, and sea level pressure contours are in black. The image above and to the right is a satellite image from the NOAA-NASA GOES Project at 4:32 PM CDT on October 26. The MODIS true-color images from NASA's "Blue Marble" global map are used as a background, projected as though viewed from the GOES satellite location. Semi-transparent layers of GOES infrared and visible images are enhanced and layered on top of that color background.
The cyclone reached its peak intensity (as discerned by pressure readings) over the NWS Duluth county warning area. The automated weather observing system at Bigfork, Minnesota (KFOZ) reached a 955.2 millibar (28.21 inches of mercury) sea level pressure at 5:13 pm CDT on October 26, 2010. This established a new low pressure record for the state of Minnesota.
In the Northland area, this storm had a wide variety of impacts. A lot of precipitation fell across the region, and in our area the highest total through the morning of October 27th was 5.50" of liquid precipitation 7 miles northwest of Two Harbors, MN (Lake County). Some of that precipitation changed over to snow on the evening of October 26th, and a band of generally 2 to 6 inches of snow developed from Fort Ripley, through the Brainerd area, up towards southern St. Louis County, and along the north shore of Lake Superior to near Tofte. Isolated totals of up to 9 inches were reported just northwest of Duluth.
The winds to the south of the low were extremely strong, and in places gusted to over 50 mph. The highest gust that we had in our area was 65 mph on the Blatnik Bridge that connects Superior and Duluth. Some of the winds caused damage around the area, mainly by knocking down trees and power lines. The winds were also strong out over the lake. A ship reported 61 mph winds in the open waters of western Lake Superior. Just east of Grand Portage, the Rock of Ages observation on Isle Royale, Michigan recorded a sustained 68 mph wind at 3 AM October 27th, with gusts to 78 mph. The very strong winds over the lake helped to generate large waves. The western mid-lake buoy on Lake Superior reported significant wave heights up to 18.7 feet. The significant wave heights in the far northern part of the lake (out of our area) were 26.6 feet at the Canadian NOMAD buoy.
Regional and National Scale Impacts
Above: A regional impacts graphic from the storm on October 26-27, 2010. Smoothing and estimation used in the creation of certain parts of the graphic.
Winds are created by differences in atmospheric pressure. As a low rapidly intensifies, the pressure gradient around that low will often increase - and thus the difference in pressure between the center of the low and a given point some distance away will increase. Such was the case on October 26th as a low deepened over the state of Minnesota. The pressure gradient became quite strong from the northern High Plains into the central Great Lakes. Plotted in the map above in red are peak non-thunderstorm wind gusts from this storm. The highest wind gust that we could locate was a 79 mph wind gust in Sherwood, Wisconsin - near Lake Winnebago.
Due to the low pressure system, wind gusts of at least 58 mph (equivalent to a severe thunderstorm) were observed from far northeast Montana, through the Dakotas, into the Upper Mississippi River Valley, and then into both peninsulas of Michigan. These gusty winds caused damage across the region - primarily by blowing down trees, power lines, and a few power poles. In some isolated instances, there was some structural damage with roofs damaged and small towers toppled. On some highways, semi-trailers and other high profile vehicles were blown off the road. Power outages were reported across parts of the region mentioned above.
The winds whipped up some very large waves on the Great Lakes, with buoys reporting at least 10 foot waves on most of Lake Huron, Lake Superior, and Lake Michigan at some point during the event. The highest observed significant wave heights were 27 feet in the northern part of Lake Superior. To put it in perspective, this would be roughly the height of a two story house, give or take a few feet.
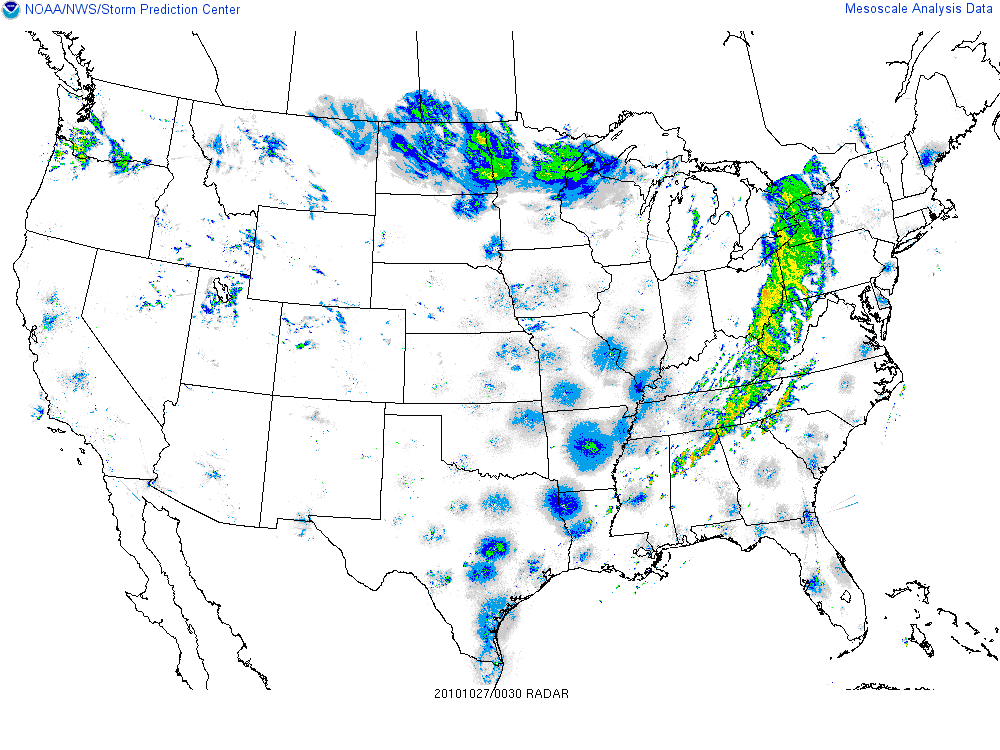
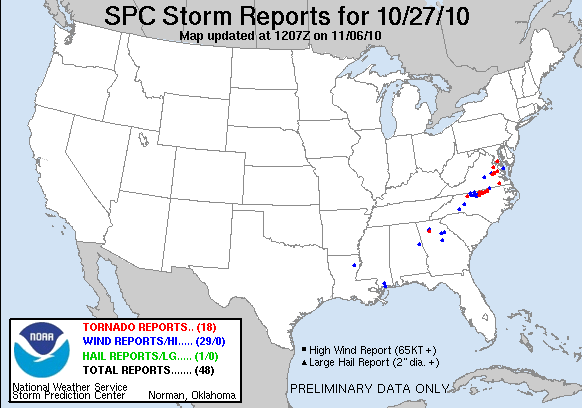
Further south, widespread thunderstorm activity resulted in severe weather. The first round was with a squall line that started to take shape from far southeast Kansas into northeast Oklahoma around 11 PM on October 25th. The squall line eventually expanded north, and raced east, and produced widespread wind damage from southern and eastern Missouri to the Appalachian Mountains of western Pennsylvania and West Virginia. Later in the day, additional thunderstorms developed even further to the south along the cold front and produced severe weather as far south as central Mississippi and central Alabama. In total, 557 preliminary severe weather reports were logged on the Storm Prediction Center website with the thunderstorms that occurred along the cold front associated with this low pressure system (Oct 25-27).
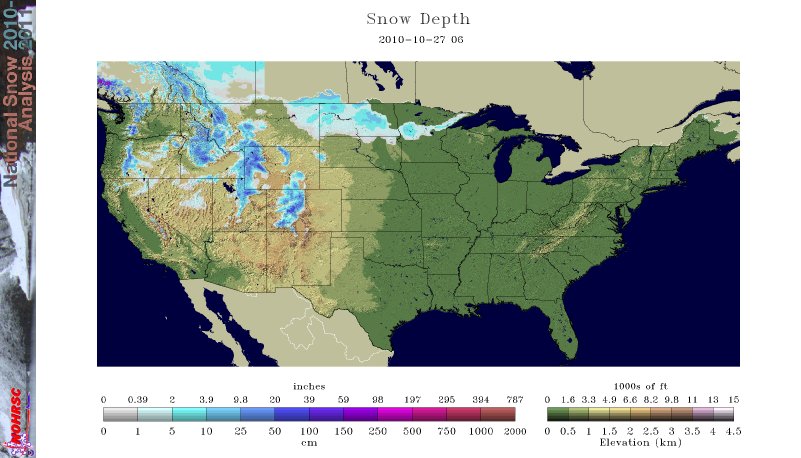
There was a band of accumulating snow that developed from eastern Montana, into North Dakota, and into parts of central and northeast Minnesota. The orientation of the accumulating snow was a bit unusual in that it occurred generally to the south and even southeast of the low. For most winter storms, the accumulating snow will fall "to the left" of the low track or generally to the north or northwest. This low was powerful enough to pull warmer air around the north and northwest sides of the low, and cold air around the south side of the low. Snow amounts were largely under 6 inches, and measuring was difficult in many areas with strong winds. The areas of heaviest snow (6 to 9 inches), excluding the Rocky Mountains, were northwest of Duluth near Twig and in parts of northern North Dakota. Parts of North Dakota were also under Blizzard Warnings during this storm.
Finally, there was a large amount of liquid precipitation that fell as a result of this storm. Liquid equivalent precipitation of nearly 5 inches occurred in parts of Northeast Minnesota, as quite a bit of rain preceded the snow band that developed later. Rain gauge adjusted radar estimates (courtesy NMQ site: National Mosaic and Multisensor QPE) of precipitation in the 72 hours between 7am CDT October 25 and 7am CDT October 27 are available in this graphic. Much of the country east of the Mississippi River received at least 1/2" of rain. The heaviest totals were from eastern North Dakota into northern Minnesota and parts of Wisconsin and Michigan where heavy rain persisted the longest. Also, there was a secondary area of heavy rain from southern Arkansas into eastern Tennessee where training thunderstorms developed for a time.
Snowfall
Snow started occurring on the evening of October 26th as strong cold air advection helped bring surface temperatures into the lower 30s in an area curving from the Brainerd Lakes up towards Duluth, and along the north shore of Lake Superior into southern Lake County. The heaviest snow with this storm fell in a relatively concentrated area from near Cloquet and Esko, northeast through Duluth, Hermantown, and surrounding communities, and towards Two Harbors. This was due in part to a relatively persistent band of heavier snow that set up late in the evening, around Midnight. To the left is a radar image from 12:04 AM CDT on October 27th.
The snowfall at Duluth was the 4th greatest storm total snowfall in October at Duluth on record. The greatest was on October 23-25, 1933, when 11.5 inches of snow fell.
When combined with strong, gusty winds, the snow reduced visibilities to around or just under one half mile. The location of the heaviest snowfall was a bit unusual as it fell to the south or southeast of the center of the low, which is not typical in most winter storms.
Here is a snowfall map for the NWS Duluth county warning area, created using GIS software:
Here is a listing of snowfall reports received through midday on October 27th. Therefore, the time that is listed by each report is from October 27.
| Snow (in) | Location | ST | County | Time |
| 9.0 | 2 SW Twig | MN | St. Louis | 640 AM |
| 8.0 | 2 SE Twig | MN | St. Louis | 1034 AM |
| 8.0 | 1 N Adolph | MN | St. Louis | 700 AM |
| 7.7 | 3 NE Hermantown | MN | St. Louis | 100 PM |
| 7.1 | 8 E Fredenberg | MN | St. Louis | 900 AM |
| 7.1 | 7 NW Two Harbors | MN | Lake | 752 AM |
| 7.0 | 4 S Sawyer | MN | Carlton | 1230 PM |
| 6.0 | Saginaw | MN | St. Louis | 931 AM |
| 6.0 | 12 NNW Hermantown | MN | St. Louis | 840 AM |
| 5.0 | 4 WNW Cloquet | MN | Carlton | 726 AM |
| 5.0 | 5 NW Two Harbors | MN | Lake | 530 AM |
| 4.8 | 2 WNW Duluth | MN | St. Louis | 800 AM |
| 4.5 | Leader | MN | Cass | 926 AM |
| 4.5 | Sawyer | MN | Carlton | 605 AM |
| 4.0 | 2 E Floodwood | MN | St. Louis | 800 AM |
| 4.0 | Floodwood | MN | St. Louis | 800 AM |
| 4.0 | Saginaw | MN | St. Louis | 630 AM |
| 3.8 | 3 NE Brainerd | MN | Crow Wing | 630 AM |
| 3.0 | 5 W Two Harbors | MN | Lake | 800 AM |
| 2.0 | Culver | MN | St. Louis | 605 AM |
| 1.5 | 14 W Isabella | MN | Lake | 900 AM |
| 1.0 | Moose Lake | MN | Carlton | 750 AM |
| 1.0 | Butternut | WI | Ashland | 600 AM |
| 0.8 | Wrenshall | MN | Carlton | 800 AM |
| 0.5 | 5 N Grand Marais | MN | Cook | 1120 AM |
| 0.2 | Solon Springs | WI | Douglas | 900 AM |
| 0.2 | 4 W Clam Lake | WI | Burnett | 700 AM |
Rainfall
As a consequence of the strength of the low pressure system, and the copious amounts of moisture that pushed north from the Gulf, large amounts of liquid equivalent precipitation fell across the area. Some areas saw over 5 inches of precipitation in only a few days. Below is a map created from primarily co-operative observer precipitation reports, and interpolated and contoured in GIS software. Because of the smoothing, the shaded values may not precisely match the observed values at specific locations.
Finally, here is a table of the precipitation reports that we used when creating the above graphic.
| LOCATION | PRECIP |
| TWO HARBORS 7NW | 5.50 |
| CLOQUET | 5.20 |
| BRUNO | 4.92 |
| COUDERAY | 4.72 |
| ASKOV | 4.68 |
| GORDON | 4.57 |
| ISLE 12N | 4.57 |
| HINCKLEY 3WSW | 4.55 |
| HAWTHORNE DOT | 4.51 |
| DANBURY | 4.50 |
| BRAINERD | 4.33 |
| SILVER BAY | 4.22 |
| WRIGHT | 4.16 |
| BRULE | 4.10 |
| FINLAND | 4.03 |
| MOOSE LAKE | 4.03 |
| SOLON SPRINGS | 4.02 |
| ISLAND LAKE 4E | 3.99 |
| SUPERIOR | 3.98 |
| BEAVER BAY | 3.96 |
| FLOODWOOD | 3.95 |
| DEEP PORTAGE | 3.79 |
| DULUTH AIRPORT | 3.73 |
| SUPERIOR | 3.70 |
| CLAM LAKE 4W | 3.52 |
| AITKIN | 3.51 |
| BRIMSON | 3.51 |
| SPOONER | 3.23 |
| WALKER | 3.19 |
| PINE RIVER DAM | 3.15 |
| WINTER | 3.08 |
| PARK FALLS | 2.93 |
| BAYFIELD FISH HATCHERY | 2.91 |
| SARONA | 2.88 |
| BUTTERNUT | 2.85 |
| GRAND MARAIS | 2.84 |
| BIGFORK 8S | 2.64 |
| MADELINE ISLAND | 2.64 |
| WEBSTER | 2.60 |
| CASS LAKE | 2.58 |
| ASHLAND 3S | 2.57 |
| ASHLAND EAST WWTP | 2.56 |
| GRAND PORTAGE | 2.53 |
| BAYFIELD 8N | 2.50 |
| UPSON | 2.48 |
| NISSWA 3NE | 2.47 |
| GRANTSBURG | 2.45 |
| NORTHOME | 2.45 |
| WASHBURN HWY. DEPT. | 2.42 |
| GRAND RAPIDS | 2.34 |
| HIGHBRIDGE DOT | 2.32 |
| LEECH LAKE DAM | 2.25 |
| TOWER | 2.25 |
| DIXON LAKE | 2.24 |
| POKEGEMA DAM | 2.21 |
| MERCER | 2.18 |
| ORR 3E | 1.74 |
| COOK | 1.73 |
| GURNEY | 1.67 |
| SAXON | 1.62 |
| EMBARRASS | 1.52 |
| HURLEY | 1.43 |
| KABETOGAMA | 1.35 |
| ELY | 1.26 |
| INDUS | 1.25 |
| LITTLEFORK | 1.17 |
Wind Gusts
As the low reached its peak intensity over north central Minnesota late in the day on October 26th, the pressure gradient increased across the southern and eastern parts of our area. Winds are driven by differences in air pressure. Therefore, strong winds - generally from a westerly direction - developed in the afternoon and evening of October 26th. Some of the gusts were very strong. We had 15 different sites report wind gusts in excess of 50 mph. The strongest gust was 65 mph on the Blatnik Bridge that connects Duluth and Superior. It should be noted that the bridge rises about 100 feet above the water, and the increased elevation of the instrument likely contributed to stronger winds at that particular location.
PUBLIC INFORMATION STATEMENT
NATIONAL WEATHER SERVICE DULUTH MN
1125 AM CDT WED OCT 27 2010

...MAXIMUM WIND GUSTS FROM ACROSS THE AREA OCT 26-27...

A VERY POWERFUL LOW AFFECTED THE NORTHLAND ON TUESDAY AND WEDNESDAY
OCTOBER 26-27. THIS LOW HAD A STRONG PRESSURE GRADIENT SURROUNDING
IT AND THIS CONTRIBUTED TO VERY STRONG WIND GUSTS. THERE WERE A FEW
AREAS IN WHICH THE GUSTS GOT STRONG ENOUGH TO CAUSE DAMAGE...NOTABLY
IN COOK COUNTY MINNESOTA AND IN PRICE COUNTY WISCONSIN WHERE TREES
AND POWER LINES WERE DOWNED. IN FACT...BETWEEN MIDNIGHT AND 7 AM
GRAND MARAIS MN WAS MEASURING WIND GUSTS REGULARLY IN EXCESS OF 50
MPH.

ALTHOUGH IT IS NOT EXPLICITLY LISTED BELOW...A SHIP REPORTED A 53
KNOT WIND OVER WESTERN LAKE SUPERIOR. THAT CONVERTS TO 61 MPH.

**NOTE THAT THE BLATNIK BRIDGE OBSERVATION IS ABOUT 100 FEET ABOVE
THE WATER LEVEL...SO THE WINDS ARE LIKELY STRONGER THAN WOULD HAVE
BEEN REPORTED AS A 10 METER WIND AT MOST OBSERVING STATIONS**


...GUST...       ...LOCATION...                 ...TYPE...

GUSTS IN MINNESOTA

 **65 MPH**      BLATNIK BRIDGE                 MN DOT
   60 MPH        SILVER BAY MARINE OB           MARINE
   59 MPH        GRAND MARAIS  /GNA/            ASOS
   54 MPH        MCGRATH                        MN DOT
   54 MPH        PINE CITY                      SCHOOL NET
   52 MPH        GRAND PORTAGE HWY 61           MN DOT
   52 MPH        SKY HARBOR ARPT  /DYT/         AWOS
   52 MPH        PARK POINT                     PRIVATE
   51 MPH        DULUTH MARINE OBSERVATION      MARINE
   51 MPH        EMILY HWY 6                    MN DOT
   49 MPH        DULUTH  /DLH/                  ASOS
   49 MPH        HINCKLEY  /04W/                AWOS
   48 MPH        BRAINERD                       RAWS
   47 MPH        BRAINERD  /BRD/                ASOS
   46 MPH        BREEZY POINT                   PRIVATE
   45 MPH        13 NE DULUTH                   PRIVATE
   45 MPH        TWO HARBORS                    PRIVATE
   44 MPH        KABETOGAMA                     RAWS
   44 MPH        AITKIN  /AIT/                  AWOS
   44 MPH        HERMANTOWN                     PRIVATE
   43 MPH        MCGREGOR  /HZX/                AWOS
   43 MPH        MOOSE LAKE  /MZH/              AWOS
   42 MPH        DULUTH I-35 AND GARFIELD AVE   MN DOT
   42 MPH        HERMANTOWN MIDDLE SCHOOL       SCHOOL NET
   41 MPH        MERRIFIELD                     PRIVATE
   41 MPH        14 NE DULUTH                   PRIVATE
   41 MPH        TWO HARBORS  /TWM/             AWOS
   40 MPH        CLOQUET  /COQ/                 AWOS
   40 MPH        MOOSE LAKE                     RAWS


...GUST...       ...LOCATION...                 ...TYPE...

GUSTS IN WISCONSIN

   61 MPH        DEVILS ISLAND                  CMAN / MARINE
   58 MPH        PHILLIPS  /PBH/                AWOS
   57 MPH        5 SW PHILLIPS                  SPOTTER
   53 MPH        PORT WING                      MARINE
   52 MPH        ASHLAND   /ASX/                ASOS
   51 MPH        13 E PARK FALLS                RAWS
   49 MPH        SIREN  /RZN/                   AWOS
   49 MPH        WASHBURN                       RAWS
   46 MPH        SEELEY                         PRIVATE
   46 MPH        AMNICON HWY 53                 WI DOT
   46 MPH        SUPERIOR  /SUW/                AWOS
   46 MPH        MAPLE                          PRIVATE
   46 MPH        DRUMMOND                       SCHOOL NET
   46 MPH        GLIDDEN                        SCHOOL NET
   45 MPH        SPOONER                        SCHOOL NET
   45 MPH        SAXON HARBOR                   MARINE
   45 MPH        CLAM LAKE                      PRIVATE
   45 MPH        HIGH BRIDGE                    PRIVATE
   44 MPH        HAUGEN HWY 53                  WI DOT
   43 MPH        MINONG                         RAWS
   41 MPH        BARNES                         RAWS
   41 MPH        HAYWARD  /HYR/                 ASOS
   40 MPH        HAYWARD                        RAWS

$$
Photos
 |
 |
 |
 |
 |
 |
 |
 |
 |
 |
Pressure Records
Here's What We Know About The Pressure Records From October 26, 2010.
The low pressure rapidly deepened on October 26, 2010, leading to several pressure records being broken. Here are some facts about those pressure records:
Was This Any Kind Of National Record For Lowest Pressure?
The bottom line is that Bigfork, Minnesota, did not set the CONUS record for lowest extratropical sea level pressure. Here are the details:
How Does This Rank Amongst Storms Away From The US Coasts?
What Should I Take Away From This?
The bottom line is that the storm that struck the Upper Mississippi River Valley on October 26-27, 2010, was a very intense and rare storm, something that is not seen in this part of the country very often. While the minimum sea level pressure may not necessarily be the lowest on record, the storm was undoubtedly one of the most intense on record in the continental United States.
In fact, with the storms on January 3, 1913, and March 7, 1932, tied for first place at 955.0 millibars, the October 26, 2010, storm would be the second lowest recorded sea level pressure at 955.2 millibars. NCDC was also able to confirm a 956.3 millibar reading at Eastport, Maine, on December 16, 1916.
It is also worth noting that lower pressures have likely been attained off the coast of the Pacific Northwest (Oregon and Washington) or perhaps even just off shore of the New England States (Maine, New Hampshire, Massachusetts). However, given that there are very few reliable observing stations offshore, especially dating back many decades, these low pressures may not have been sampled by our observing network.
Caveats About The Pressure Value At Bigfork
Bigfork (KFOZ) is an AWOS (automated weather observing system) station, which is completely automated. Unlike an ASOS (automated surface observing system), an AWOS does not automatically report a sea level pressure value. Therefore, it was necessary for us to calculate the sea level pressure from the reported station pressure. As we continue to evaluate these calculations, the lowest sea level pressure at Bigfork may fluctuate slightly. However, any slight calibrations in the equation and constants that we are using would not allow the Bigfork reading to break any other records.
Pressure Graphs
Here are a few pressure graphs. The procedure was to evaluate the lowest pressure at each individual time in the day across the Upper Midwest, and then to plot the data on a graph to assess the trends in the minimum pressure at the center of the low. The data was adapted from information provided by Daryl Herzmann.
 |
 |
| Fig. 1: Minimum observed sea level pressure on October 26, 2010, across the Upper Midwest. | Fig. 2: As in fig. 1, except the previous Minnesota state low pressure record is annotated in a horizontal red line. |
 |
 |
| Fig. 3: As in fig. 1, except individual sea level pressure values are annotated on the graph. | Fig. 4: As in fig. 1, except with a trend line showing the rapid deepening of the low on October 26th. |
Finally, here is a graph with different sea level pressure trends plotted at different observation sites across the NWS Duluth County Warning Area. The data from Hibbing and Duluth are 1 minute data downloaded from the ASOS.
Environment
National Radar Mosaic from SPC Mesoanalysis
 |
 |
 |
 |
| 7:30 AM CDT Oct 26 | 10:30 AM CDT Oct 26 | 1:30 PM CDT Oct 26 | 3:30 PM CDT Oct 26 |
 |
 |
 |
 |
| 7:30 PM CDT Oct 26 | 10:30 PM CDT Oct 26 | 1:30 AM CDT Oct 27 | 4:30 AM CDT Oct 27 |
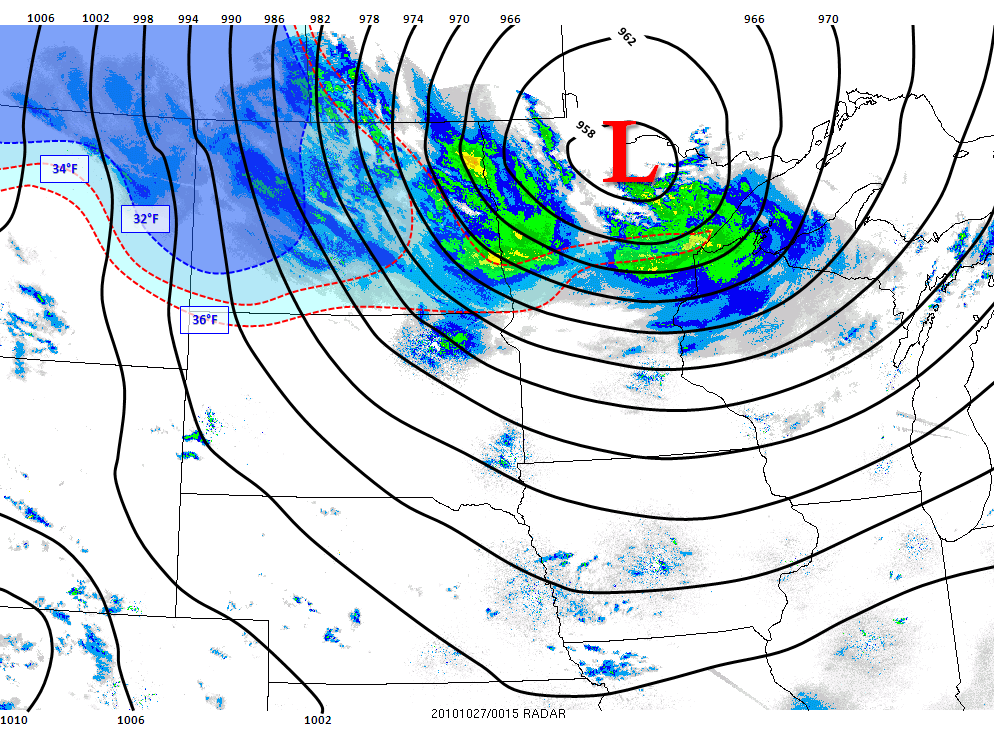
Composite Surface Map: Radar, Temperature (32, 34, and 36F), and Sea Level Pressure
 |
 |
| 7 PM CDT | 10 PM CDT |
These two maps illustrate the rapid cooling of the surface temperatures in the early evening across a narrow area of northern Minnesota. This cooling allowed the precipitation to change over from rain to snow, and the snow rates were heavy enough to allow accumulation to begin with surface temperatures around 33 degrees.
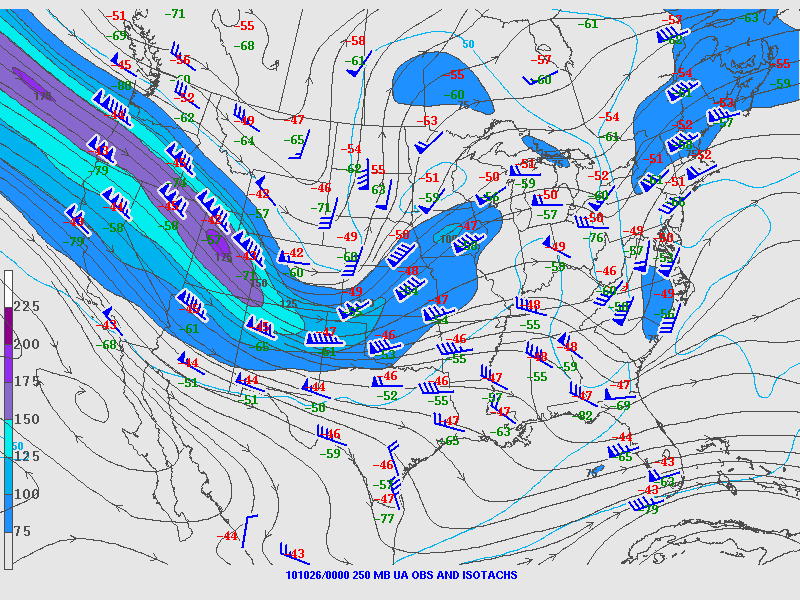
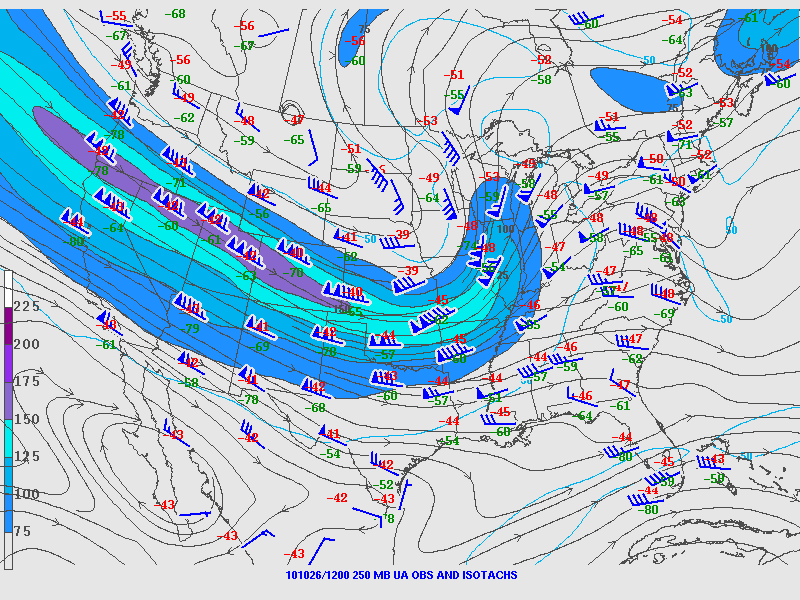
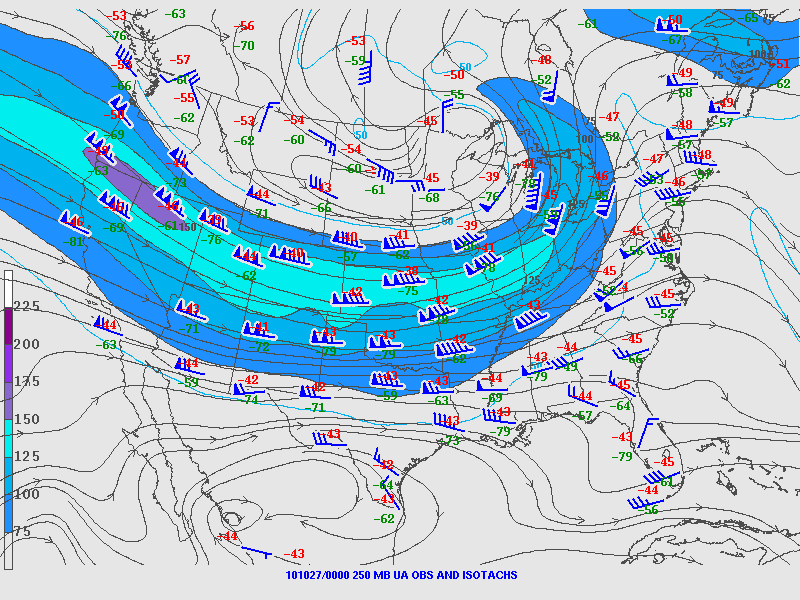
250 millibar Constant Pressure Upper Air Maps (from Storm Prediction Center)
 |
 |
 |
 |
| 7 PM CDT Oct 25 | 7 AM CDT Oct 26 | 7 PM CDT Oct 26 | 7 AM CDT Oct 27 |
Individual observations from sounding locations are plotted. Wind speeds are shaded. Streamlines are drawn in gray. The 250mb level is generally near the top of the troposphere, so this type of chart helps meteorologists analyze jet stream winds.
On the 7 PM map from October 25th, you may notice a very strong observed wind at the Salt Lake City, Utah, sounding location. Here is that sounding (image from SPC). That evening's sounding recorded a 208 mph wind (181 knots) about 10,700 meters above ground level. The strong dynamics associated with this jet streak likely contributed to the rapid deepening of the surface low.
Data From the University of Minnesota-Duluth Buoy
 |
 |
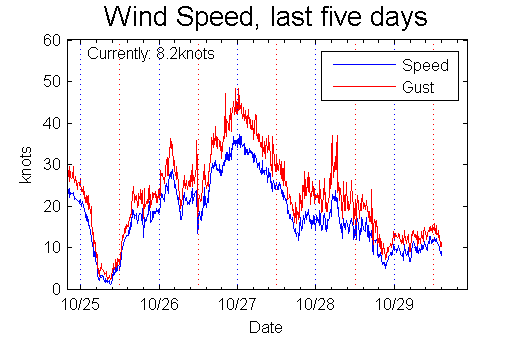 |
| Color shaded and interpolated graph of water temperature trends at UMD Buoy 10/25 to 10/29. | Plot of individual depths' water temperatures at the UMD Buoy 10/25 to 10/29. | Plot of wind speeds and gusts at the UMD Buoy 10/25 to 10/29. |
Thanks to Jay Austin for permitting us to use these graphics on our story.
The water temperatures are measured at twelve different depths from 1m below the surface of the water to 40m below the surface of the water. The strong offshore winds associated with the strong low that passed through the area on October 26th contributed to cooling through a great depth of the lake as upwelling occurred, and the warmer near-surface water became more mixed with the deeper, cooler water of the lake. The peak gust on the graph is in fact approximately 49 knots, taken at a height of 3m above the water surface. The peak sustained wind was 35 knots.
Data From the Duluth Water Level Observation Station

To the right is a graph taken from the water level observation site near the Duluth Harbor that shows some interesting trends during and after the height of the storm on October 26th. Here is what is plotted:
The first thing to notice is that the graph begins as the low is passing Duluth. After the low passed, southwest winds increased into the overnight from October 26th to October 27th. At the same time, the water level fell at Duluth by approximately 1.5 feet over the course of about 12 hours.
This is not an uncommon effect on large bodies of water when strong winds develop and persist from a certain direction for awhile. Essentially, the water gets "piled up" on the downwind end of the lake. After the winds decreased slightly, and shifted to the northwest on October 27th, the water level gradually started to rise. It was still generally below the low water datum and this was likely due to the strong northwest winds blowing the water more towards the Wisconsin shoreline of Lake Superior.
An oscillation is also evident starting in the evening on October 27th. The fluctuations in water levels would be due to the excess water that had "piled up" on the other end of the lake "sloshing" back towards Duluth. Of course, the water doesn't immediately return to the west end of the lake and instantly settle. The fluctuations will continue until the low amplitude wave gradually damps out.
Quick Facts
Here is a collection of facts related to the large storm system that affected the weather for much of the United States on October 26-27, 2010. The facts will be arranged beneath a related thumbnail image.
 |
 |
|
Pressure Records
|
Wind Gusts Image from the NWS Green Bay, WI
|
 |
 |
|
Severe Weather
|
Precipitation Image from the National Mosaic and Multisensor QPE
|
Other Resources
Here is a collection of other resources and information on the extratropical cyclone of October 26-27, 2010. This will be updated periodically to reflect any new publications, websites, or information on the event.
National Snowfall Map
This is a snow depth analysis over the United States on October 27, 2010, by NOHRSC (National Operational Hydrologic Remote Sensing Center). To learn more about NOHRSC, click here.
Storm Prediction Center Severe Weather Reports Maps
 |
 |
 |
Other National Weather Service Web Pages On This Storm
This list is in alphabetical order by the city of the office's location.
Miscellaneous Links
 |
Media use of NWS Web News Stories is encouraged! Please acknowledge the NWS as the source of any news information accessed from this site. |
 |