National Weather Service United States Department of Commerce

October Heat Wave in California; Tropical Cyclone Possible in the Gulf

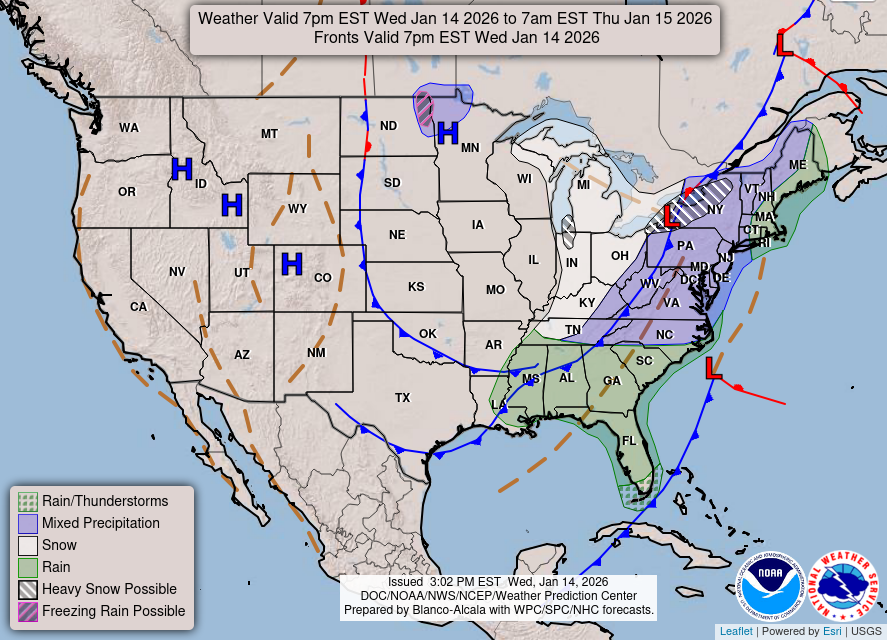
Much higher than typical October temperatures will continue across coastal southern California up through the Bay Area and Central Valley through midweek resulting in result in Major to Extreme HeatRisk. A tropical depression is likely to form over the Gulf of America during the middle part of this week with further strengthening possible as it moves northeastward later this week. Read More >

Click a location below for detailed forecast.

Last Map Update: Mon, Oct 5, 2026 at 11:32:25 pm CDT

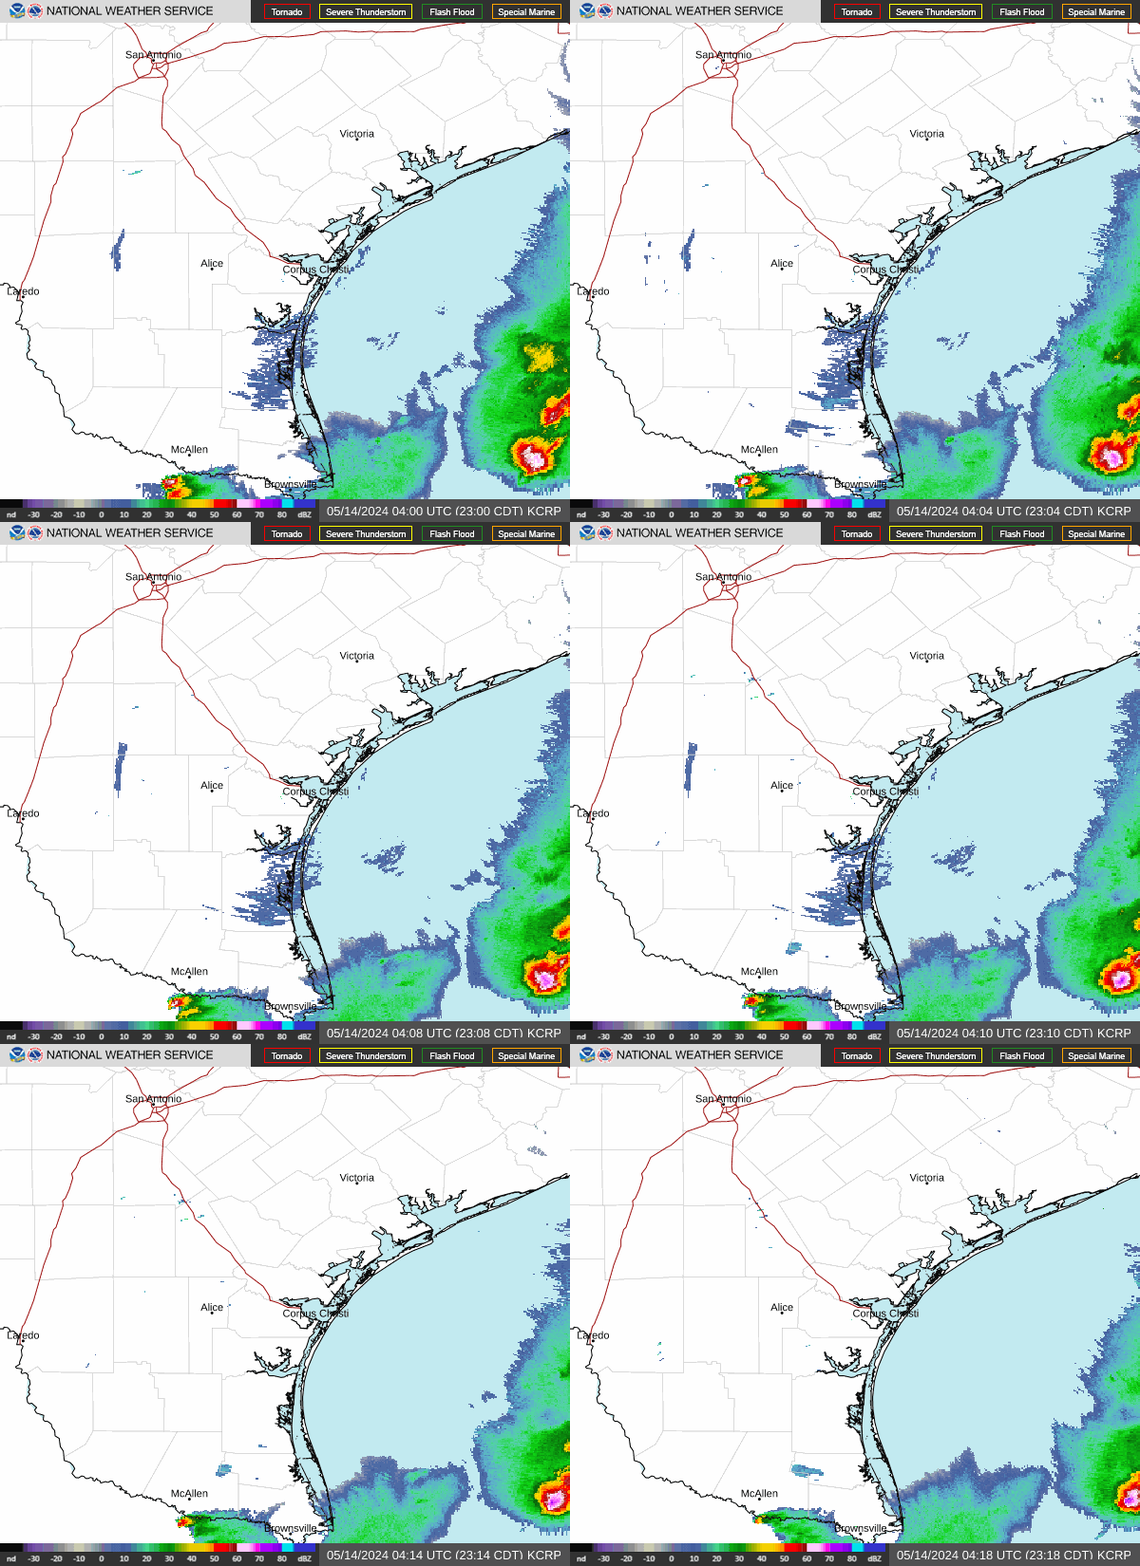
Thanks to 20-25 kt NE winds and 5-7 ft seas, Small Craft Advisory conditions will continue through Monday evening. Additionally, waves are starting to reach the dunes on Gulf-facing beaches due to the NE flow and tidal influence, leading to the issuance of a Coastal Flood Advisory through 7 PM Tuesday.
The National Hurricane Center is closely monitoring a broad area of low pressure near the Bay of Campeche for tropical development. Latest outlook calls for a 70% chance of development in the next seven days (30% in the next two days). At this time, any potential impacts to South Texas would be for increased tides and a higher risk for rip currents.
A cloudy start to the day will gradually transition to more partly cloudy skies. That said, it will be a breezy beach day. There's a low risk for rip currents today but low risk does not mean no risk. Dangerous rip currents are possible especially near piers and jetties.
Clouds decrease throughout the night. Winds will be northerly at 5-10 mph but increasing to 10-15 mph along the coastal plains (and closer to 20 mph on the barrier islands). Lows will be in the upper 60s to mid 70s.
The first half of the work week starts of with quieter weather but depending on the disturbance near the Bay of Campeche will determine rain chances by Thursday and Friday.

 
Hourly Weather Roundup ( )
Location Sky/Weather Temp Dewpt RH Wind Baro Remarks
Alice
N/A
N/A
N/A
N/A
N/A
N/A
N/A
Beeville
N/A
N/A
N/A
N/A
N/A
N/A
N/A
Corpus Christi
N/A
N/A
N/A
N/A
N/A
N/A
N/A
Corpus Christi NAS
N/A
N/A
N/A
N/A
N/A
N/A
N/A
Cotulla
N/A
N/A
N/A
N/A
N/A
N/A
N/A
Kingsville NAS
N/A
N/A
N/A
N/A
N/A
N/A
N/A
Laredo
N/A
N/A
N/A
N/A
N/A
N/A
N/A
Port Lavaca
N/A
N/A
N/A
N/A
N/A
N/A
N/A
Rockport
N/A
N/A
N/A
N/A
N/A
N/A
N/A
Victoria
N/A
N/A
N/A
N/A
N/A
N/A
N/A
Note: "N/A" or "MISG" will be displayed if values are not available. In the LOCATION column, click on links for a list of recent observations at sites of interest. In the WIND column, VRB is "variable" and G is "gust". Wind speeds are in MPH. In the BARO (pressure) column, values are in inches. In the REMARKS column, HX is "heat index", WCI is "wind chill index", and VSB is "visibility" (if shown).
 
Text Product Selector
Video Briefing Weather Outlook Fcst Discussion Tropical Marine Tides
Rivers and Lakes Daily Rainfall Drought Fire Observations Satellite

Hourly Wx Graph Graphical Fcst Aviation Climate Past Events Hurricane Guide