
Scattered strong to severe storms capable of sporadic large hail and severe winds are expected this afternoon and evening across portions of western Texas. Widespread showers and thunderstorms may produce isolated flash flooding across the Ozarks today and the Southeast into next week. Read More >

| 1924 | 1940 | 1946 | 1947 | 1948 | 1949 |
| 1951 | 1956 | 1961 | 1962 | 1963 | 1964 |
| 1973 | 1978 | 1982 | 1983 | 1985 | 1989 |
| 1990 | 1994 | 1996 | 1997 | 2007 | 2011 |
All of the information contained within this website is available for download as both a PDF & Powerpoint. Since 1924, freezing rain and/or freezing drizzle (freezing precipitation) has been observed on average every 3 to 4 years in Corpus Christi. At least one report of freezing precipitation in 24 separate years has occurred since 1924. For more detailed Corpus Christi official freezing precipitation observations obtained from the National Climatic Data Center (NCDC), please click here. It could not be determined with a reasonable level of certainty if freezing precipitation occurred in the following years: 1896, 1897, 1918, 1925, 1929 or 1932. Ice pellets and/or snow were observed in these particular years. However given the fact that only two daily observations were taken prior to 1933, the possibility existed for freezing precipitation (which oftentimes can accompany frozen precipitation in South Texas) to have occurred between the official observation times. Such was the case for the 1924 event.
Official surface observations for the 1924 ice storm only indicated that snow and ice pellets fell. However, as mentioned above, surface observations prior to 1933 were only taken twice daily at 700 AM CST and 700 PM CST . Newspaper reports and accounts from the National Weather Service in Corpus Christi did indeed indicate that freezing precipitation occurred in 1924. As a result of these non-official accounts, the 1924 ice storm is considered one of the most significant ice storms to have affected Corpus Christi.
| 12/19-25, 1924 | 1/18-22, 1940 | 1/29-31, 1951 | 1/9-10, 1973 | 1/12, 1982 | 2/5-6, 1982 | 1/12-14, 1985 | 2/4-7, 1989 | 2/3-4, 2011 | |
|---|---|---|---|---|---|---|---|---|---|
| Ice Thickness | Unknown | Unknown | >1⁄10″ | 1⁄4-1⁄2″ | Unknown | Unknown | 1″ | 1⁄3-1⁄4″ | 1⁄4-3⁄8″ |
| Total Liquid | 1.45″ | Unknown | 0.10″ | 0.39″ | 0.05″ | 0.04″ | 0.57″ | 0.09″ | 0.05″ |
| Event Duration | ∼4 days | 6 hours | ∼42 hours | 16 hours | 2 hours | 5 hours | 30 hours | 39 hours | 14 hours |
| Freezing Duration | ∼72 hours | 23 hours | 96 hours | 14 hours | 31 hours | 17 hours | 32 hours | 38 hours | 37 hours |
| Fatalities | Unknown | Unknown | 2 | None | None | 1 | 2 | None | None |
| Injuries | Unknown | Unknown | Multiple | ≥10 | Unknown | Dozens | ≥27 | Multiple | Multiple |
From all these events, nine significant ice storms were identified. Since ice thickness is usually not reported in the official NCDC record, other data sources, especially from the Corpus Christi Caller Times had to be used to qualitatively rank these ice storms. NCDC's Storm Data publication was used to gather additional information on the ice storms in the 1980s and the 2011 ice storm. Supplemental socio-economic data included:
A significant factor in delineating the severity of an ice storm was not only the thickness of ice but also the duration of extreme cold weather. The basic theory behind this is that the longer it stays below freezing and the lower the temperature, then there will be less likelihood of melting of ice. Thus, the impact from any ice accumulation would be longer in duration and have a greater effect on the community at large.
The one common factor with these nine ice storms was that they were all associated with significant Arctic Outbreaks across much of the United States, including South Texas. At the 500 mb level, a strong ridge axis was evident in most cases across Alaska and either along or just off the West Coast of the United States. A deep closed low at 500 mb was also evident in all cases stretching between Hudson Bay and Greenland. This synoptic pattern is similar to Arctic Outbreak patterns mentioned by McFarland (1976) and Mortimer (1988). The synoptic pattern observed in these ice storms and accompaying Arctic Outbreaks differ from the positive phase of the Pacific-North American (PNA) teleconnection pattern. The main difference is that the upper ridge axis is shifted further eastward with the positive PNA pattern which produces warmer temperatures to occur across the western U.S. and western Canada.
Oftentimes, there was a short wave trough axis evident in the southern (subtropical) branch of the jet stream moving through the Desert Southwest of the U.S. and northern Mexico. This feature was also noted by McFarland (1976) and Mortimer (1988) in their assessment of synoptic patterns associated with Arctic Outbreaks. Sometimes, this short wave was in phase with the deep low pressure area located between Hudson Bay and Greenland, forming a positive tilt long wave trough axis extending from eastern Canada southwestward into northwest Mexico. Another aspect to the short wave trough axis is its obvious role in the development of precipitation by producing the necessary upward forcing. Several of these ice storms were associated with weak cyclogenesis in the Northwest Gulf of America, most likely caused by a short wave approaching from the west. The strongest of these short waves occurred in January 1985 which not only produced significant icing across Corpus Christi but also produced record snowfall (13.5 inches) in San Antonio!
_sm.jpg) |
| Surface Composite for the 1924,1940,1951,1973,1982,1985 & 1989 ice storms |
|---|
_sm.jpg) |
| 500 mb Composite for the 1924,1940,1951,1973,1982,1985 & 1989 ice storms |
Just after 300 AM on December 19th, 1924 a strong Arctic cold front blasted through South Texas. A large and sprawling Arctic high pressure behind this front was centered in the Yukon with a pressure of 1060 mb.
The temperature fell by 50 degrees in 12 hours from 72 degrees at 300 AM to 22 degrees by 300 PM. The temperature remained at or below freezing for nearly 72 consecutive hours which is the 2nd coldest all-time period with high temperatures remaining at or below freezing. Another indication of how cold this airmass is the fact that 1 record low temperature and 2 record low maximum temperatures still exist for Corpus Christi to this day.
Around noon on the 19th (approximately 9 hours after frontal passage), a wintry mix of precipitation began to fall across Corpus Christi. A mix of freezing rain, sleet and snow occurred intermittently from the afternoon on the 19th through the 21st. A brief moderating trend in temperatures occurred on the 22nd, 23rd and 24th. A second Arctic cold front moved through the region on the morning of the 24th. A light wintry mix occurred on Christmas morning behind this second cold front. Approximately 1.45 inches of wintry precipitation fell intermittently during the entire 4 day period (19th, 20th, 21st and 25th).
Although the thickness of ice was unknown during this ice storm, evidence strongly suggests that it was significant. J.P. McAuliffe, former Meteorologist-in-Charge at the National Weather Service office in Corpus Christi (from 1922 to 1946) stated the following:
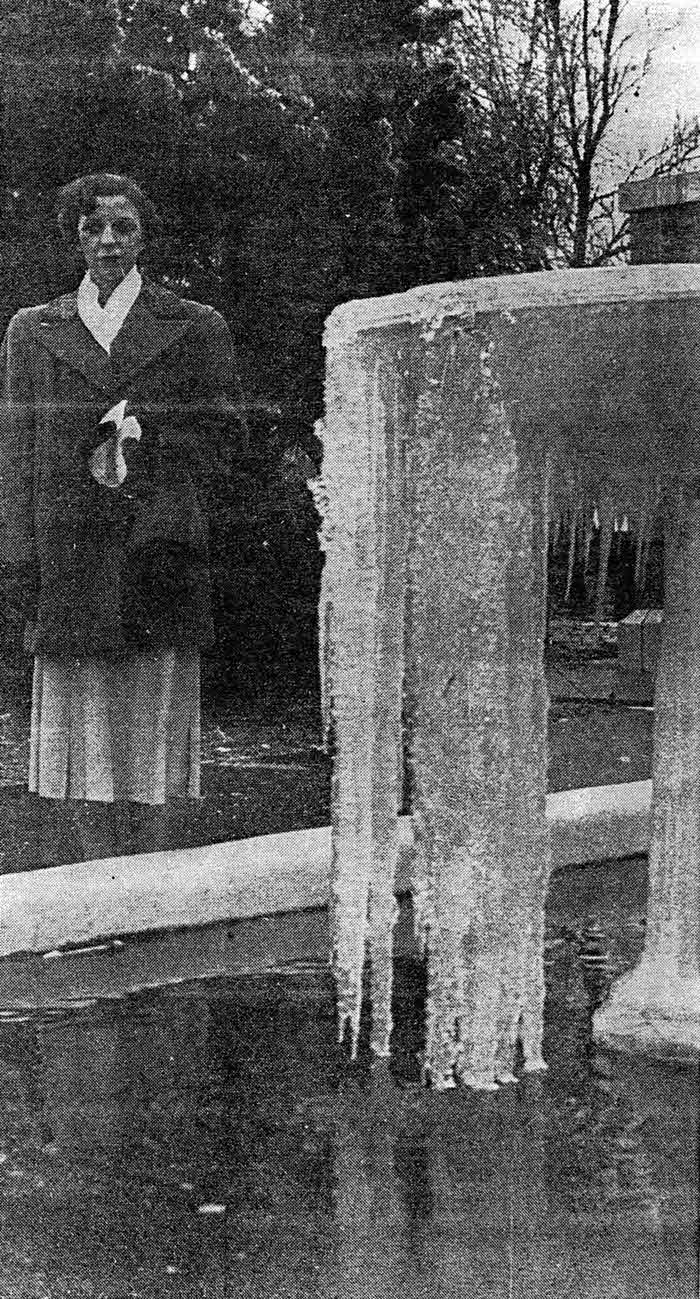
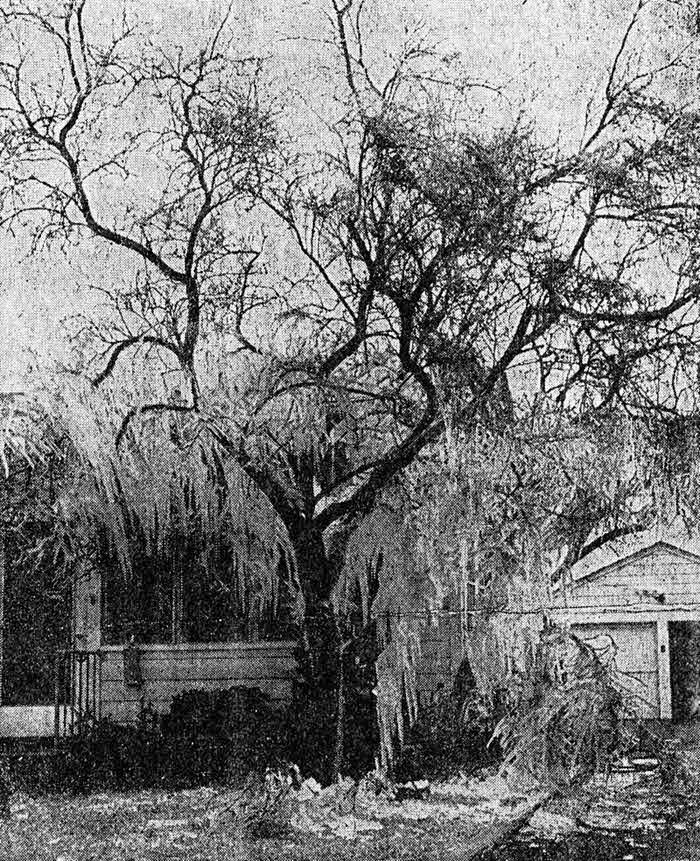
Rain began about 210 AM of the 19th; at noon the surface temperature sank to freezing, and within half an hour thereafter overhead wires, trees, shrubbery, streets, and sidewalks were covered with a heavy coating of glaze making travel of all sorts difficult and dangerous. The coating on the wires and trees soon became so heavy as to cause the wires to break and branches of trees to collapse, while small ornamental trees and shrubbery were crushed to the ground. In rural districts the burden of ice caused telephonic communication to cease about 300 AM of the 19th, but it was not interrupted in the city until later in the day.
Travel came to an almost complete halt. Many automobile accidents occurred due to the ice. Trolley cars could not operate because the electrical wires which made them function were knocked down by the ice. Passenger trains were 5 to 8 hours behind schedule. Communication infrastructure such as telephone lines were down for days. In some rural areas, telephone lines were down for 4 months! Damage to crops and vegetation was extensive. The Corpus Christi Caller newspaper noted:
...a mantle of ice throughout the entire city, and presented a scene which has not been witnessed here in many years. Many of the trees were unable to stand up under rapidly forming icicles and branches split from the trees because of the weight of the ice could be seen in many parts of the city.
...about 675 breaks between Corpus Christi and Gregory, and about 600 between Corpus Christi and Robstown. These breaks were caused by the terrific weight of ice which coated the wires...
The slippery sidewalks and streets made traffic for pedestrians and automobiles somewhat hazardous...
Sleigh riding was invoked in Corpus Christi...
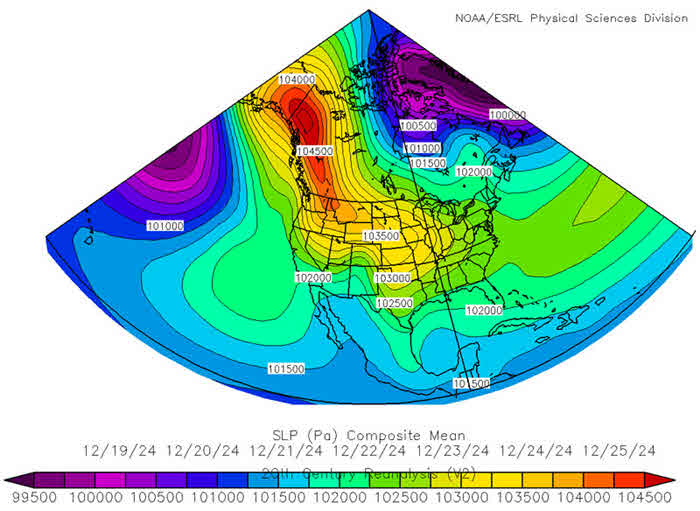 |
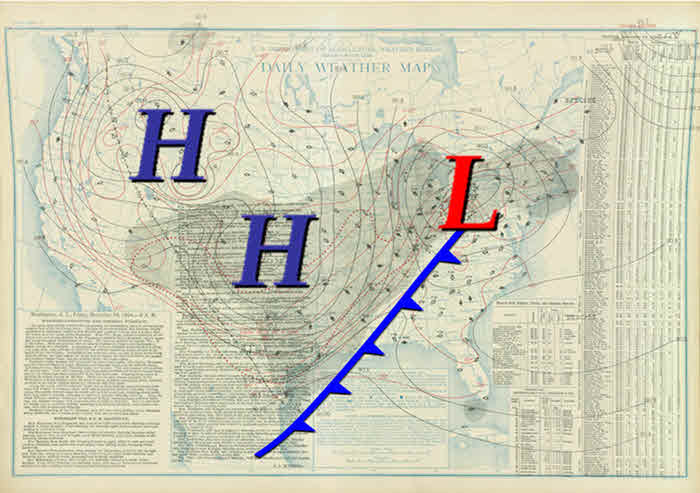
| Surface Composite for 12/19/24-12/25/24 |
|---|
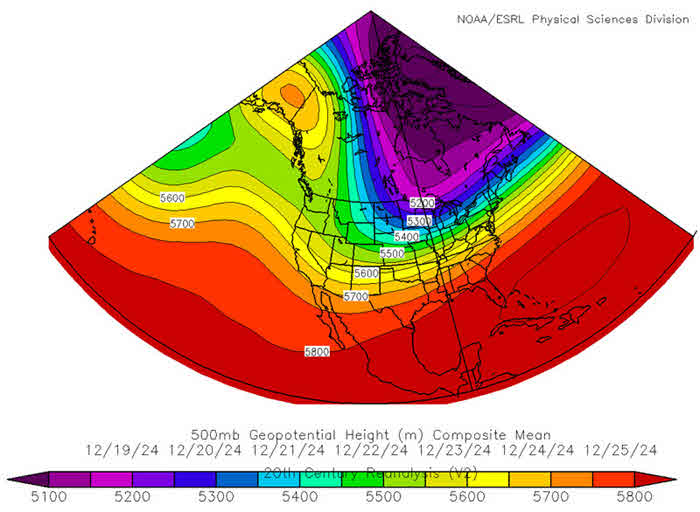 |
| 500 mb Composite for 12/19/24-12/25/24 |
Around noon on January 18th, 1940, an Arctic cold front moved through Corpus Christi. Record-breaking cold air from a sprawling 1047 mb high pressure centered from Montana to the Northwest Territories continued to push into South Texas over the next 5 days through the 23rd. This airmass was so cold that 2 records lows still exist today and the period between the 19th and 23rd is the third coldest January period ever for Corpus Christi! Approximately 23 consecutive hours remained at or below freezing.
Freezing precipitation began on the afternoon of the 18th (5 hours after the frontal passage) and persisted through the evening hours of the 18th. A secondary surge of Arctic high pressure along with the development of a surface low in the Northwest Gulf of America produced a brief round of freezing rain, sleet, and snow on the 22nd. The duration of freezing precipitation was only 6 hours and the ice thickness was unknown.
The Corpus Christi Caller Times reported:
Utility lines damaged
Heavy crop damage
Hazardous driving conditions
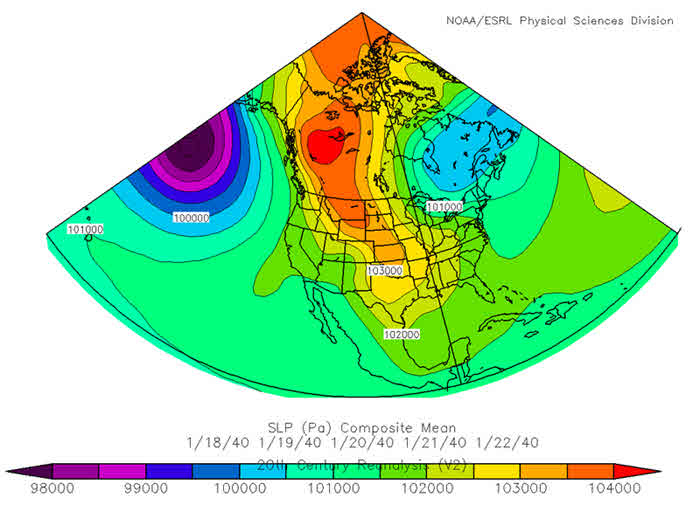 |
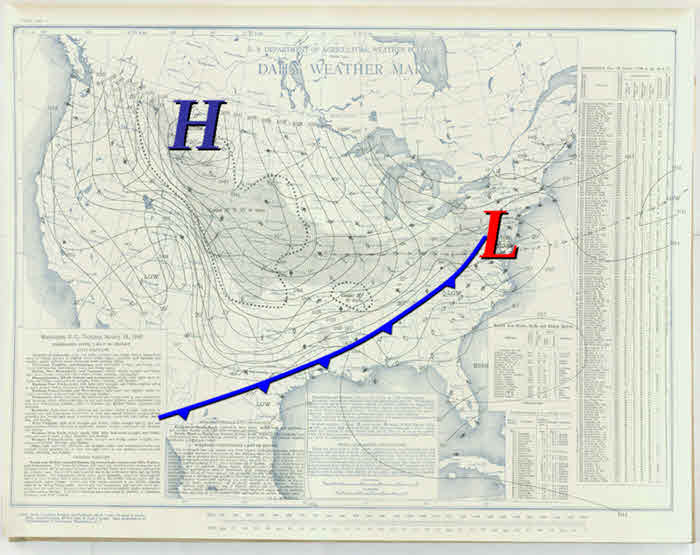
| Surface Composite for 1/18/40-1/22/40 |
|---|
 |
| 500 mb Composite for 1/18/40-1/22/40 |
 |
Surface Map animation of the Arctic airmass moving southward (Jan 28-31, 1951) |
By 500 PM on the evening of January 28th, 1951, an Arctic cold front moved through Corpus Christi. The temperature dropped 30 degrees in 7 hours behind the front. A maximum central pressure of 1062 mb was recorded within this Arctic airmass in the Yukon. The cold wave that ensued for several days thereafter was one of the coldest ever for Corpus Christi. It remained at or below freezing for 96 consecutive hours which is an all-time record for Corpus Christi! This was the coldest 6-day consecutive stretch (ending February 3rd) in history! 5 record lows observed for Corpus Christi during this Arctic outbreak still stand today.
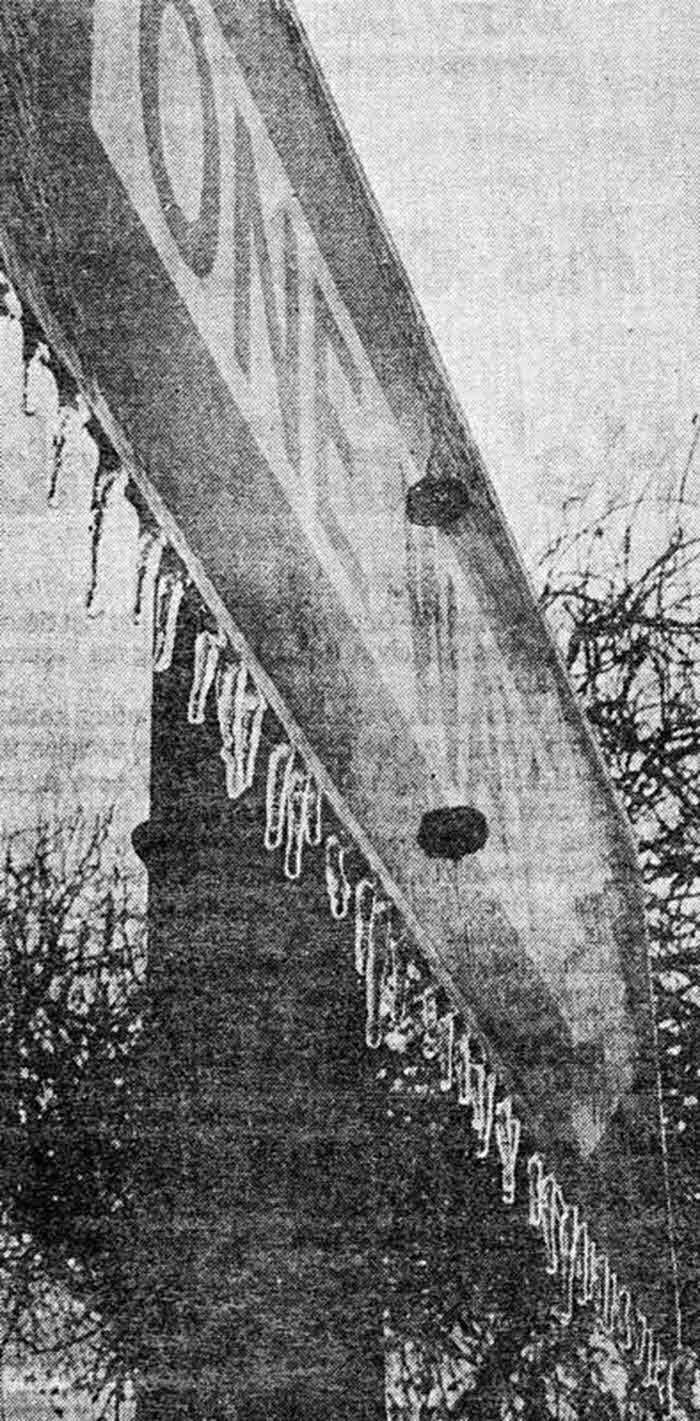
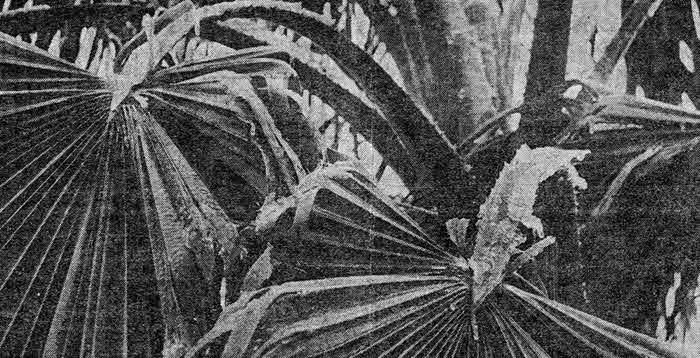
Freezing precipitation began to fall across Corpus Christi in the afternoon on the 29th (approximately 19 hours after frontal passage). Around 42 hours of freezing rain or freezing drizzle occurred during this storm. The freezing precipitation finally ended in the afternoon on the 31st. This is one of the longest duration ice storms ever experienced in Corpus Christi. Some snow mixed with the freezing precipitation for around 10 hours. This ice storm was not only significant for Corpus Christi but for a large part of the Deep South for up to 2 weeks in some cases. The 1951 ice storm was one of the costliest and deadliest in history for the Southern U.S. according to Harlin (1952).
The freezing precipitation was strongly enhanced from a strong short wave trough axis moving through the Desert Southwest and northern Mexico. This short wave trough axis eventually induced a surface low to develop across the Northwest Gulf of America by the 31st.

The ice thickness was once again unknown for this ice storm. The only account of ice thickness came from the Corpus Christi Caller Times:
Another coating of ice is expected today to replace the one-tenth inch thick blanket chipped away yesterday.
The Corpus Christi Caller Times also stated:
Not within the memory of any city official has an ice storm caused such widespread damage.
Total liquid equivalent was 0.10 inches for this entire event. Given the extreme prolonged cold spell and the long duration of freezing precipitation, it is more than likely that the actual ice thickness was greater one-tenth of an inch. In fact, when you look at the tremendous impact that this ice storm had on Corpus Christi, then it becomes quite clear that this ice storm was one of the worst of all time to affect Corpus Christi. Here are some impacts from this ice storm:

| 
| 
|
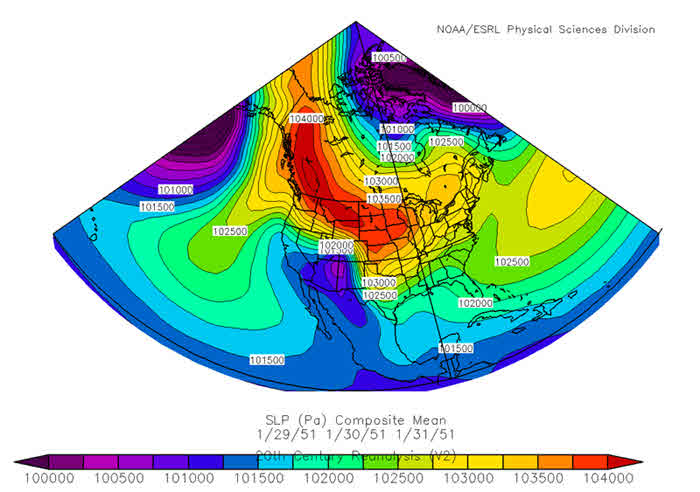 |
| Surface Composite for 01/29/51-01/31/51 |
|---|
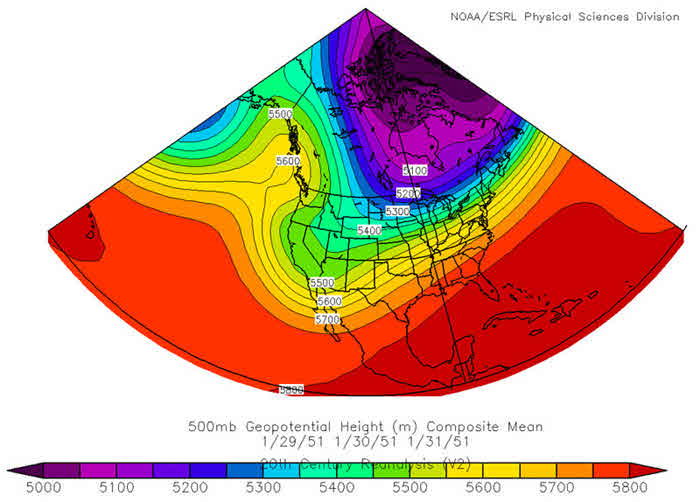 |
| 500 mb Composite for 01/29/51-01/31/51 |
On the evening of January 5th, 1973, an Arctic cold front pushed through Corpus Christi. Arctic high pressure centered in southern Canada (1045 mb) then proceeded to filter into South Texas through the 11th. The period between the 9th and the 11th was the 4th coldest 3-day stretch of January high temperatures for Corpus Christi! Approximately, 14 hours were at or below freezing on the 9th and 10th.
Freezing precipitation began on the morning of the 9th and persisted intermittently through the morning of the 10th. The actual duration of the icing was around 16 hours. The ice accumulation reported was one-quarter to one-half of an inch. Total liquid equivalent was 0.39 inches.
Here are some of the main impacts:
The Corpus Christi Caller Times reported:
Worst winter disaster ever to hit the Nueces Electric Cooperative
 |
 |
 |
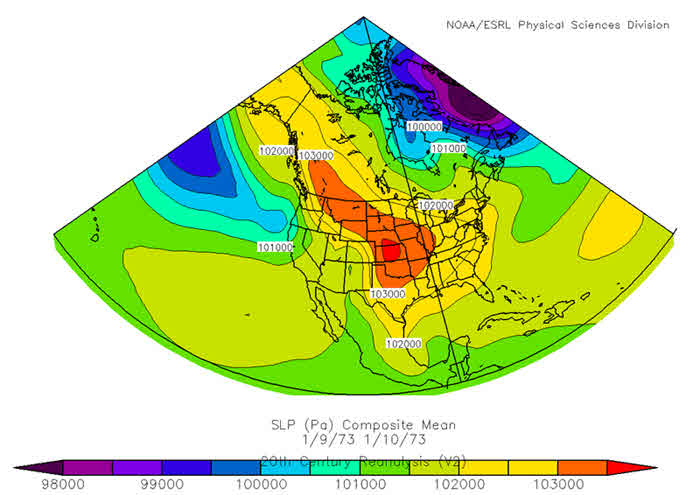 |
| Surface Composite for 01/9/73-01/10/73 |
|---|
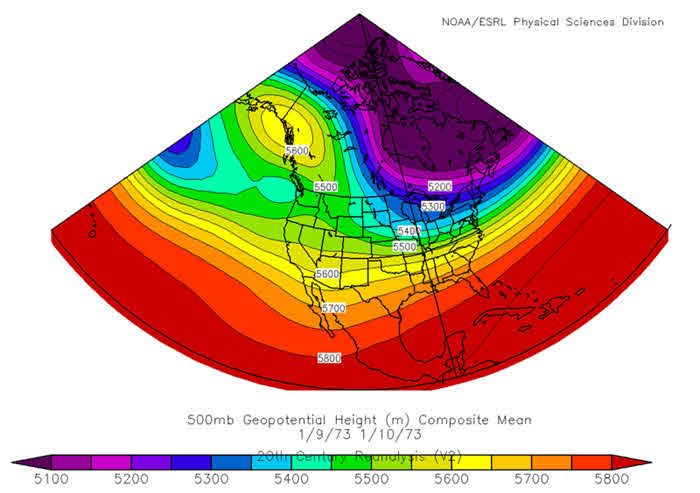 |
| 500 mb Composite for 01/9/73-01/10/73 |
On the morning of January 10th, 1982, an Arctic cold front pushed southward across South Texas behind a sprawling 1056 mb surface high pressure area centered in southwest Canada. Freezing precipitation occurred during the morning of the 12th (which was around 39 hours after frontal passage) and lasted for around 2 hours. The ice thickness was unknown during this event but according to the Corpus Christi Caller Times, there was significant glazing north of Corpus Christi. Numerous accidents occurred. Travel was disrupted due to ice coated expressways, overpasses, and bridges.
Approximately 31 hours were at or below freezing. The liquid equivalent was around 0.05 inches which was not all freezing precipitation.
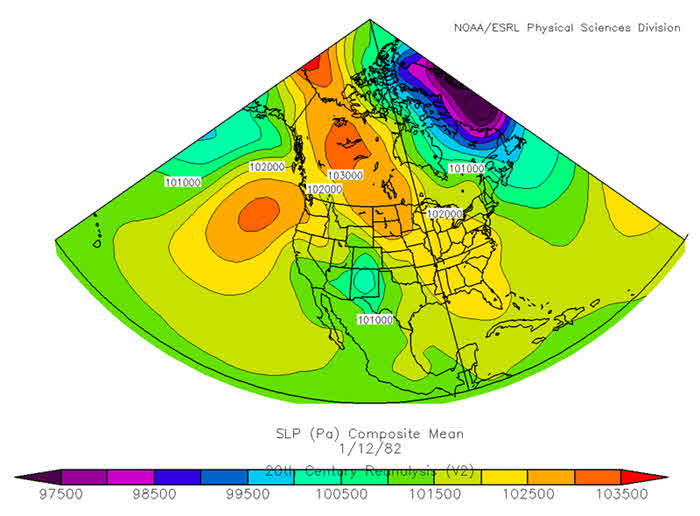 |
| Surface Composite for 01/12/82 |
|---|
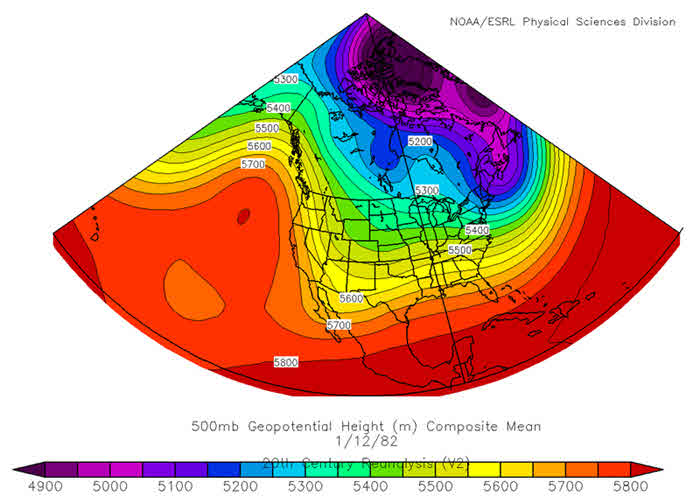 |
| 500 mb Composite for 01/12/82 |
An Arctic cold front moved through South Texas on February 2nd, 1982 during the afternoon. A large 1044 mb high pressure area centered across southern Canada and the northern Plains occurred behind the Arctic front. Approximately 17 hours were at or below freezing as a result of the Arctic airmass. Freezing precipitation fell intermittently from the evening of the 5th through the early morning hours of the 6th as a weak surface low developed in the Northwest Gulf of America. Approximately 5 hours of icing occurred with a liquid equivalent of 0.04 inches. The actual ice thickness was again unknown for this event.
This storm did produce 1 fatality in George West and produced dozens of injuries. Numerous traffic accidents also occurred. The Harbor Bridge was closed to allow for sanding operations.
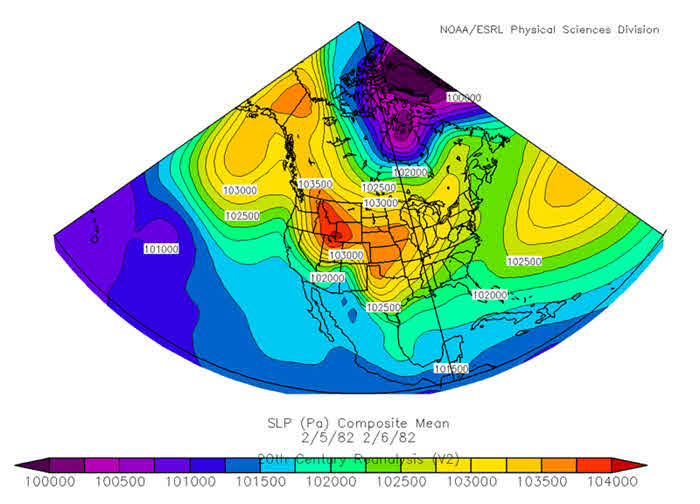 |
| Surface Composite for 2/5/82-2/6/82 |
|---|
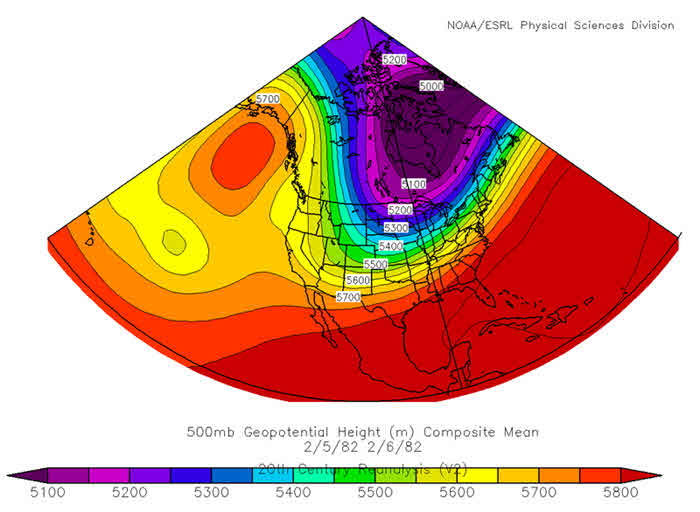 |
| 500 mb Composite for 2/5/82-2/6/82 |
On the morning of January 10th, 1985, an Arctic cold front moved through Corpus Christi. Arctic high pressure as high as 1048 mb pushed southward into South Texas through the 13th. At the height of the cold wave, approximately 32 consecutive hours were at or below freezing. On the morning of the 12th, freezing precipitation began falling at Corpus Christi. This event lasted 30 hours before finally ending on the evening of the 13th. The total liquid equivalent was 0.57 inches for this event.
According to the Corpus Christi Caller Times, 1 inch of ice was reported on the Nueces Bay Causeway. This is the greatest ice thickness ever reported in Corpus Christi for any ice storm! Although this ice thickness was unofficial, the other impacts from this ice storm make this one of the greatest ice storms to ever impact Corpus Christi:
 |
 |
 |
 |
 |
|
 |
 |
|
 |
| Surface Composite for 1/12/85-1/14/85 |
|---|
 |
| 500 mb Composite for 1/12/85-1/14/85 |

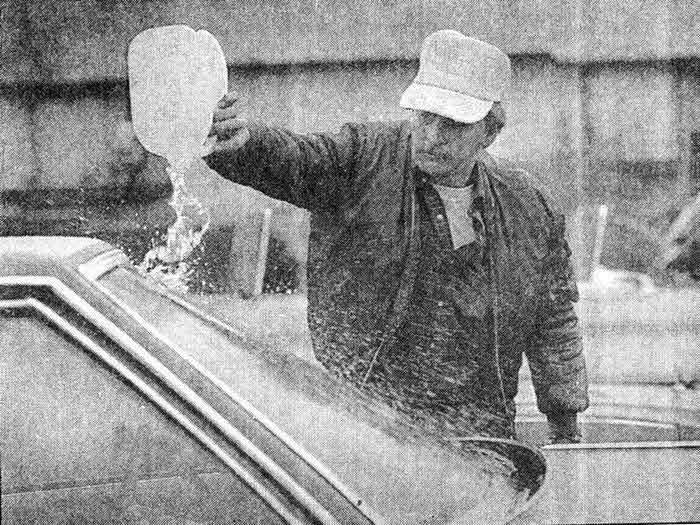
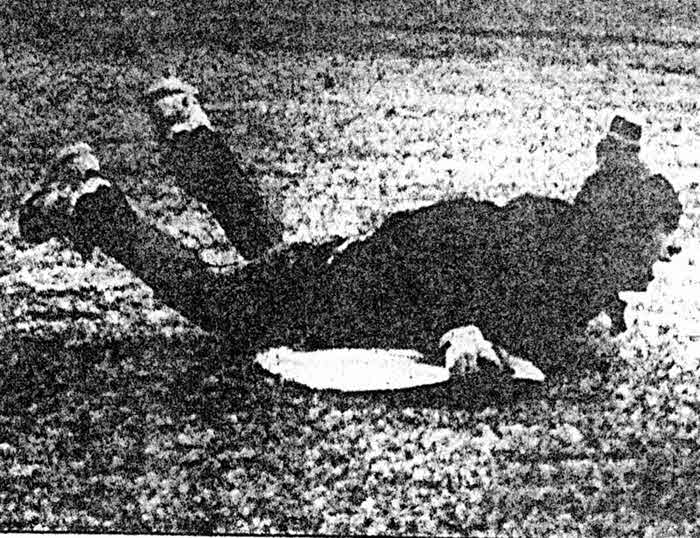
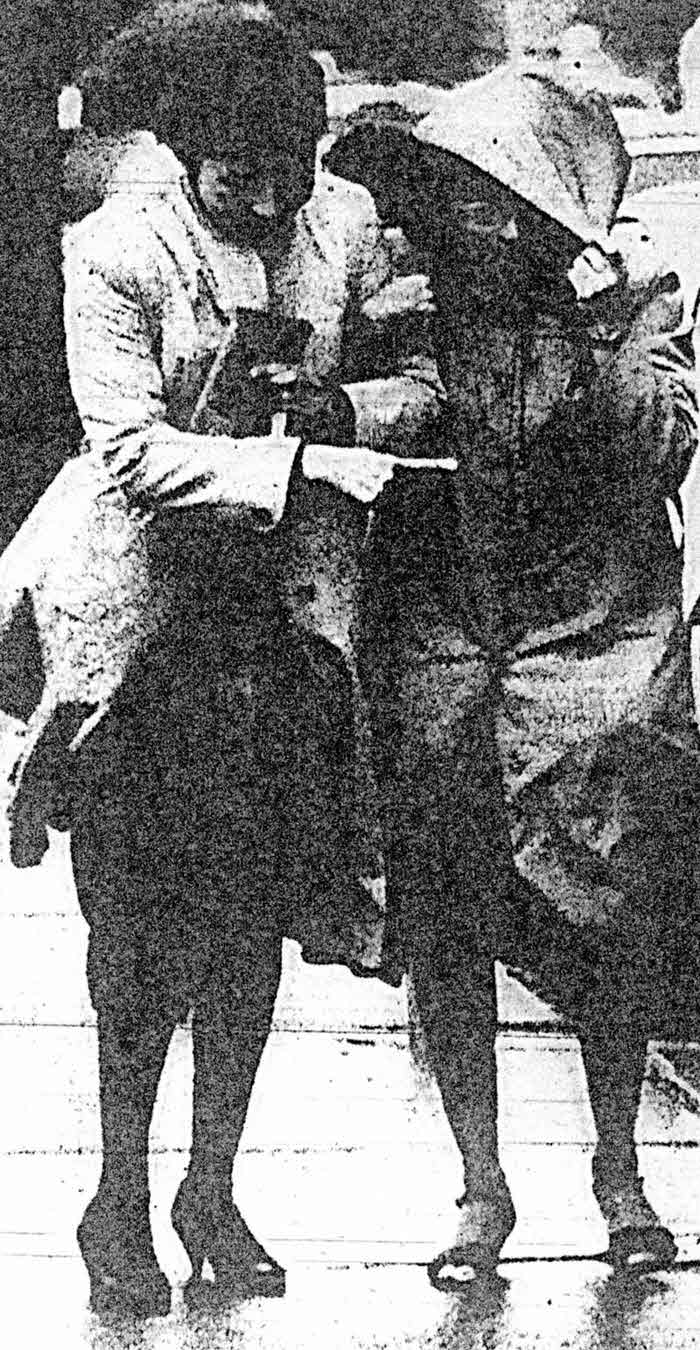
On the morning of February 3rd, 1989, an Arctic cold front moved through South Texas. Freezing precipitation first began falling during the early morning hours on the 4th and continued intermittently for an incredible 39 hours until the evening hours of the 6th. Ice accumulation was measured at one-third to one-quarter of an inch across Corpus Christi. Liquid equivalent was 0.09 inches.
The Corpus Christi Caller Times reported the following impacts:
One of the biggest factors affecting the severity of this event was the prolonged extreme cold weather. A 1060 mb high pressure centered in the Yukon helped produce nearly 38 consecutive hours of at or below freezing temperatures. One record low for Corpus Christi still stands to this day during this cold snap along with the 7th coldest 3-day period (ending 2/6) ever recorded for high temperatures.
 |
 |
 |
 |
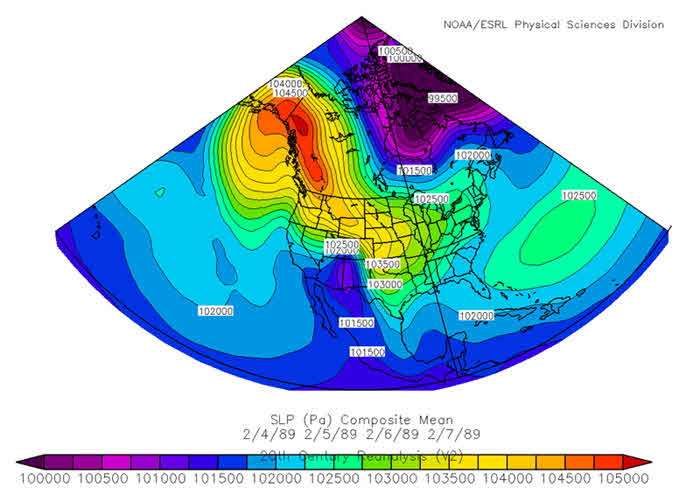 |
| Surface Composite for 2/4/89-2/7/89 |
|---|
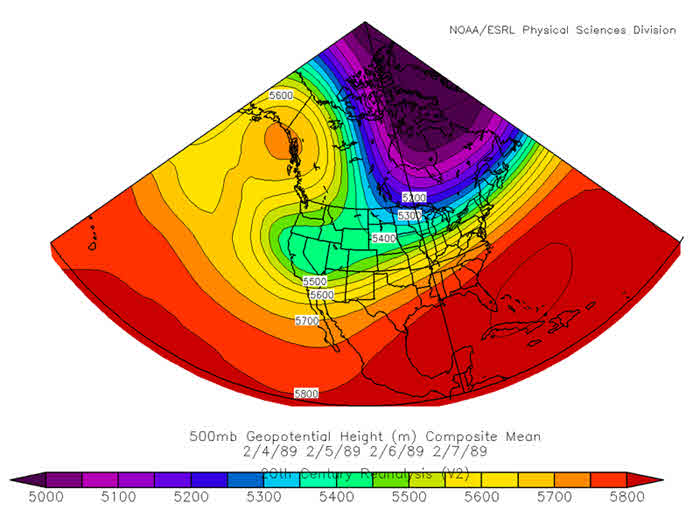 |
| 500 mb Composite for 2/4/89-2/7/89 |
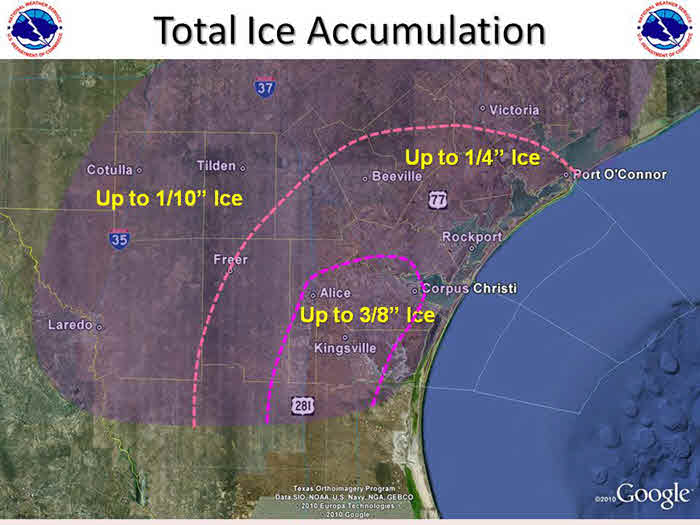
One the morning of February 1st, 2011, a 1054 mb Arctic high pressure area was centered over eastern Montana. Meanwhile, at the same time, an Arctic cold front was moving quickly across South Texas. Record cold temperatures behind this front set the stage for a significant icing event. 1 record low temperature along with the 5th coldest 3-day February period for high temperatures were observed in Corpus Christi during this Arctic outbreak. Approximately 37 consecutive hours of temperatures at or below freezing occurred during the peak of this Arctic outbreak.
An approaching 500 mb closed low pressure area along with moist overrunning conditions produced around 14 hours of mostly light freezing drizzle. Freezing drizzle began in the early evening on the 3rd and ended around sunrise on the 4th. The ice thickness in Corpus Christi ranged between one-quarter to three-eighths of an inch. Total liquid equivalent was only 0.05 inches.
Some of the impacts from this ice storm were:
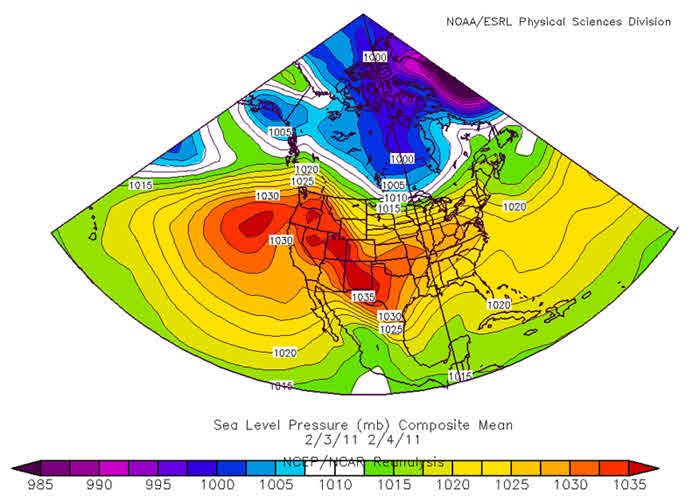 |
| Surface Composite for 2/3/11-2/4/11 |
|---|
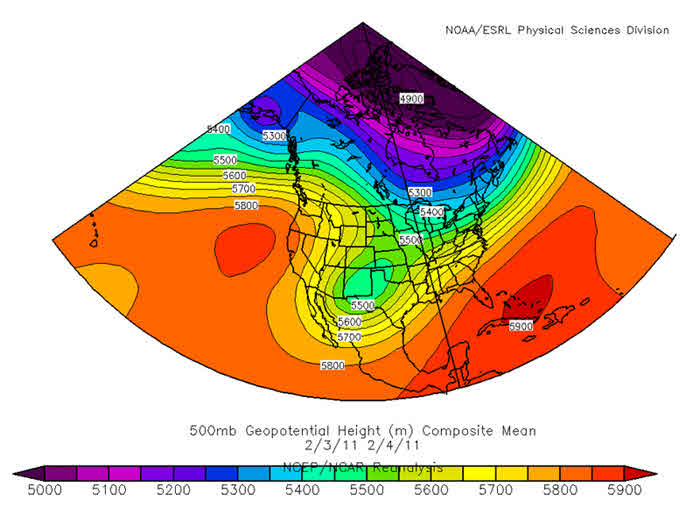 |
| 500 mb Composite for 2/3/11-2/4/11 |

