|
Becomes a Tropical Storm
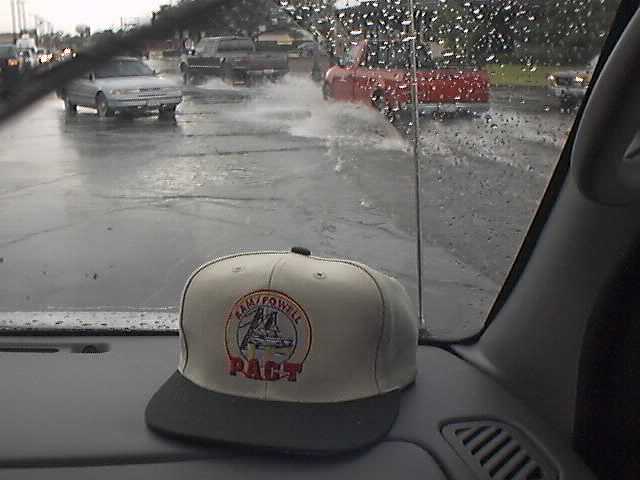
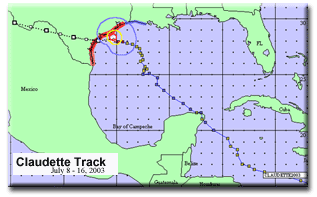
Claudette began as a tropical wave in the far eastern Atlantic. At 4pm July 8th, Claudette strengthened into tropical storm as she moved into the central Caribbean Sea. Claudette tracked steadily across the Caribbean around a broad high pressure system which was anchored over the western Atlantic. The steering currents were strong but so was the upper level wind shear, and this prevented Claudette from strengthening into a hurricane. As Claudette passed the Yucatan Channel and entered the Gulf of America on Fri July 12th, the steering currents relaxed and she slowed her northwesterly movement. Claudette produced tropical storm force winds and heavy rains primarily on her eastern quadrant which spanned a large portion of the central Gulf and produced wave heights up to 15 feet. Large Swells began impacting the Texas Coast as early as Sat July 13th, and waves were reported as reaching the dunes.
Long Range Forecast
The National Hurricane Center (NHC) consistently forecast Claudette to become a Category 1 Hurricane and strike somewhere on the middle to south Texas coast. It must be noted that forecast track errors at day 5 average 375 nautical miles.
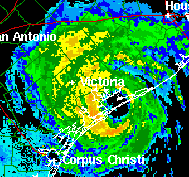
Approaching Texas
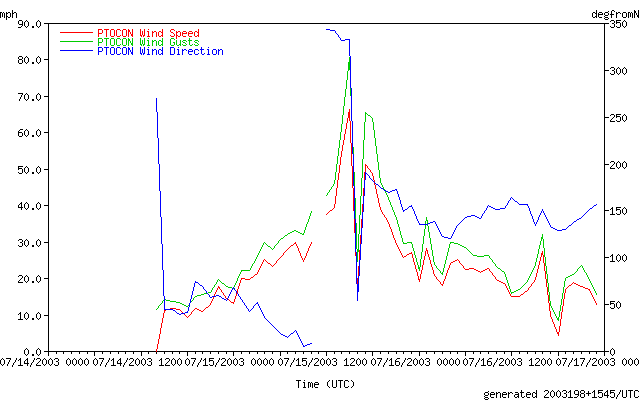
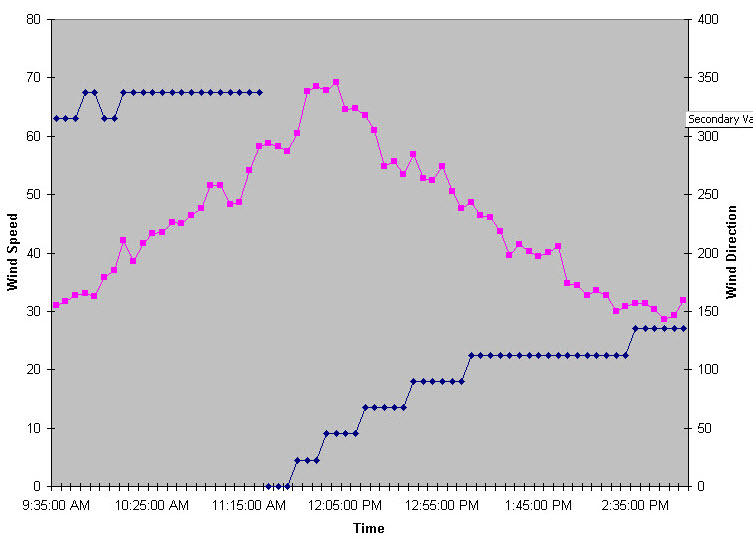
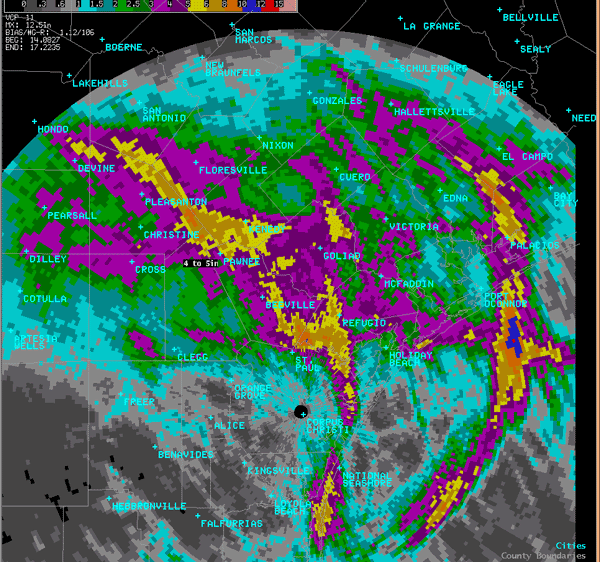
During the last few days before landfall, Claudette wobbled slowly toward the middle Texas coast in very weak steering currents. Most of the computer models were indicating that the broad high pressure system over the western and central United States would pick up this storm and track it west. But this did not happen until right before landfall. The NHC posted a Hurricane Warning a little more than 24 hours before landfall from Brownsville to San Luis Pass, and expected her to strike close to Port O'Connor. In addition, the upper level shear in this system relaxed as expected providing the environment for Claudette to strengthen into a Hurricane.
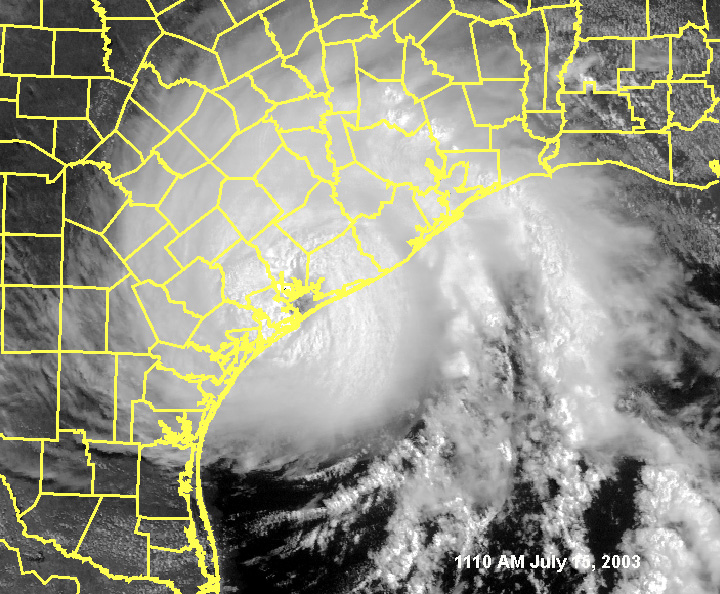
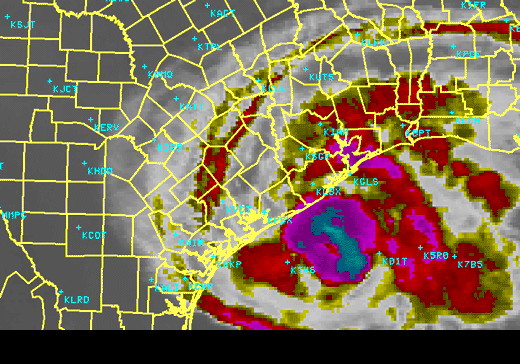
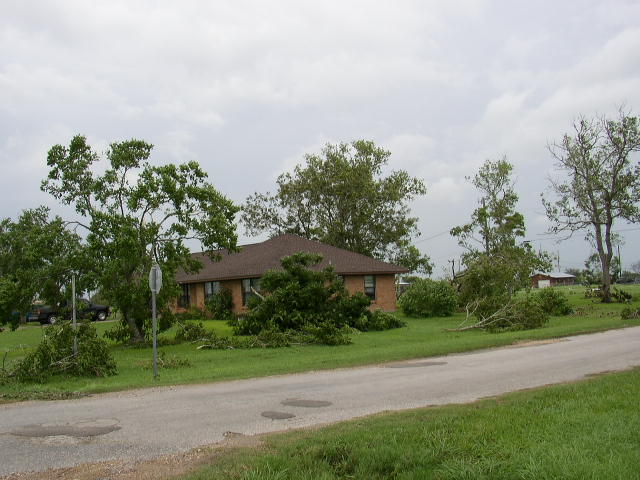
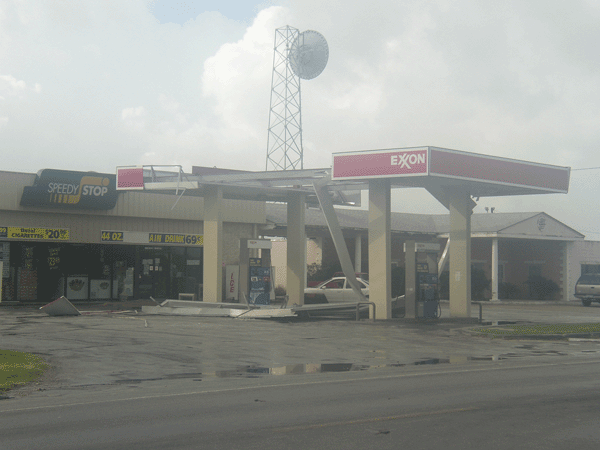
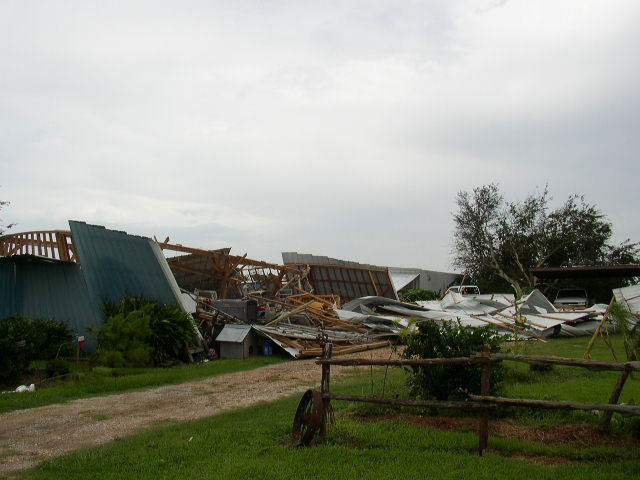
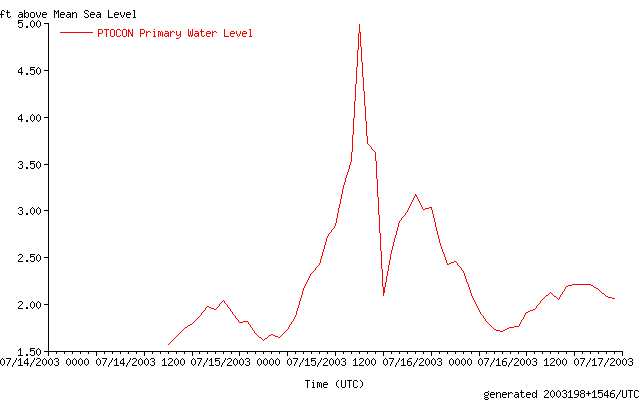
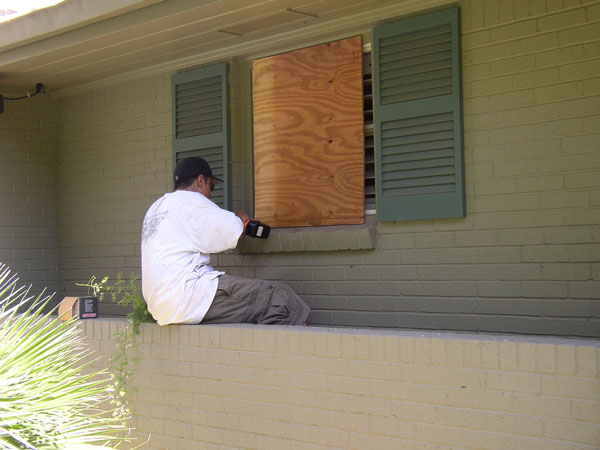
Making Landfall
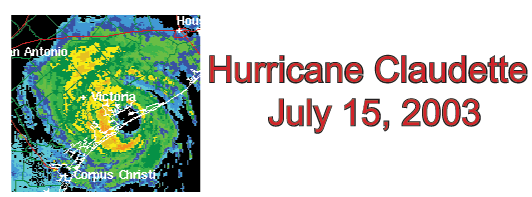
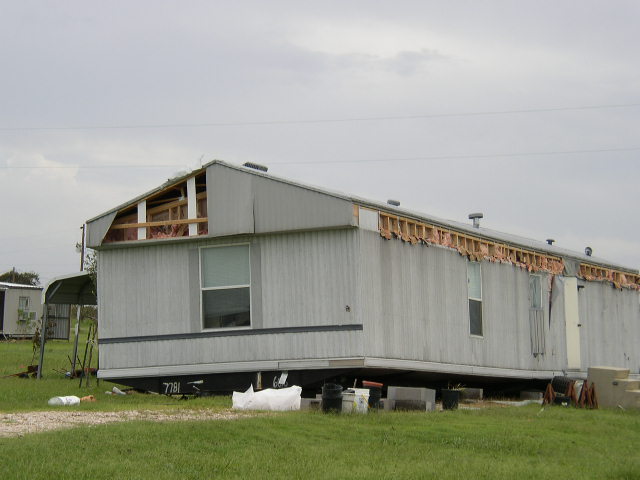
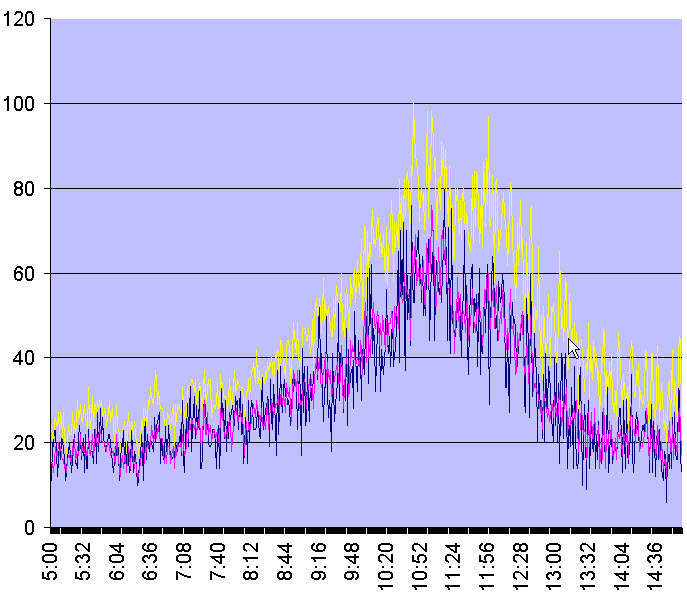
As Claudette was making landfall near Port O'Connor, the Hurricane Hunter Aircraft reported an additional drop in pressure down to 979 millibars. Based on this information maximum sustained winds could reach 85 to 90 mph. Claudette moved inland across Calhoun, Southern Victoria, and Goliad counties through the afternoon and early evening hours. Those communities who experienced the eye of the storm were impacted by hurricane force winds for up to 6 hours. Wind and damage reports relayed by HAM Radio operators in Port Lavaca, and Victoria were invaluable and resulted in the posting of a hurricane wind warning for the inland counties of Victoria and Goliad.
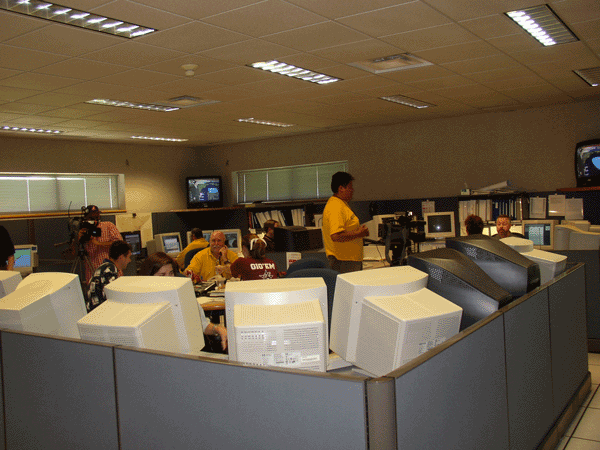
Forecast Operations
The National Weather Service in Corpus Christi was in constant communication with the NHC throughout the life of Claudette. Forecasters tracked the storm using the state of the art computer system called AWIPS (Automated Weather Information Processing System). Data flowed into AWIPS via satellite and across the internet keeping forecasters abreast of the storm latest developments. Hurricane hunter aircraft flying into the storm daily reported winds at flight level and aloft. Aircraft data in combination with weather balloon data from coastal ground stations was critical in determining where Claudette would track and how strong she would be. The National Weather Service Staff worked round the clock, 12 hour shifts from Sunday through Wednesday, providing information to Emergency Management officials, interviews to the media and fielding hundreds of calls from local citizens.
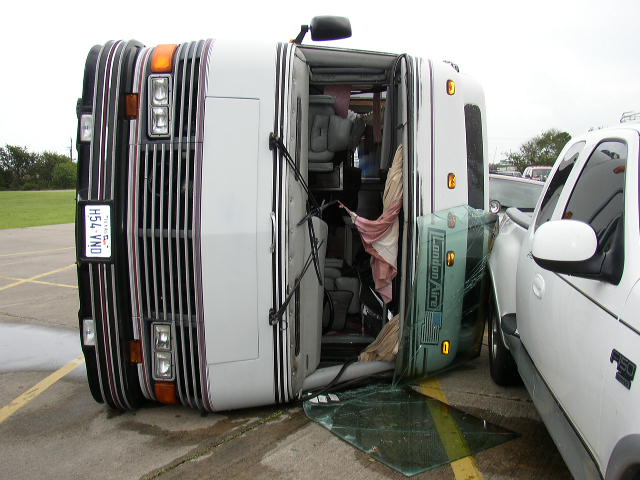
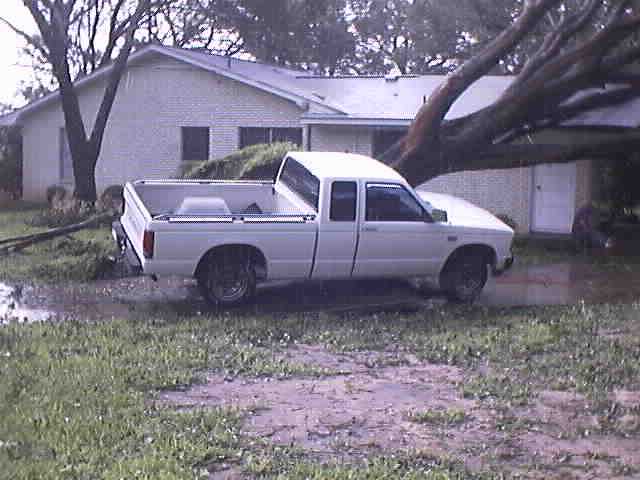
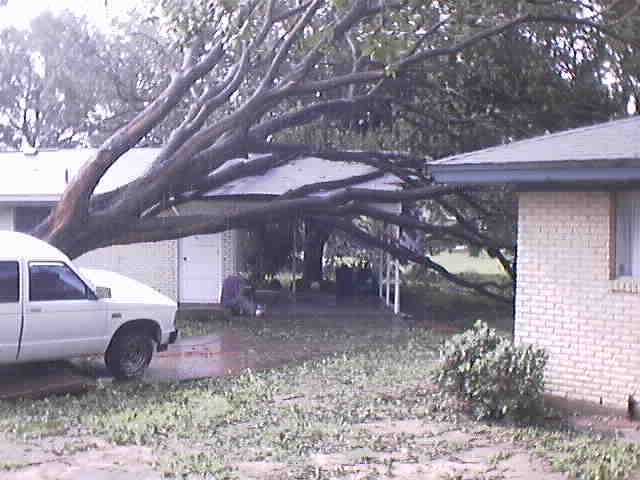
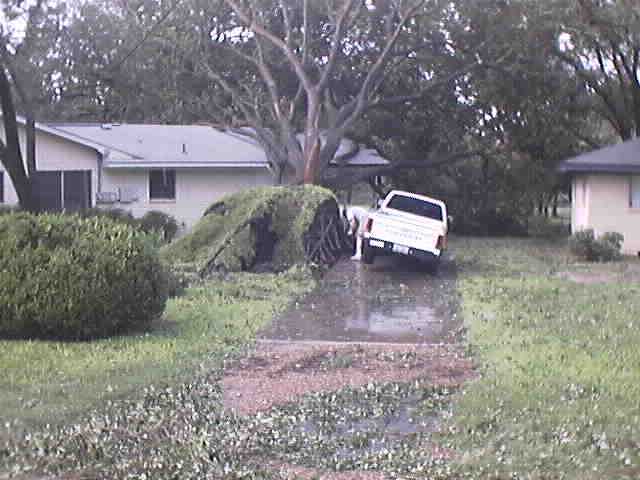
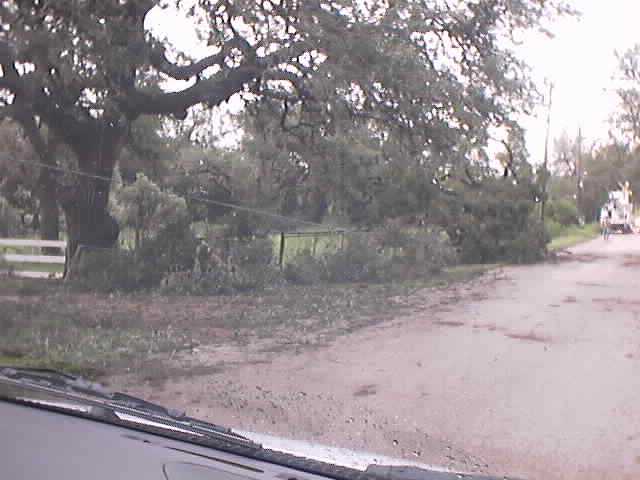
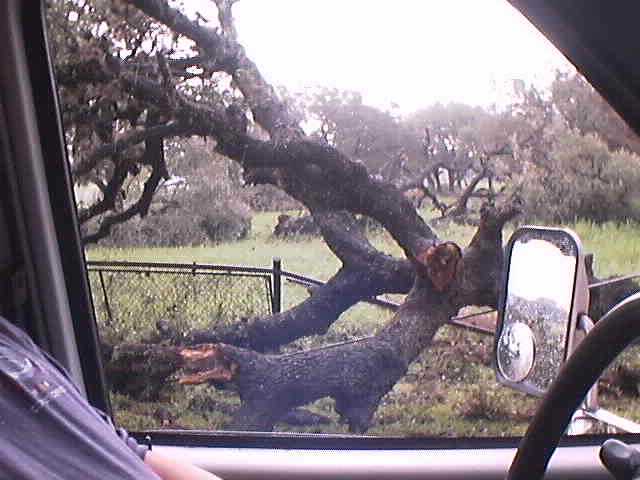
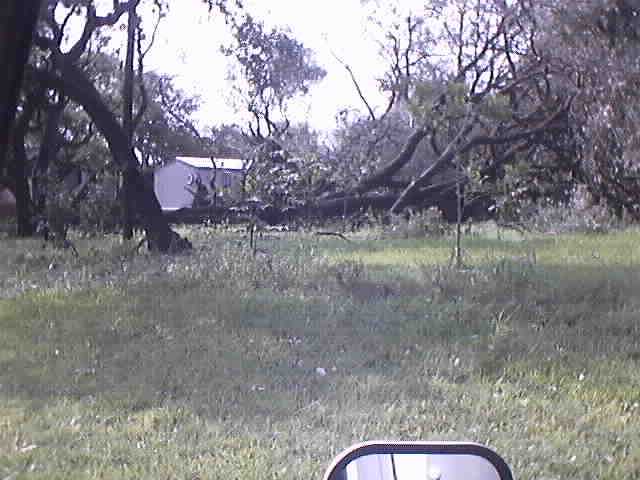
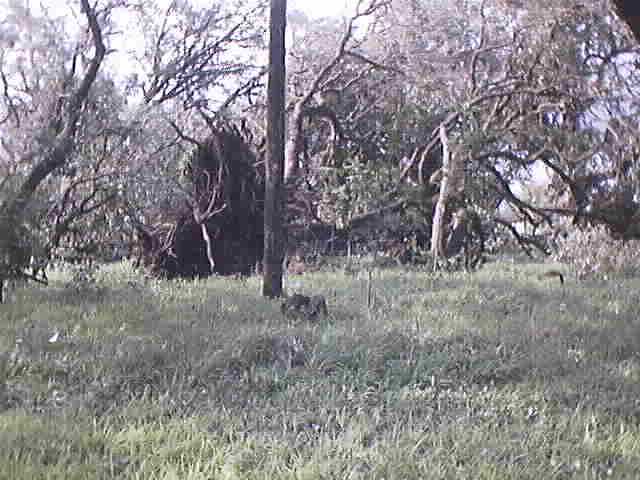
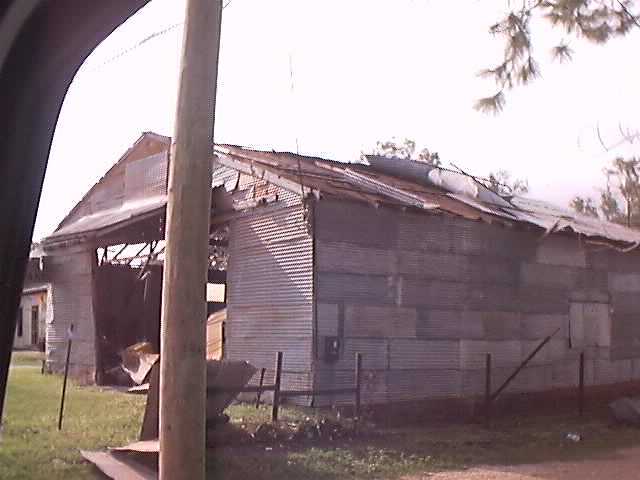
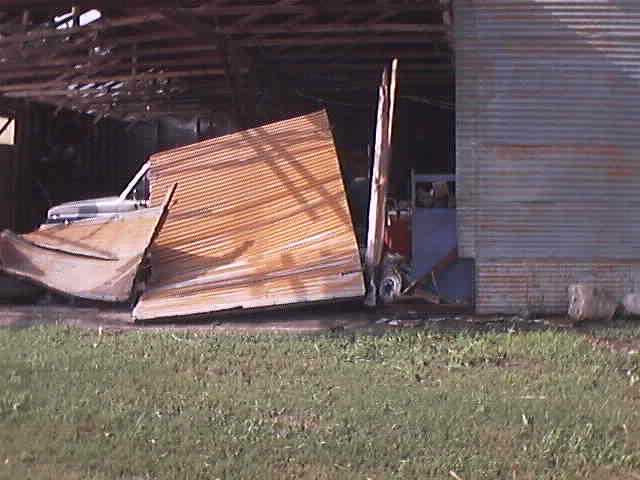
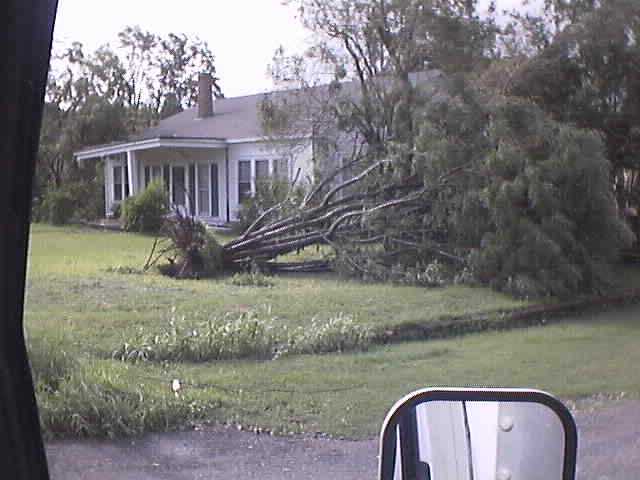
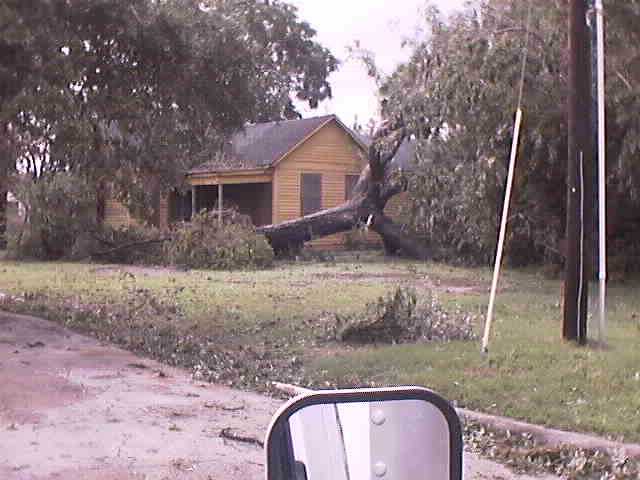
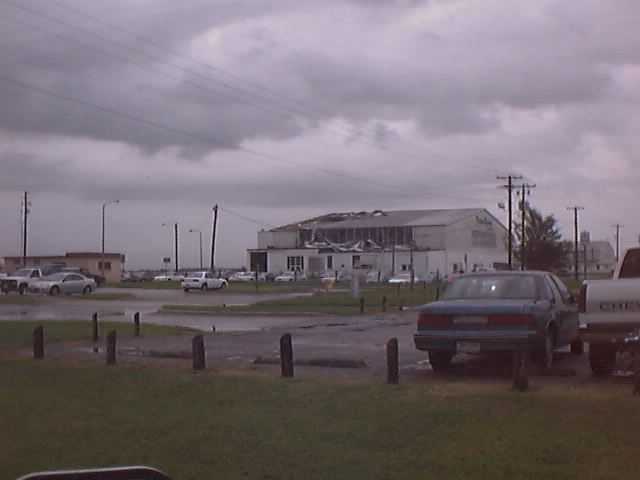
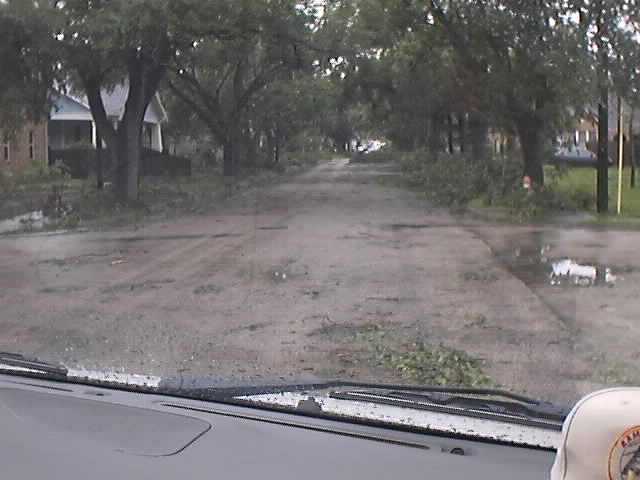
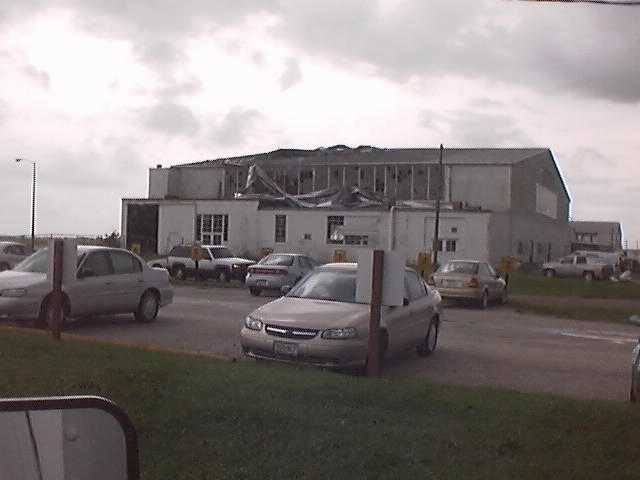
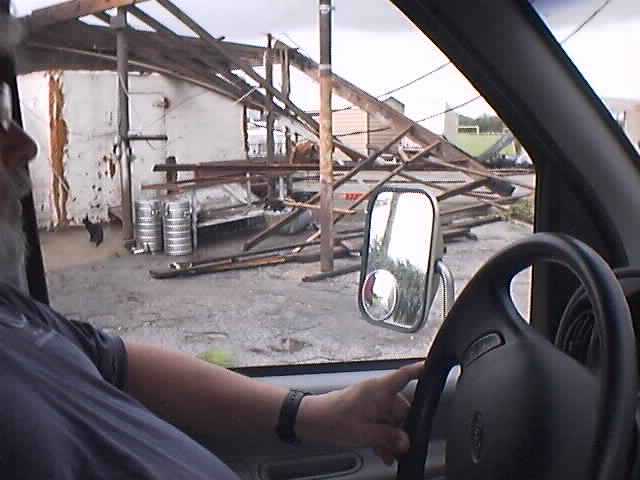
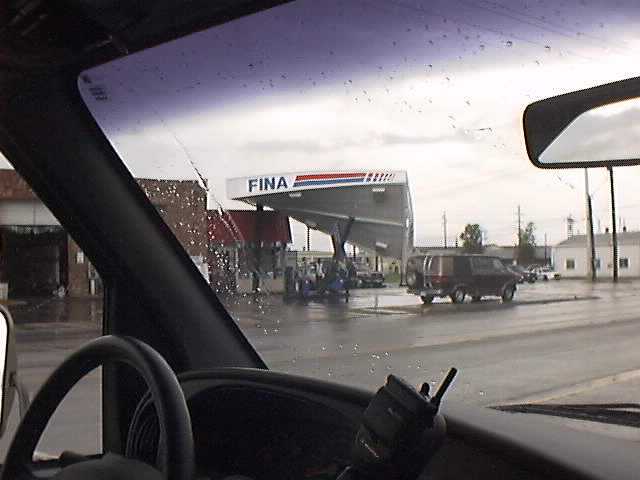
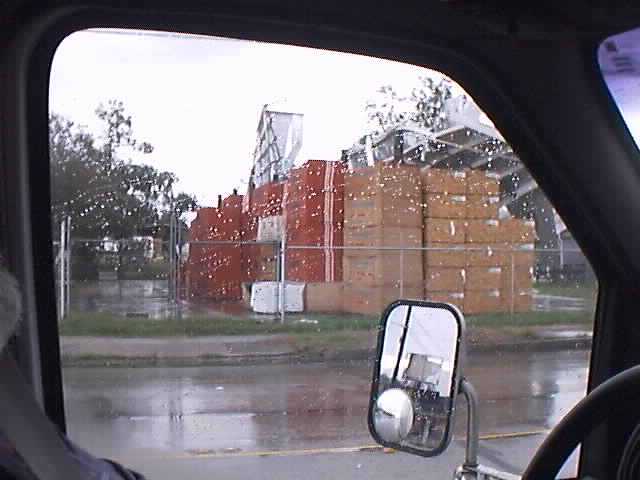
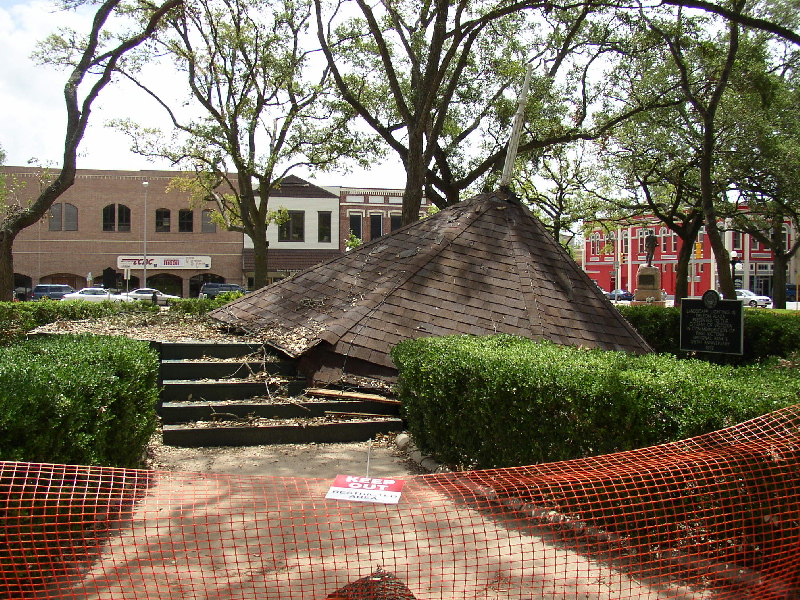
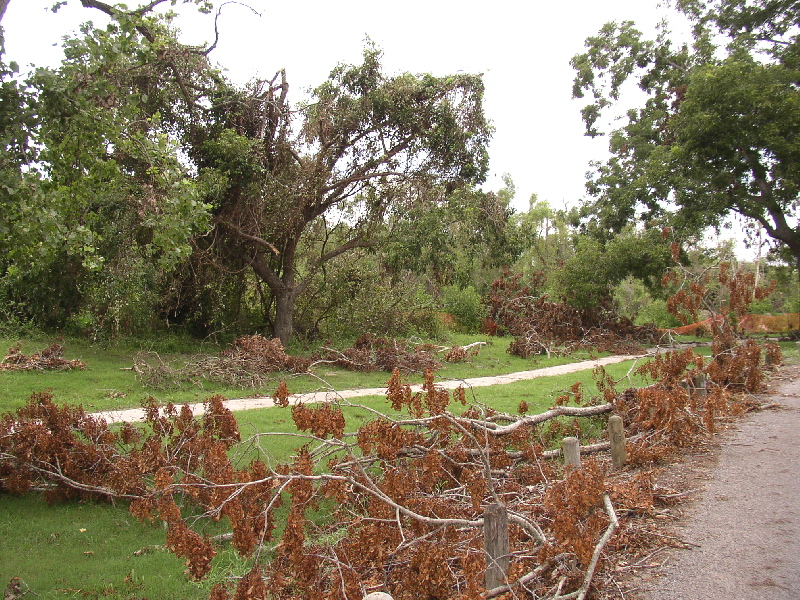
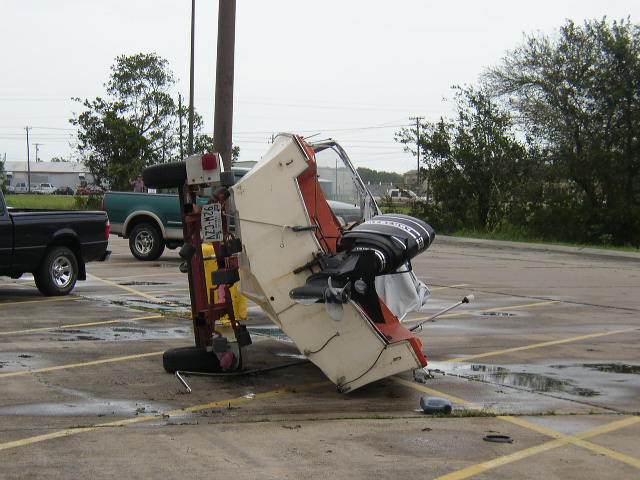
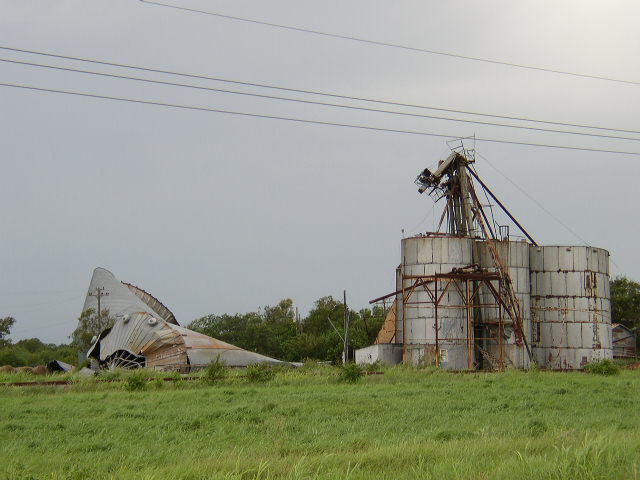
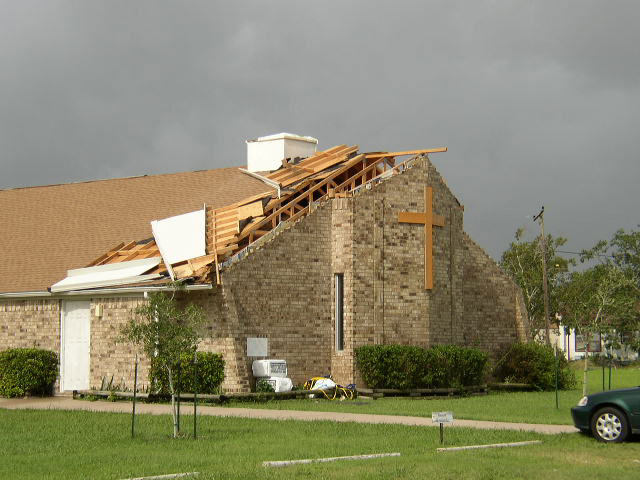
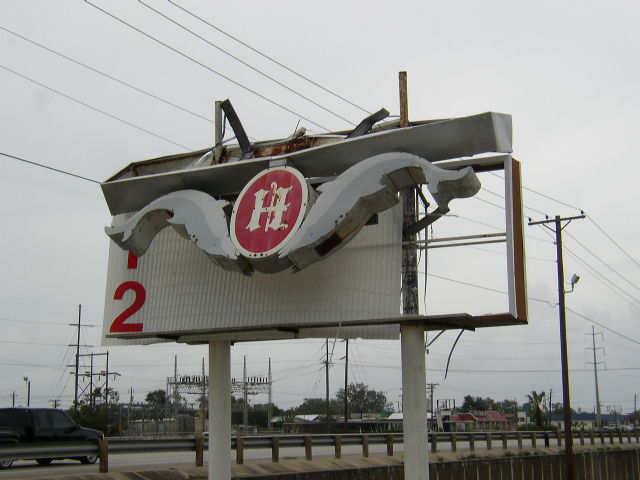
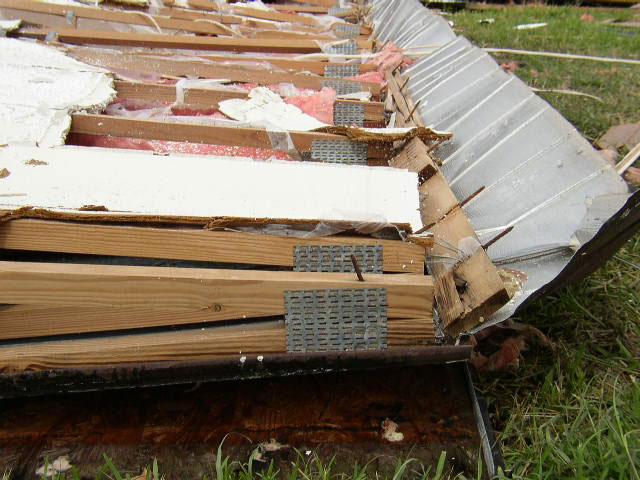
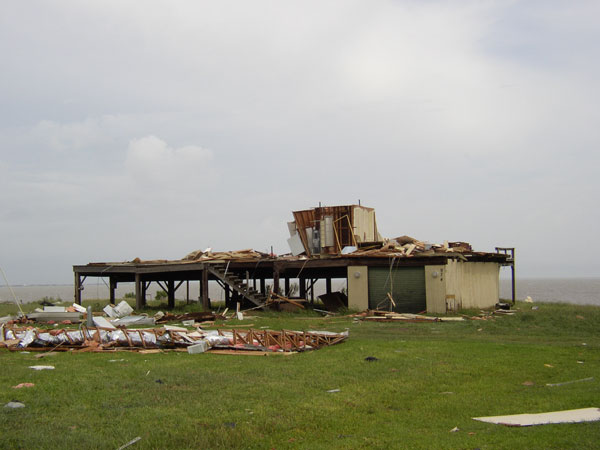
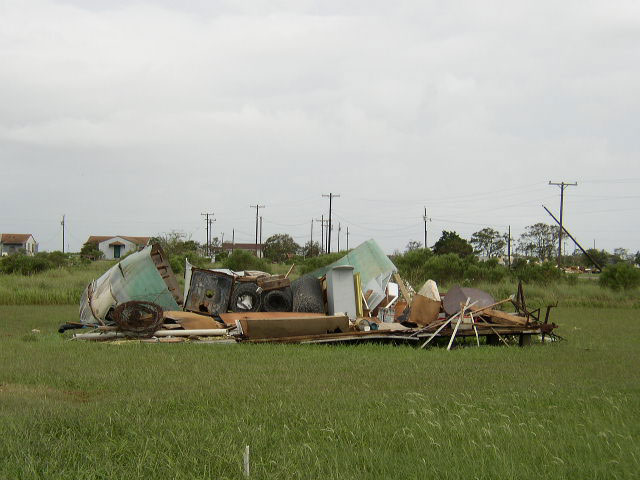
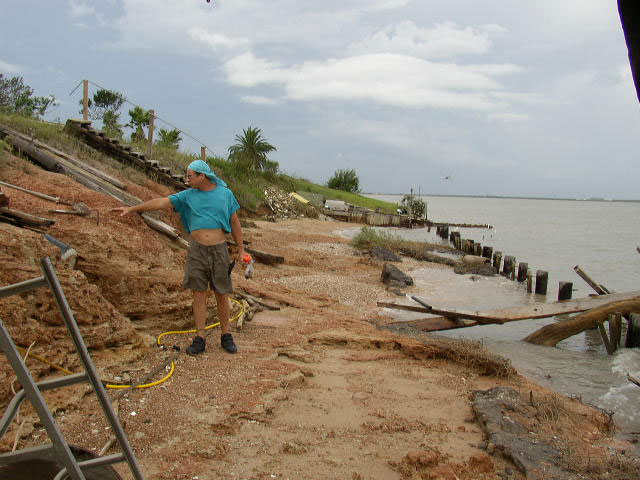
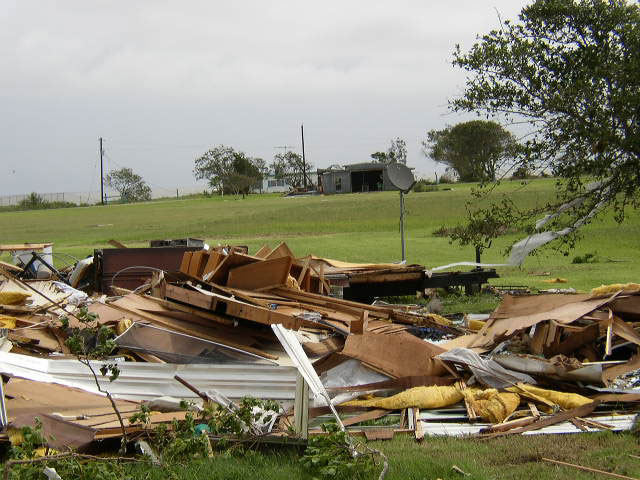
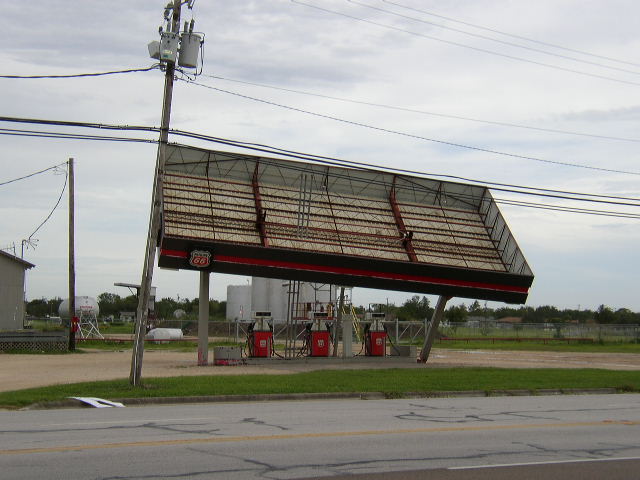
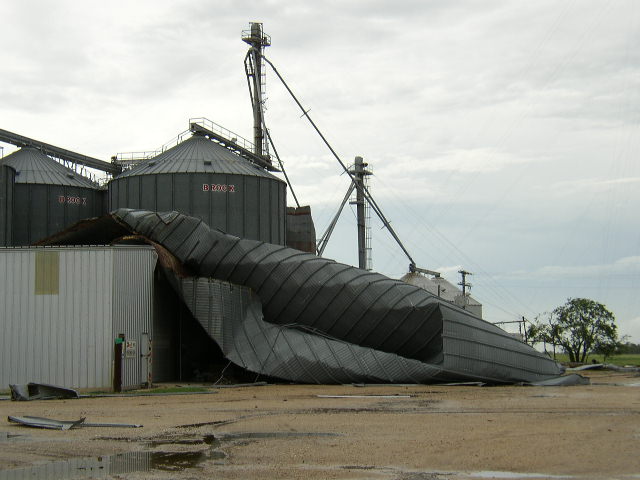
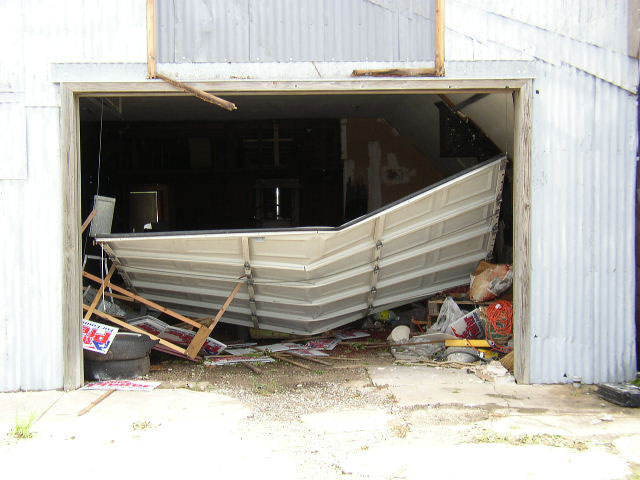
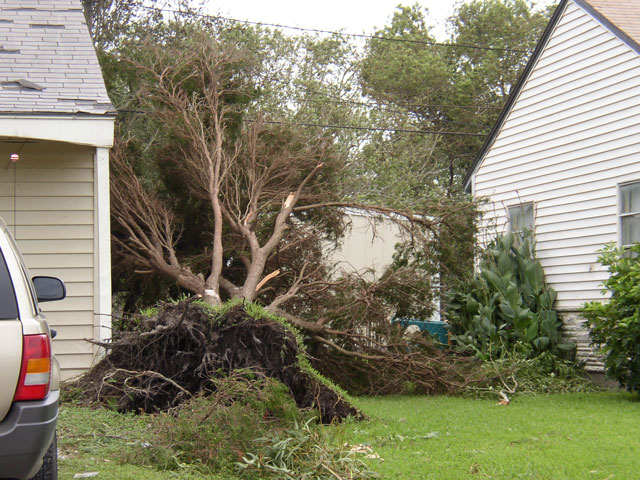
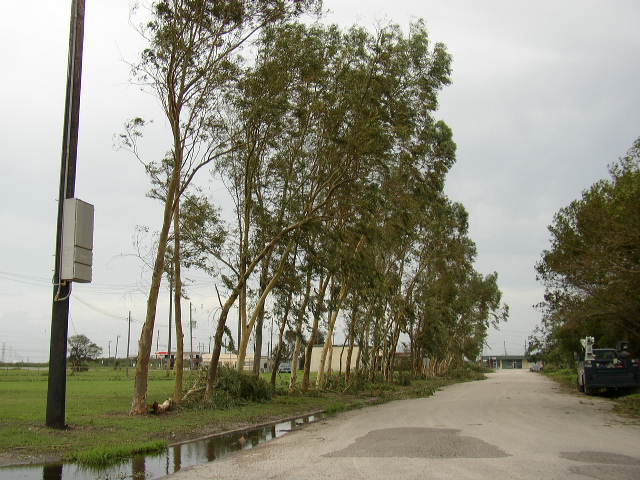
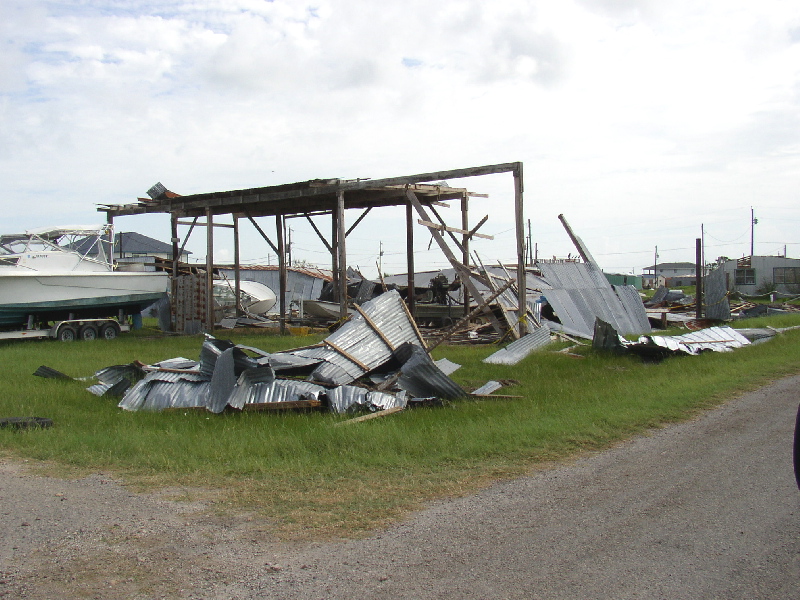
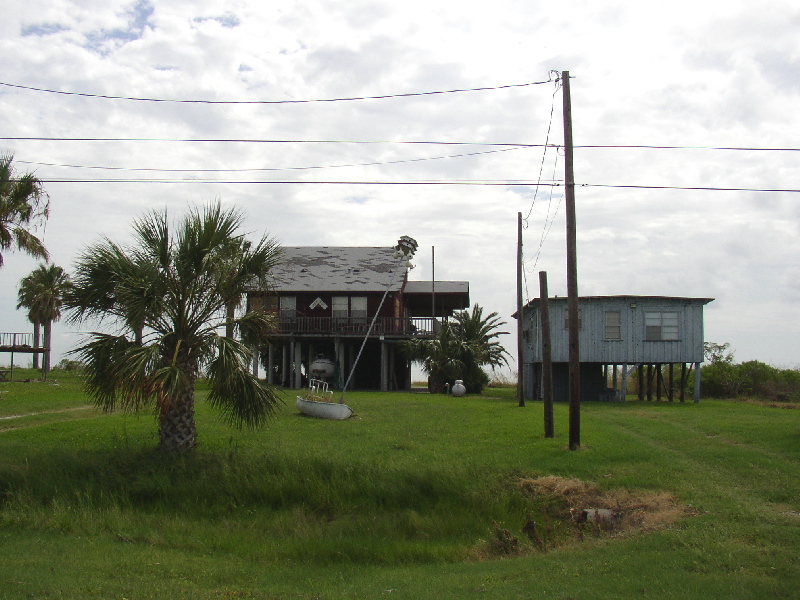
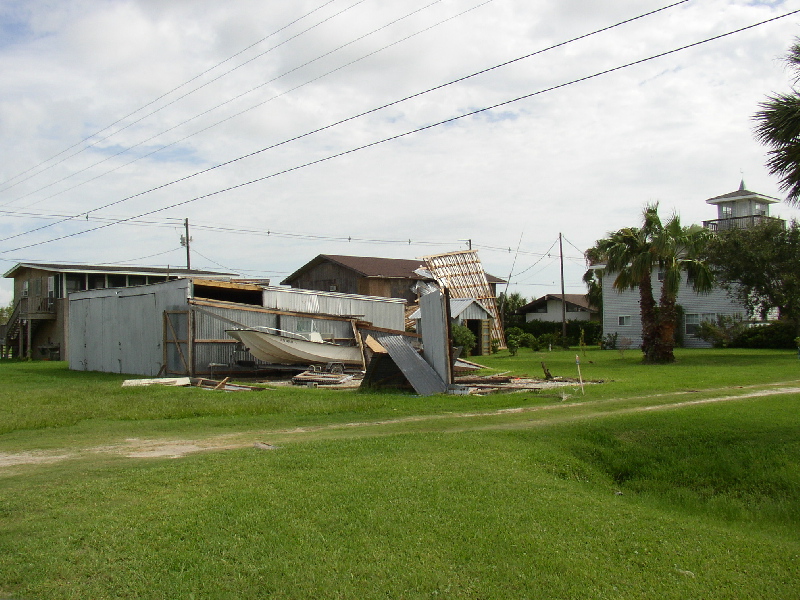
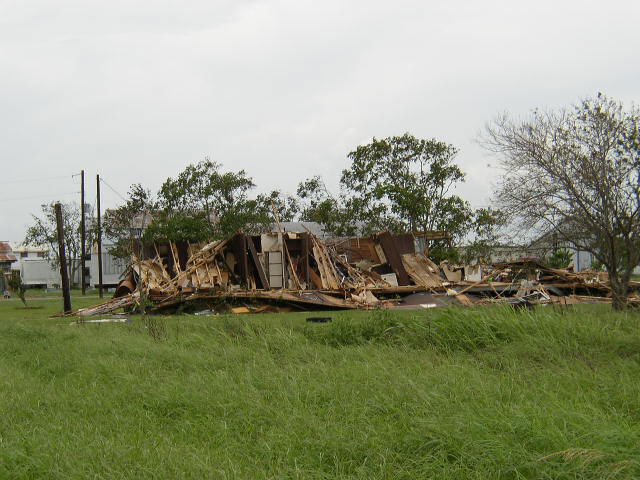
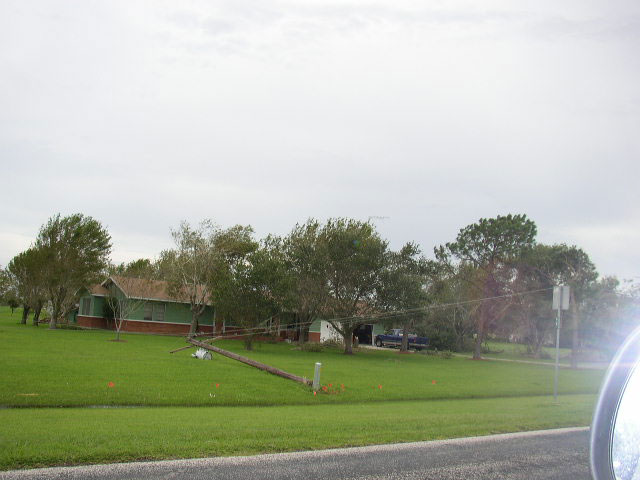
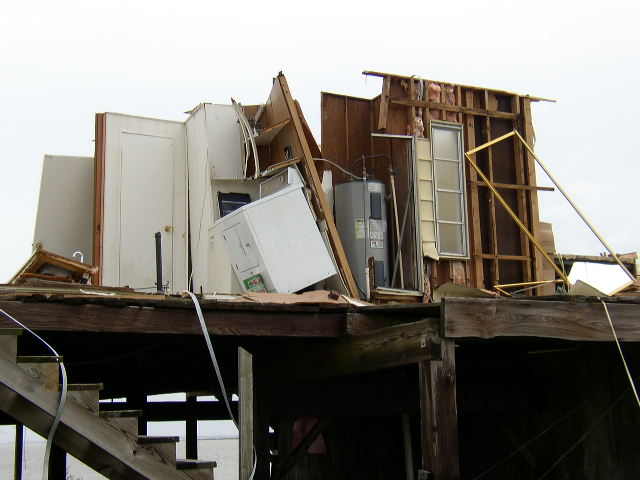
After the Storm
Two teams were dispatched to the impact areas on Wednesday July 16, to survey the damage, take photographs, recover wind measurements and obtain real life stories from those who weathered the storm. All the collected information will be sent to the NHC for post storm analysis to determine the exact strength of this hurricane. Max Mayfield, the director of the NHC, said it takes a couple weeks for all the data to be analyzed and a classification to be made on the strength of the storm.
Storm Survey
The data included in this storm survey is preliminary. Photographs and data in this report may be taken for personal use, but if using them, please make reference to the National Weather Service in Corpus Christi.
|