National Weather Service United States Department of Commerce
Customize Your Weather.gov

LOADING...

Probabilistic QPF Experiment

 
Expected Liquid Precip - Official NWS Forecast
Official NWS Forecast Liquid Precipitation Totals What's this?
High End Amount

1 in 10 Chance (10%) of Higher Liquid Precipitation

Maximum Potential Liquid Accumulation What's this?
Low End Amount

9 in 10 Chance (90%) of Higher Liquid Precipitation

Minimum Potential Liquid Accumulation What's this?
Percent Chance That Liquid Precipitation Amounts Will Be Greater Than...
Hover over thumbnails below to view larger image.
What's this?
>=0.01"
>=0.01"
>=0.1"
>=0.1"
>=0.25"
>=0.25"
>=0.50"
>=0.5"
>=1"
>=1"
>=2"
>=2"
>=4"
>=4"
>=6"
>=6"
>=8"
>=8"
Probability Graphic
Liquid Precipitation Totals by Location
These tables show the liquid precipitation forecast for individual locations. The tables provide the same information as the maps on this web page, just shown in a different way. All of these values are valid for the same time period as depicted on the graphics.
Location Low-End
Amount
Expected
Amount
High-End
Amount
Chance of Seeing More Than
Expected Liquid Precip - Official NWS Forecast
Official NWS Forecast Liquid Precipitation Totals What's this?
High End Amount

1 in 10 Chance (10%) of Higher Liquid Precipitation

Maximum Potential Liquid Accumulation What's this?
Low End Amount

9 in 10 Chance (90%) of Higher Liquid Precipitation

Minimum Potential Liquid Accumulation What's this?
Percent Chance That Liquid Precipitation Amounts Will Be Greater Than...
Hover over thumbnails below to view larger image.
What's this?
>=0.01"
>=0.01"
>=0.1"
>=0.1"
>=0.25"
>=0.25"
>=0.50"
>=0.5"
>=1"
>=1"
>=2"
>=2"
>=4"
>=4"
>=6"
>=6"
>=8"
>=8"
Probability Graphic
Long Range Forecast
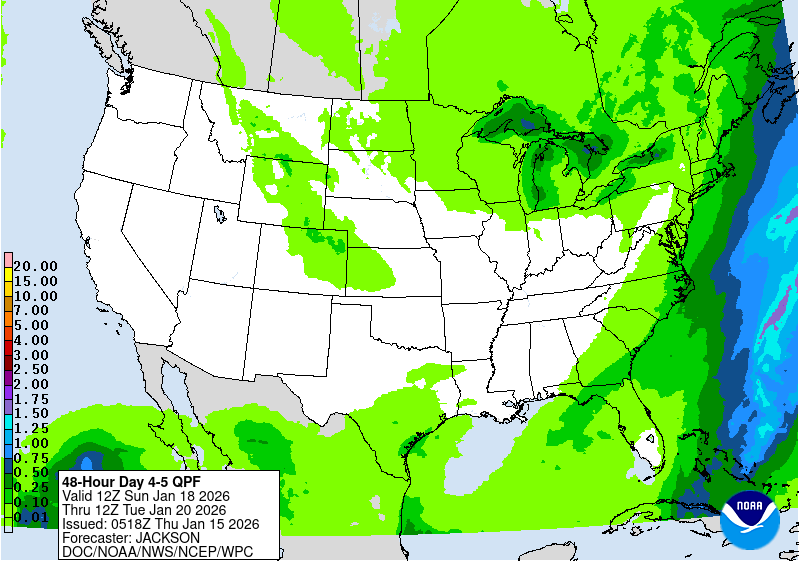
Days 4-5 Forecast Precipitation
...
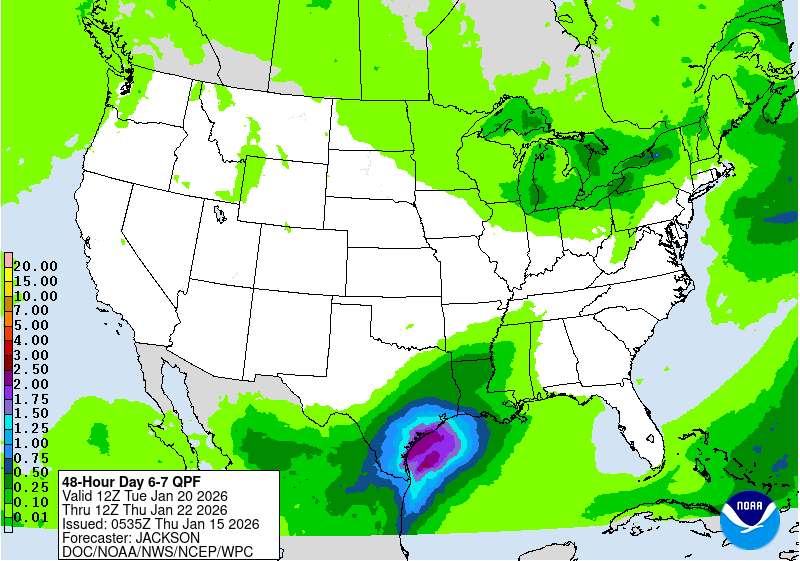
Days 6-7 Forecast Precipitation
...
Days 6-10
Temperature
...
Precipitation
...
Days 8-14
Temperature
...
Precipitation
...
Weeks 3-4
Temperature
...
Precipitation
...