Overview
| A surface low pressure system from the Midwest moved east across the area on Tuesday, August 6, 2024, along a stationary boundary that was draped across the region for the majority of the day. Surface features were supported by an upper level shortwave trough moving southeast across the region in addition to being underneath the right entrance region of the upper level jet and vorticity maximum. MUCAPE values across the area approached 3000 J/kg with shear values of 30 to 40 knots as the low-level jet pushed north across the area. Strong updrafts were evident with ample moisture of dewpoints in the 70s and 0 to 1 km storm-relative helicity values exceeding 100 m2/s2 in addition to steep low-level lapse rates. Hodographs supported supercell and tornadic potential near the boundary owing to the multiple tornadoes, macrobursts, and strong bowing segments observed during the event. Five EF-1 tornadoes and widespread straight-line wind damage occurred across Northeast Ohio. Over 400,000 residents were left without power, the most significant number since the July 1993 storms. Cuyahoga, Lake, and Geauga Counties were hit especially hard with over half of residents experiencing power outages. A state of emergency was declared for Ashtabula, Cuyahoga, Geauga, Lake, Portage, Summit, and Trumbull Counties. |
 Mid-level water vapor loop from 8 AM to 8 PM on August 6, 2024. Note the strong shortwave across the Lower Great Lakes region in addition to Tropical Storm Debby spinning off the Southeast Coast. |
Tornadoes:
|
Tornado - Avon-Rocky River, OH
|
||||||||||||||||
|
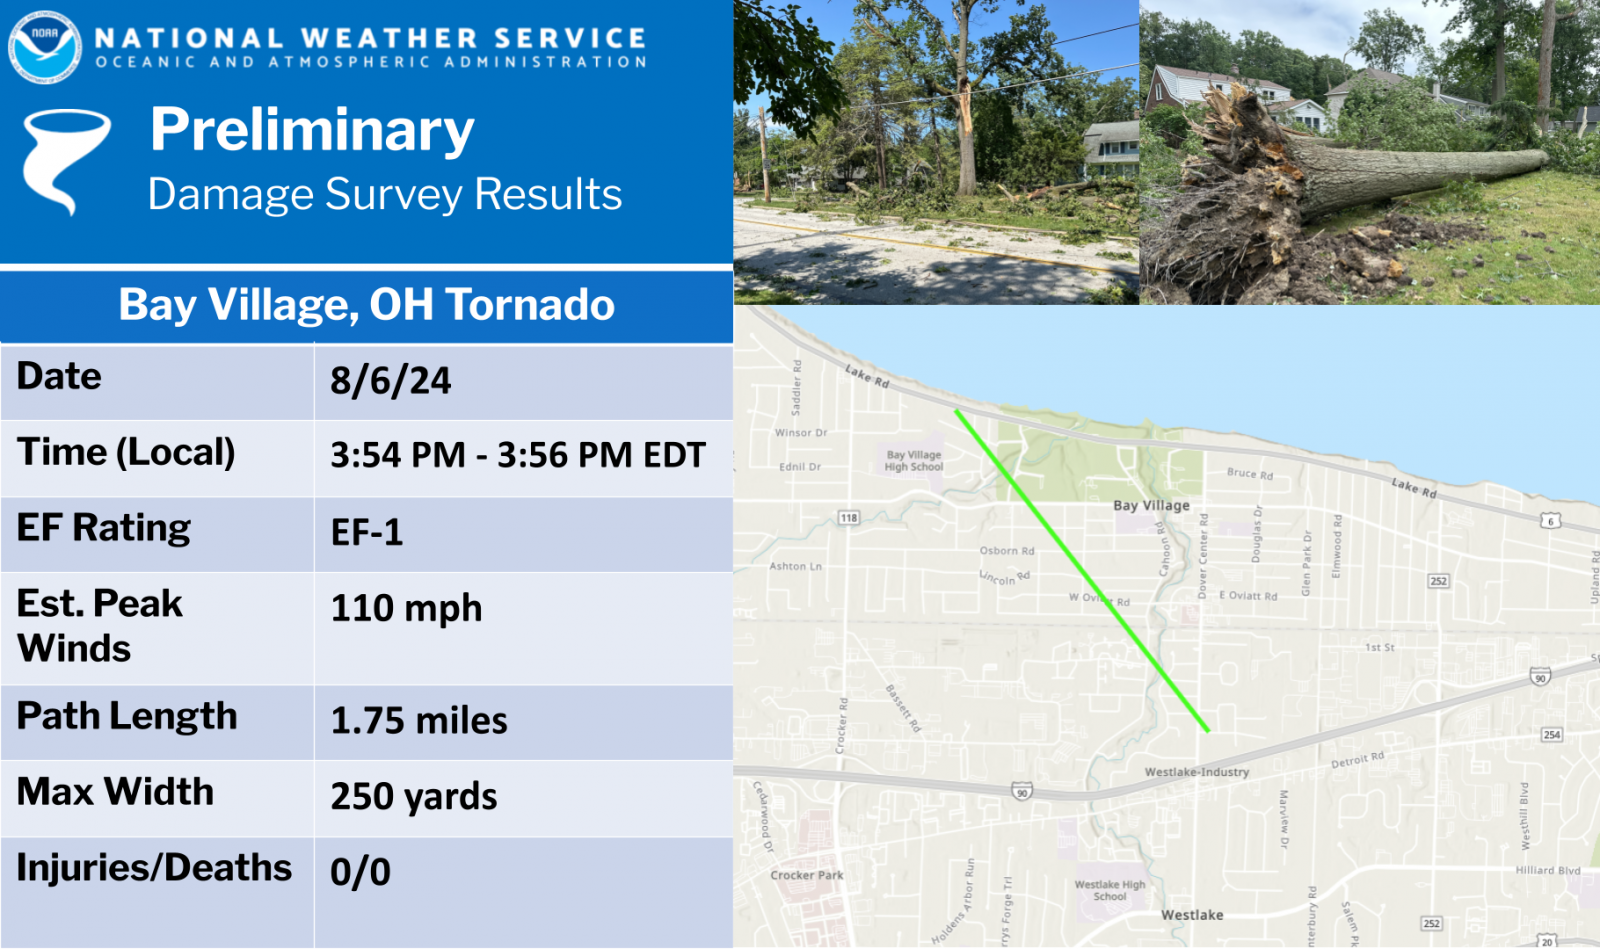
Tornado - Bay Village, OH
|
||||||||||||||||
|
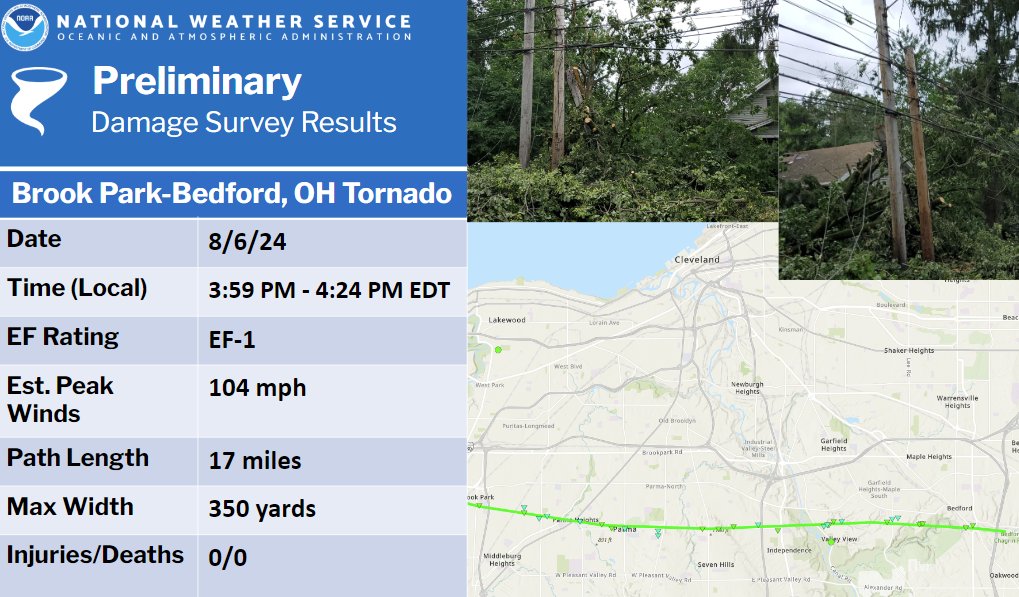
Tornado - Brook Park-Bedford, OH
|
||||||||||||||||
|
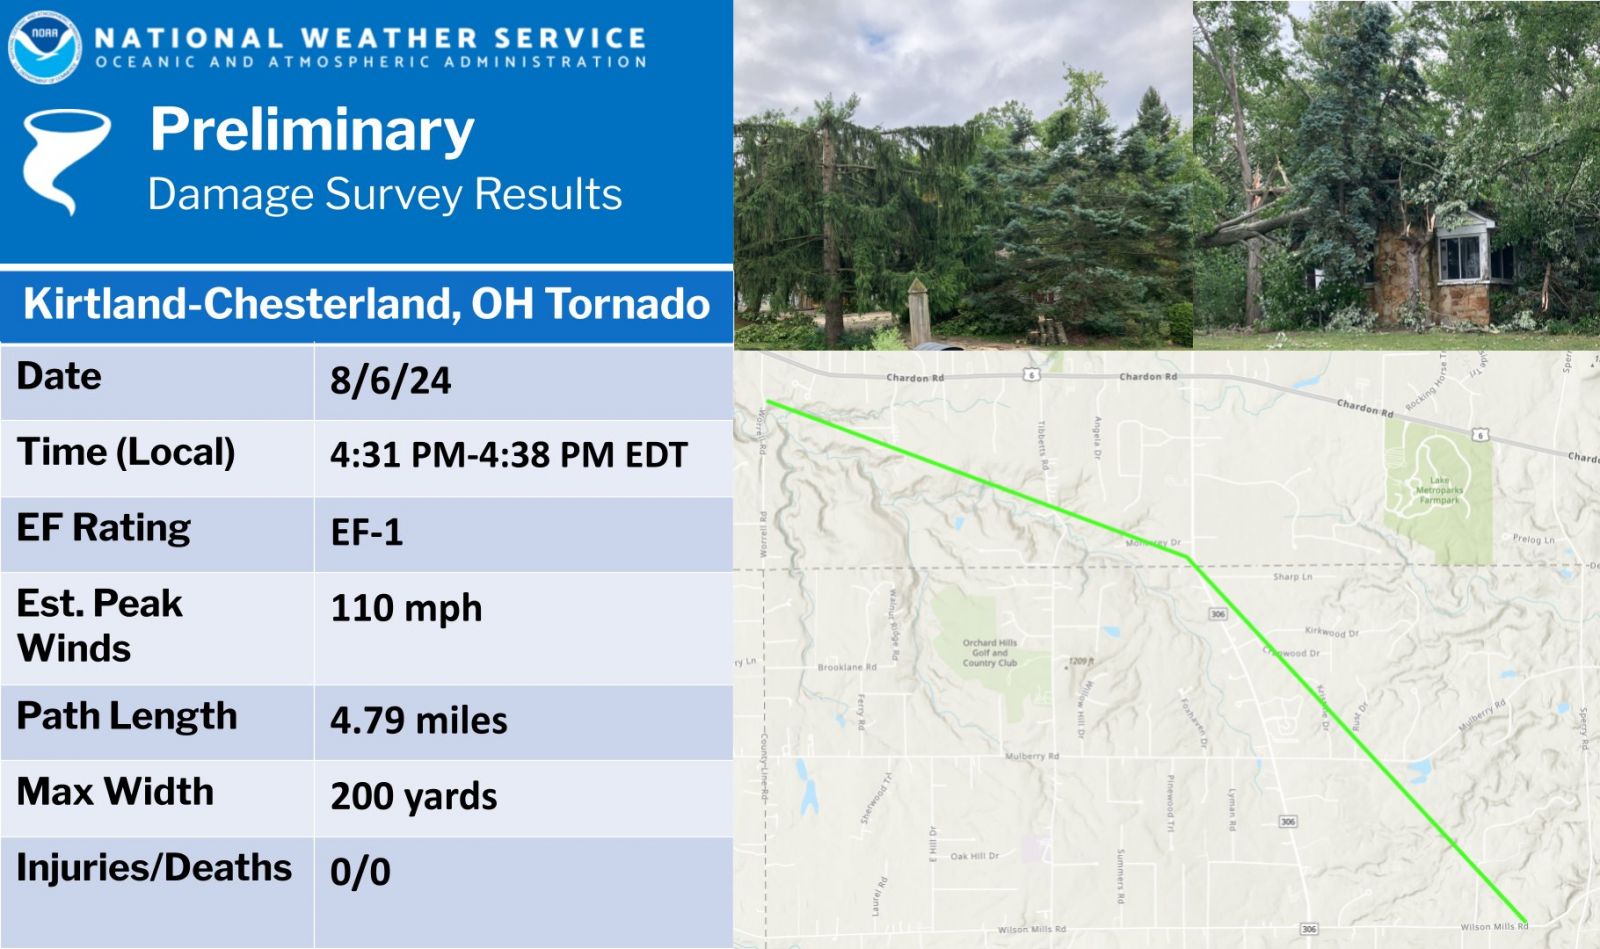
Tornado - Kirtland-Chesterland, OH
|
||||||||||||||||
|
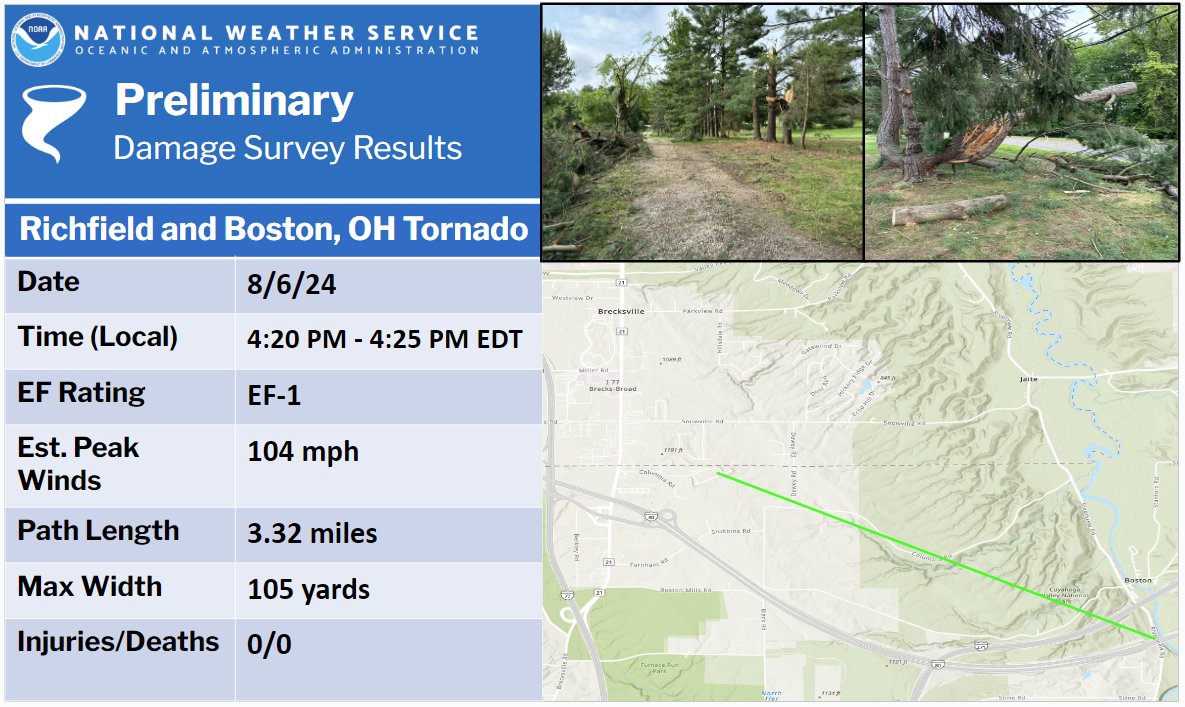
Tornado - Richfield-Boston, OH
|
||||||||||||||||
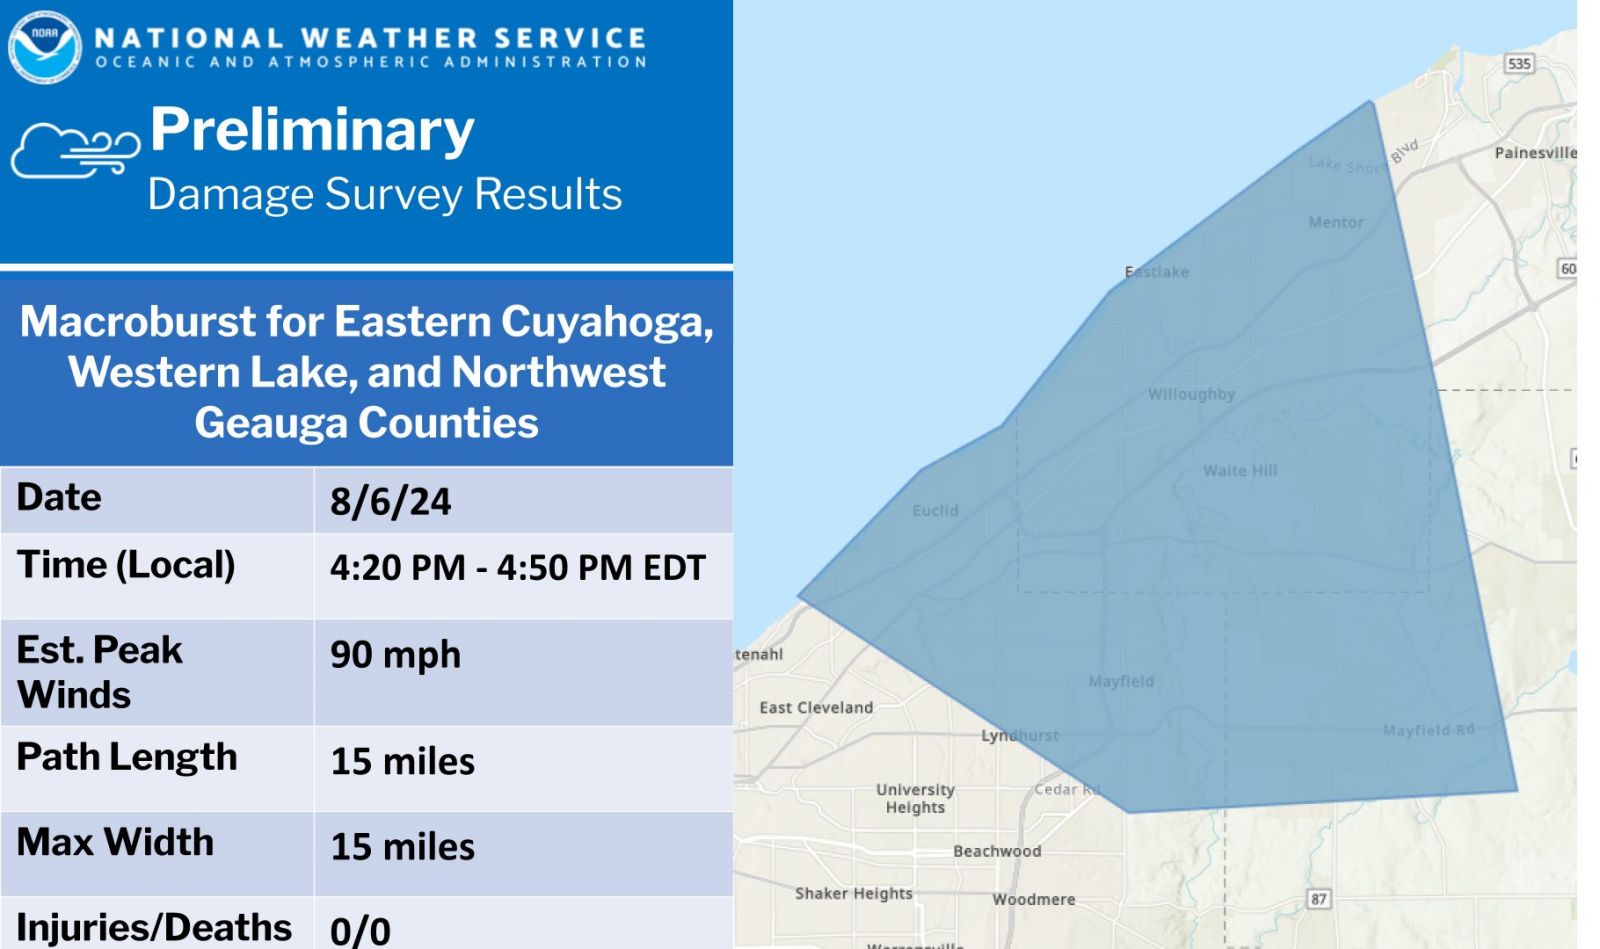
Straight-Line Wind:
|
Macroburst
|
||||||||||||||
The Enhanced Fujita (EF) Scale classifies tornadoes into the following categories:
| EF0 Weak 65-85 mph |
EF1 Moderate 86-110 mph |
EF2 Significant 111-135 mph |
EF3 Severe 136-165 mph |
EF4 Extreme 166-200 mph |
EF5 Catastrophic 200+ mph |
 |
|||||
Photos & Video
 |
 |
 |
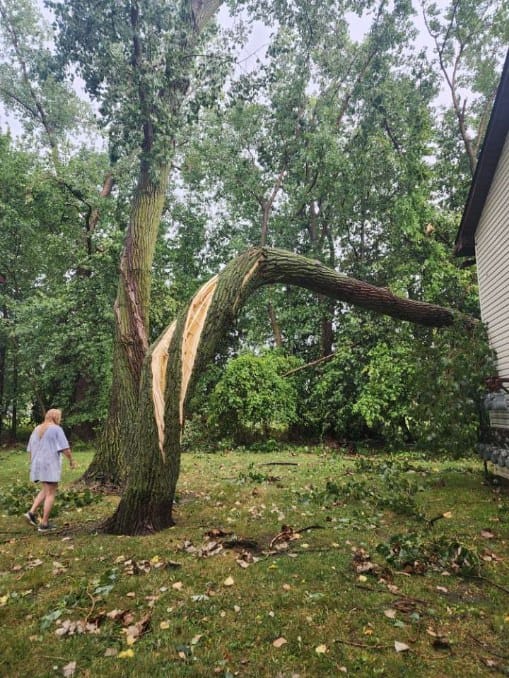 |
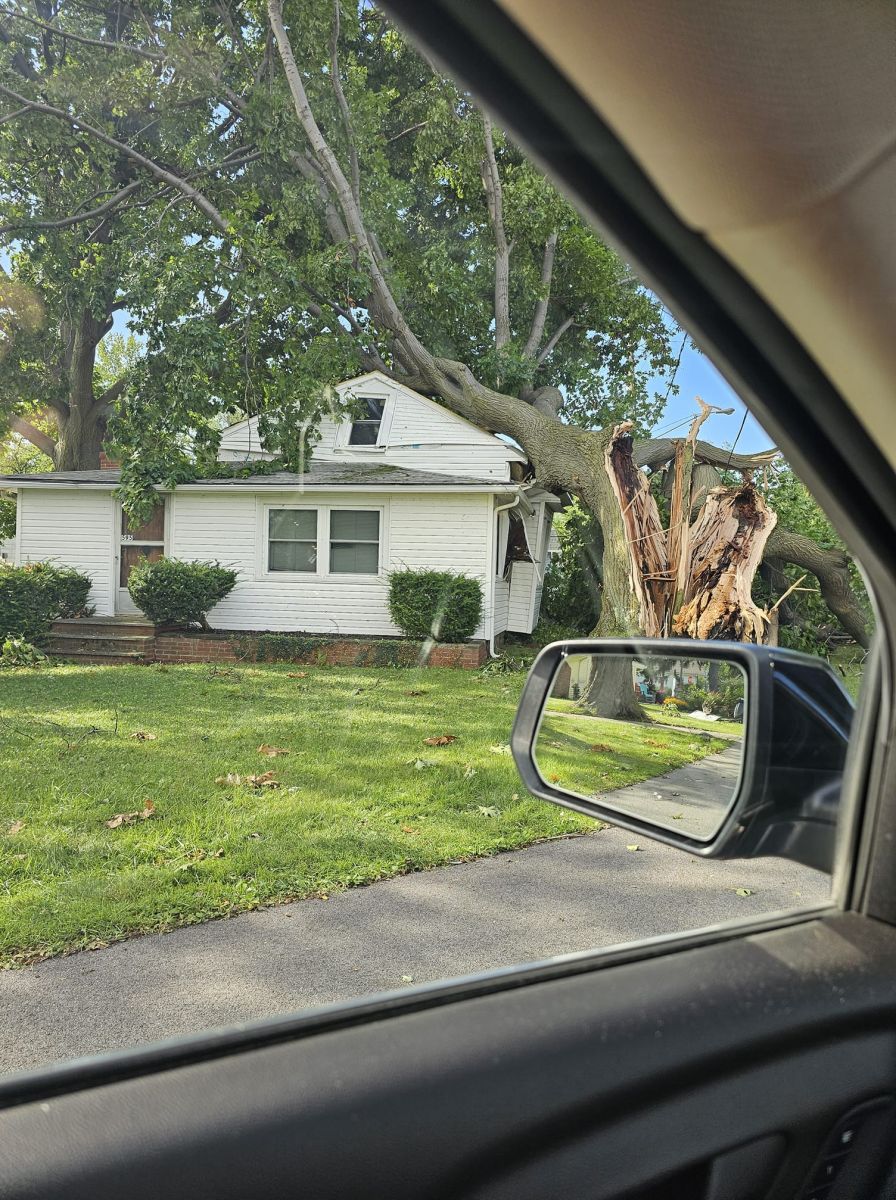
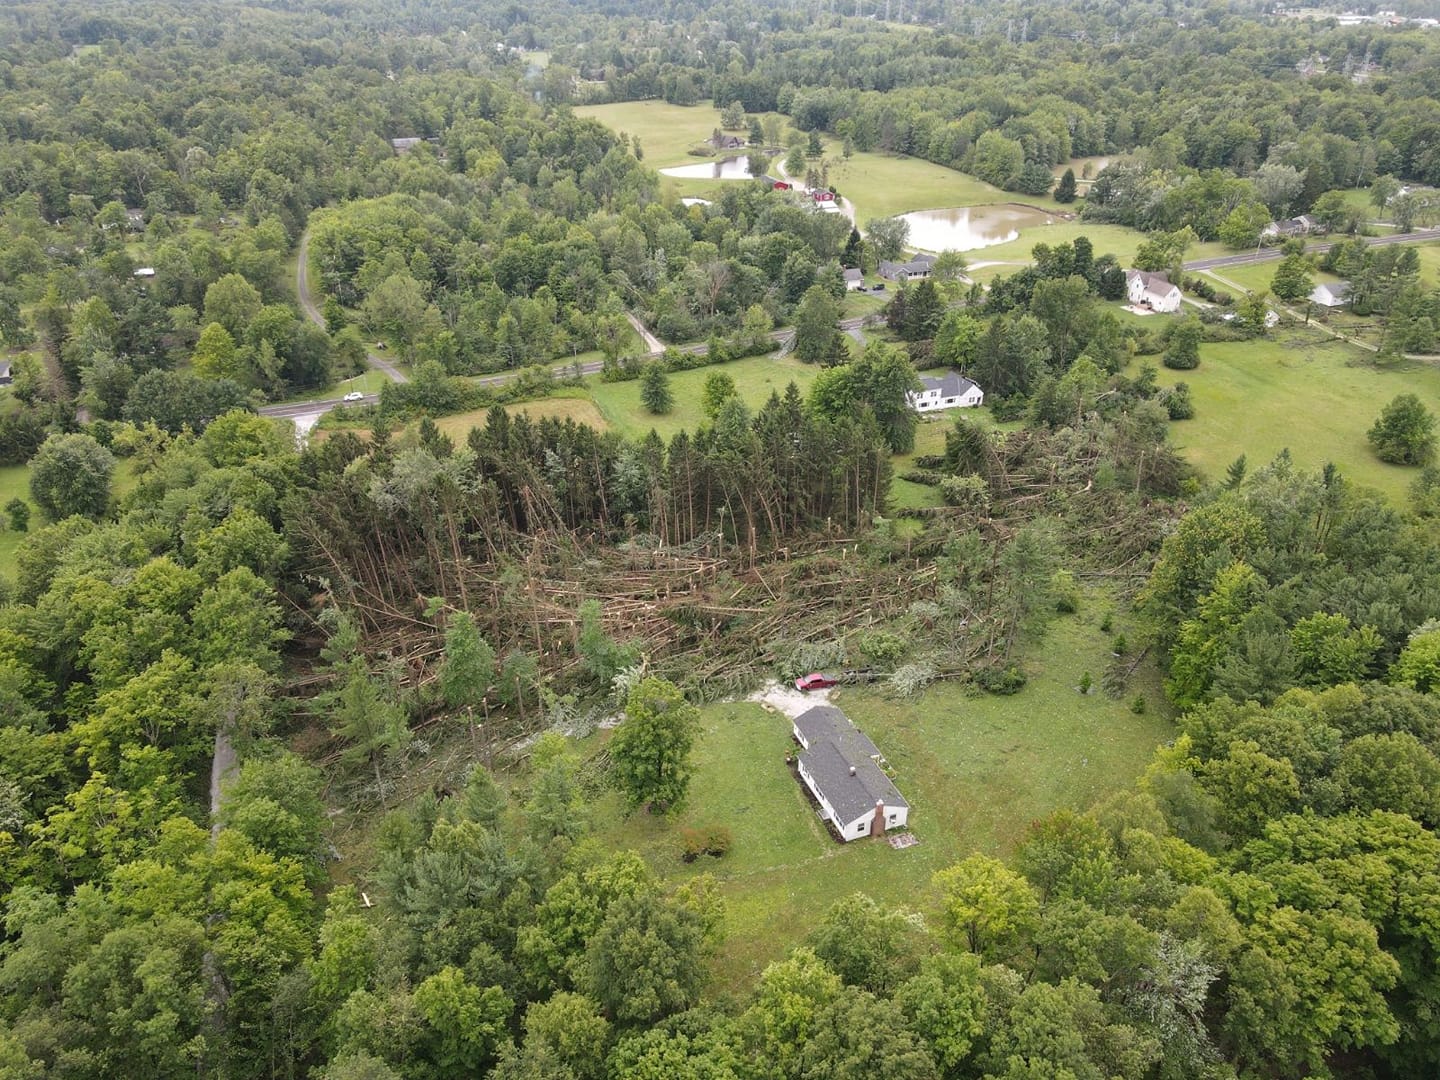
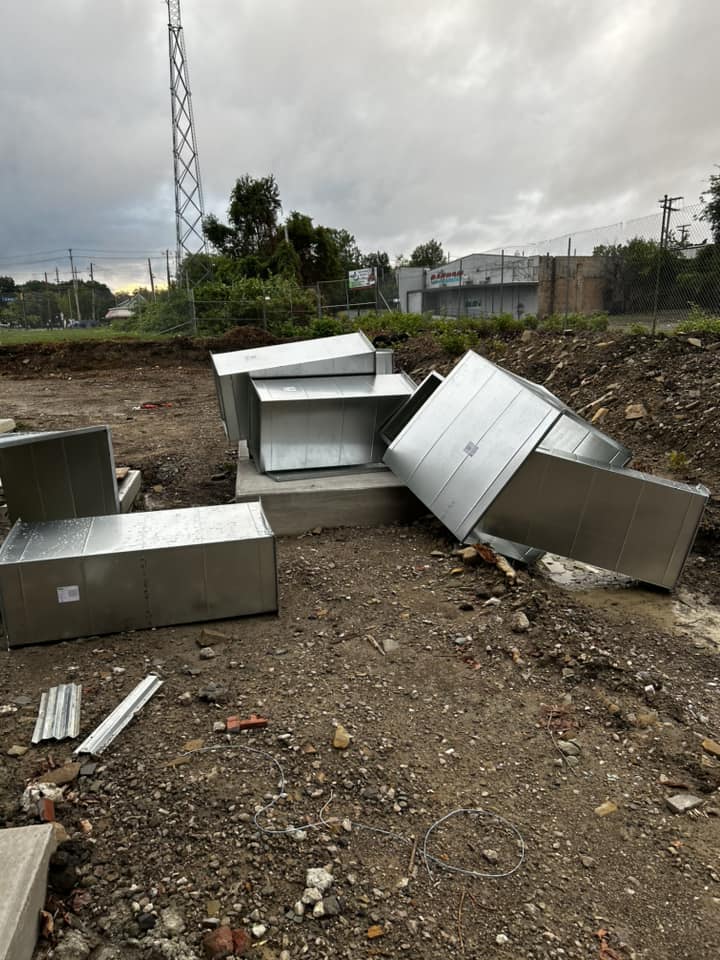
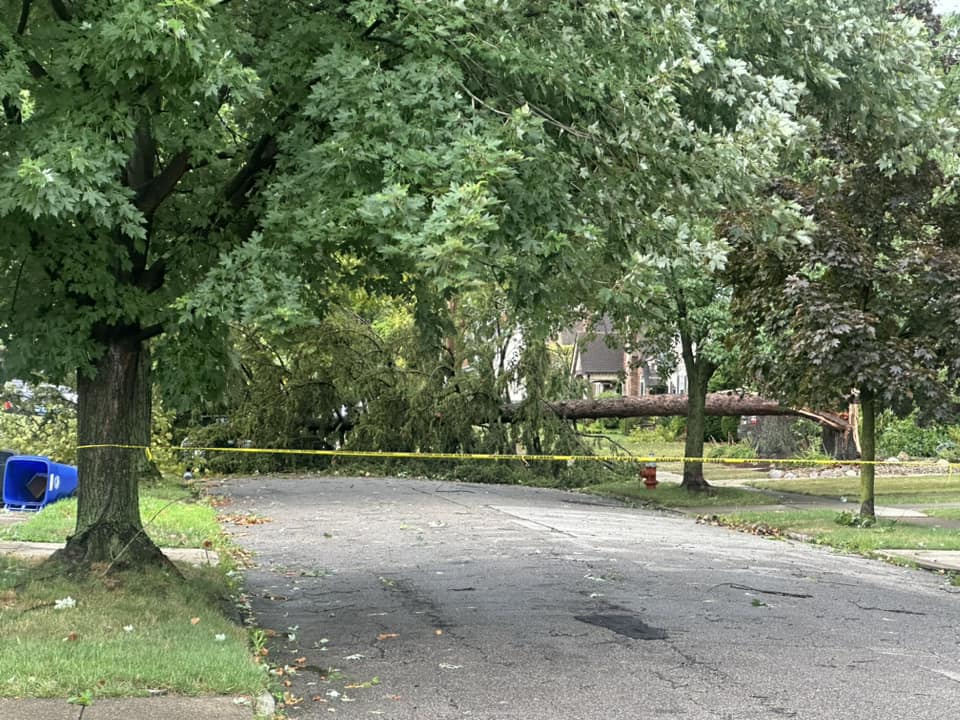
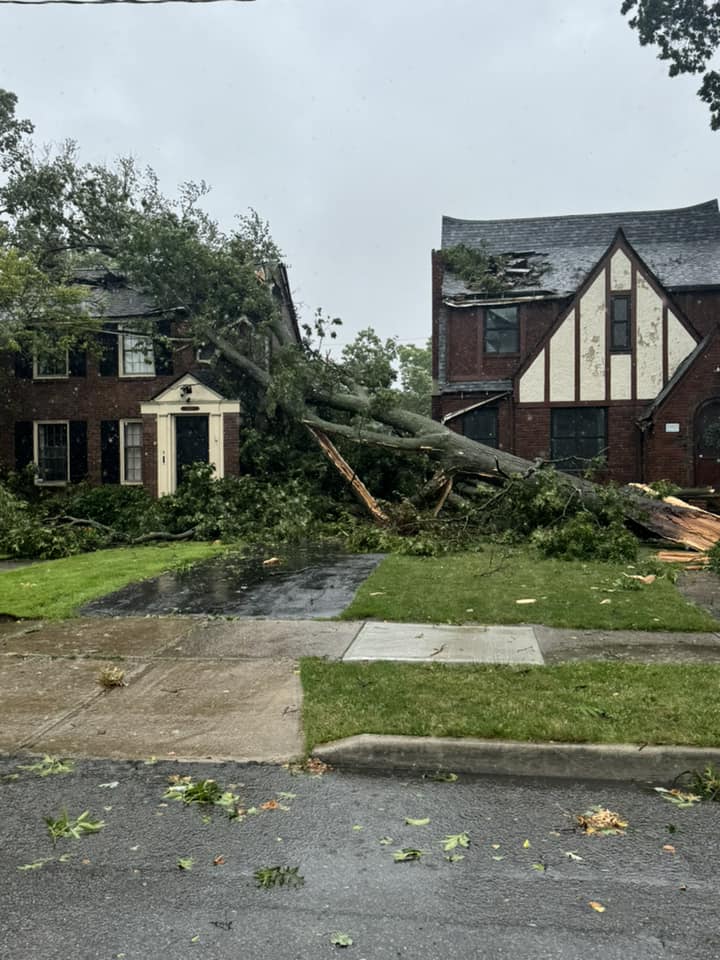
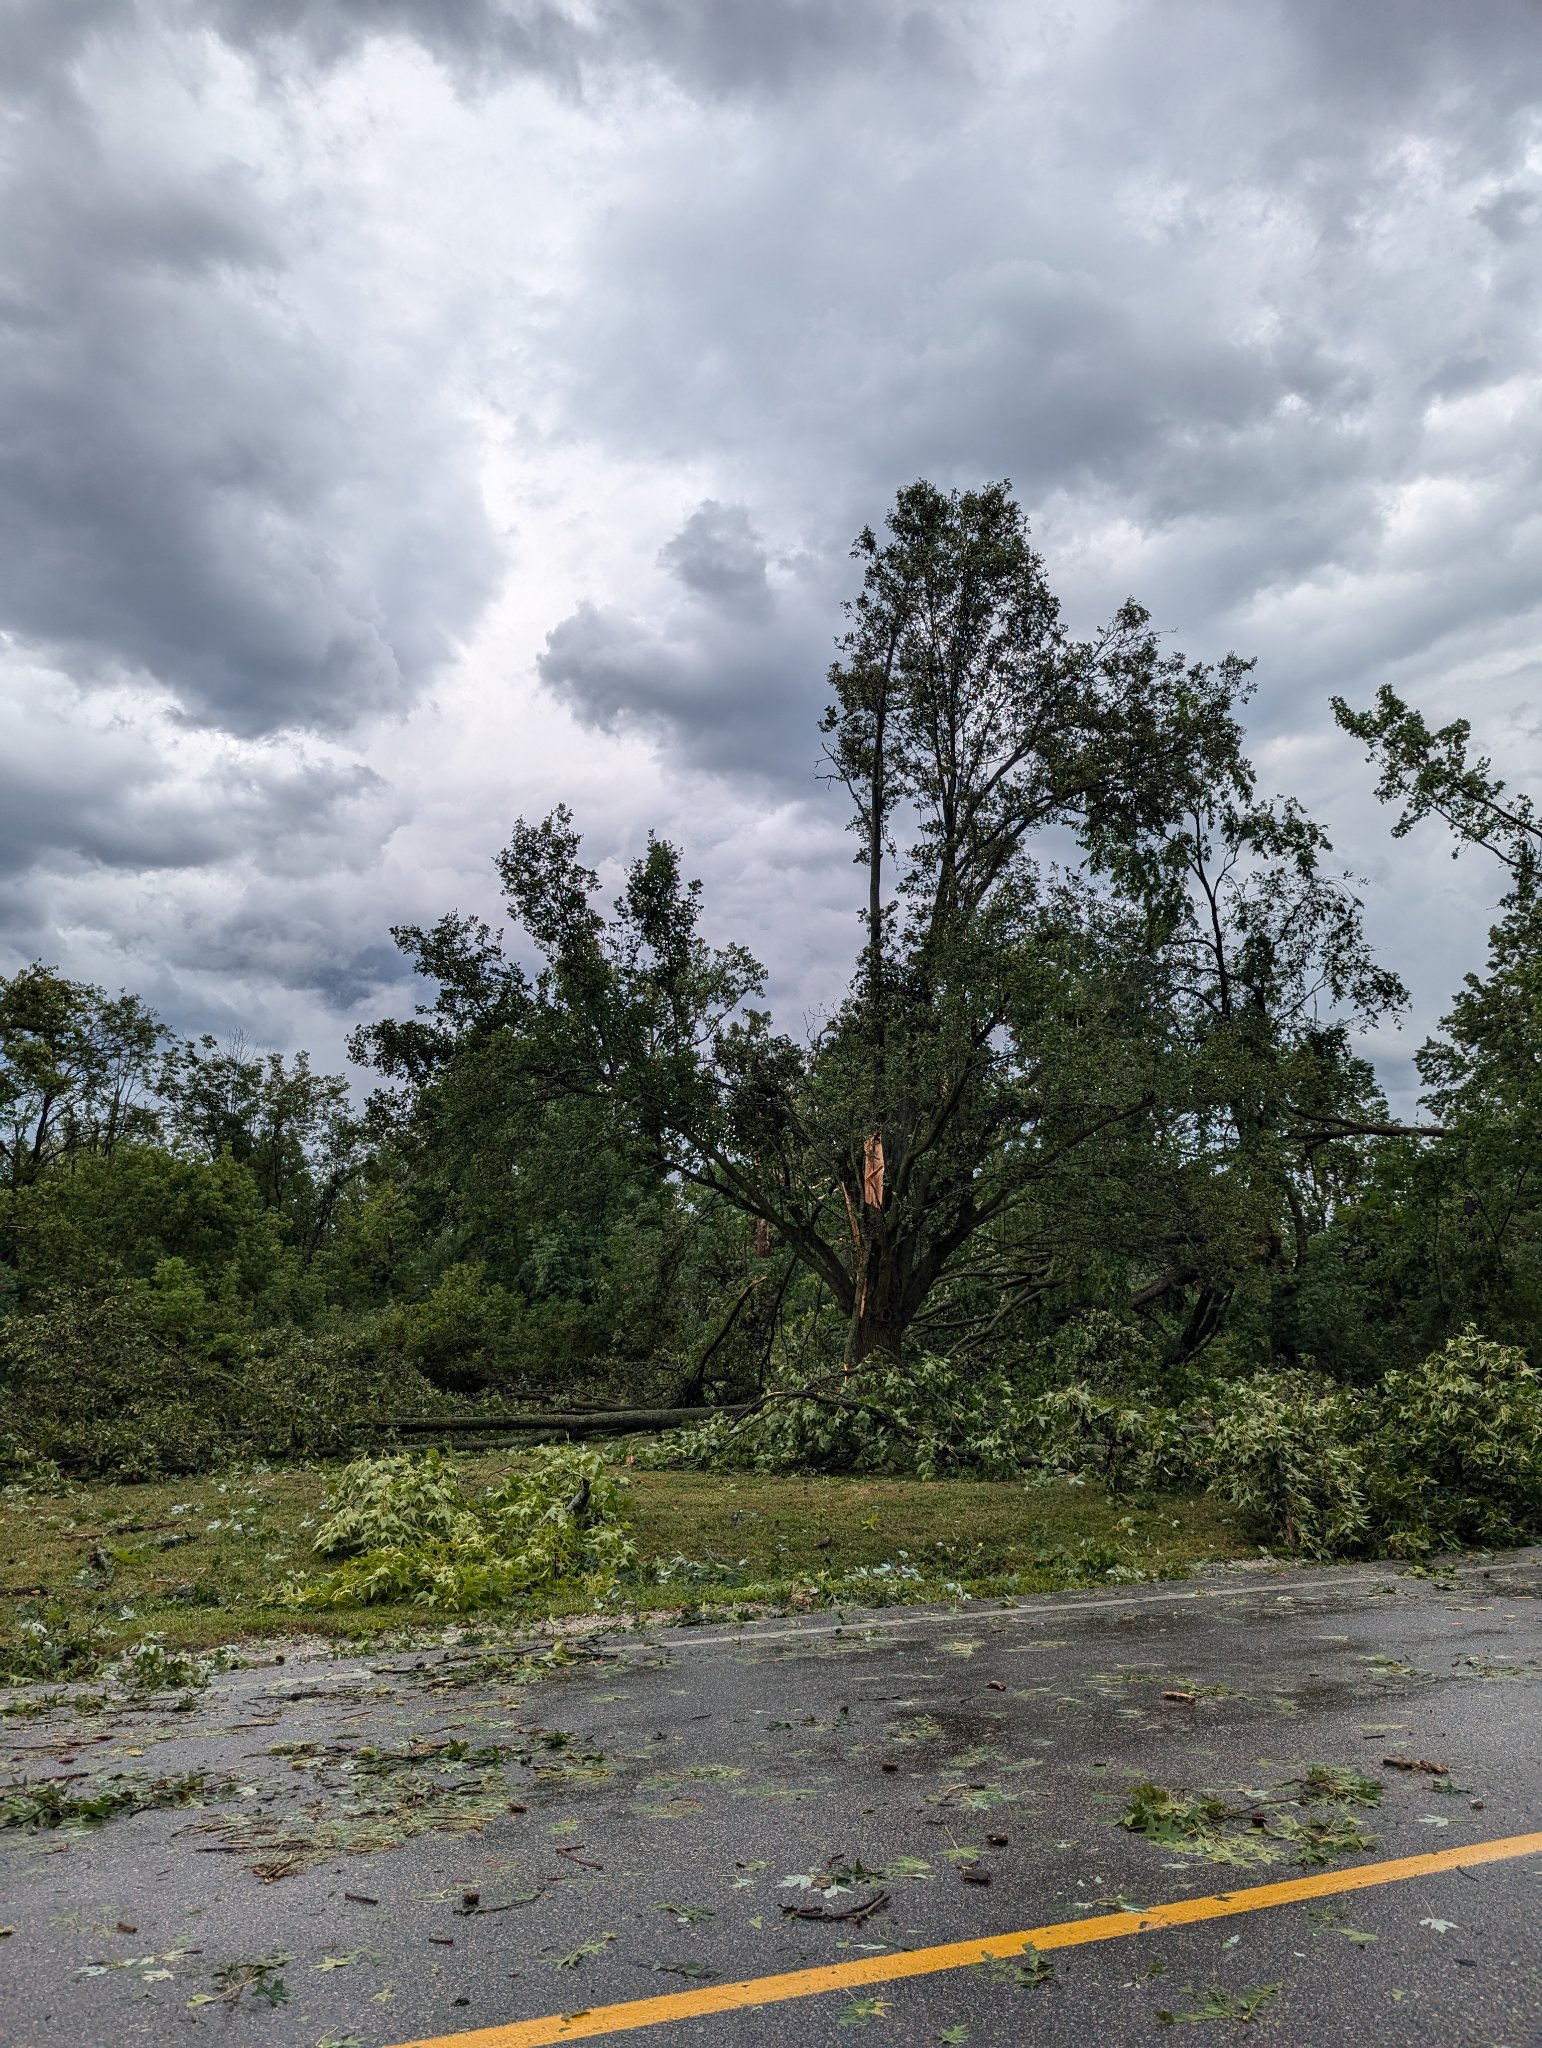
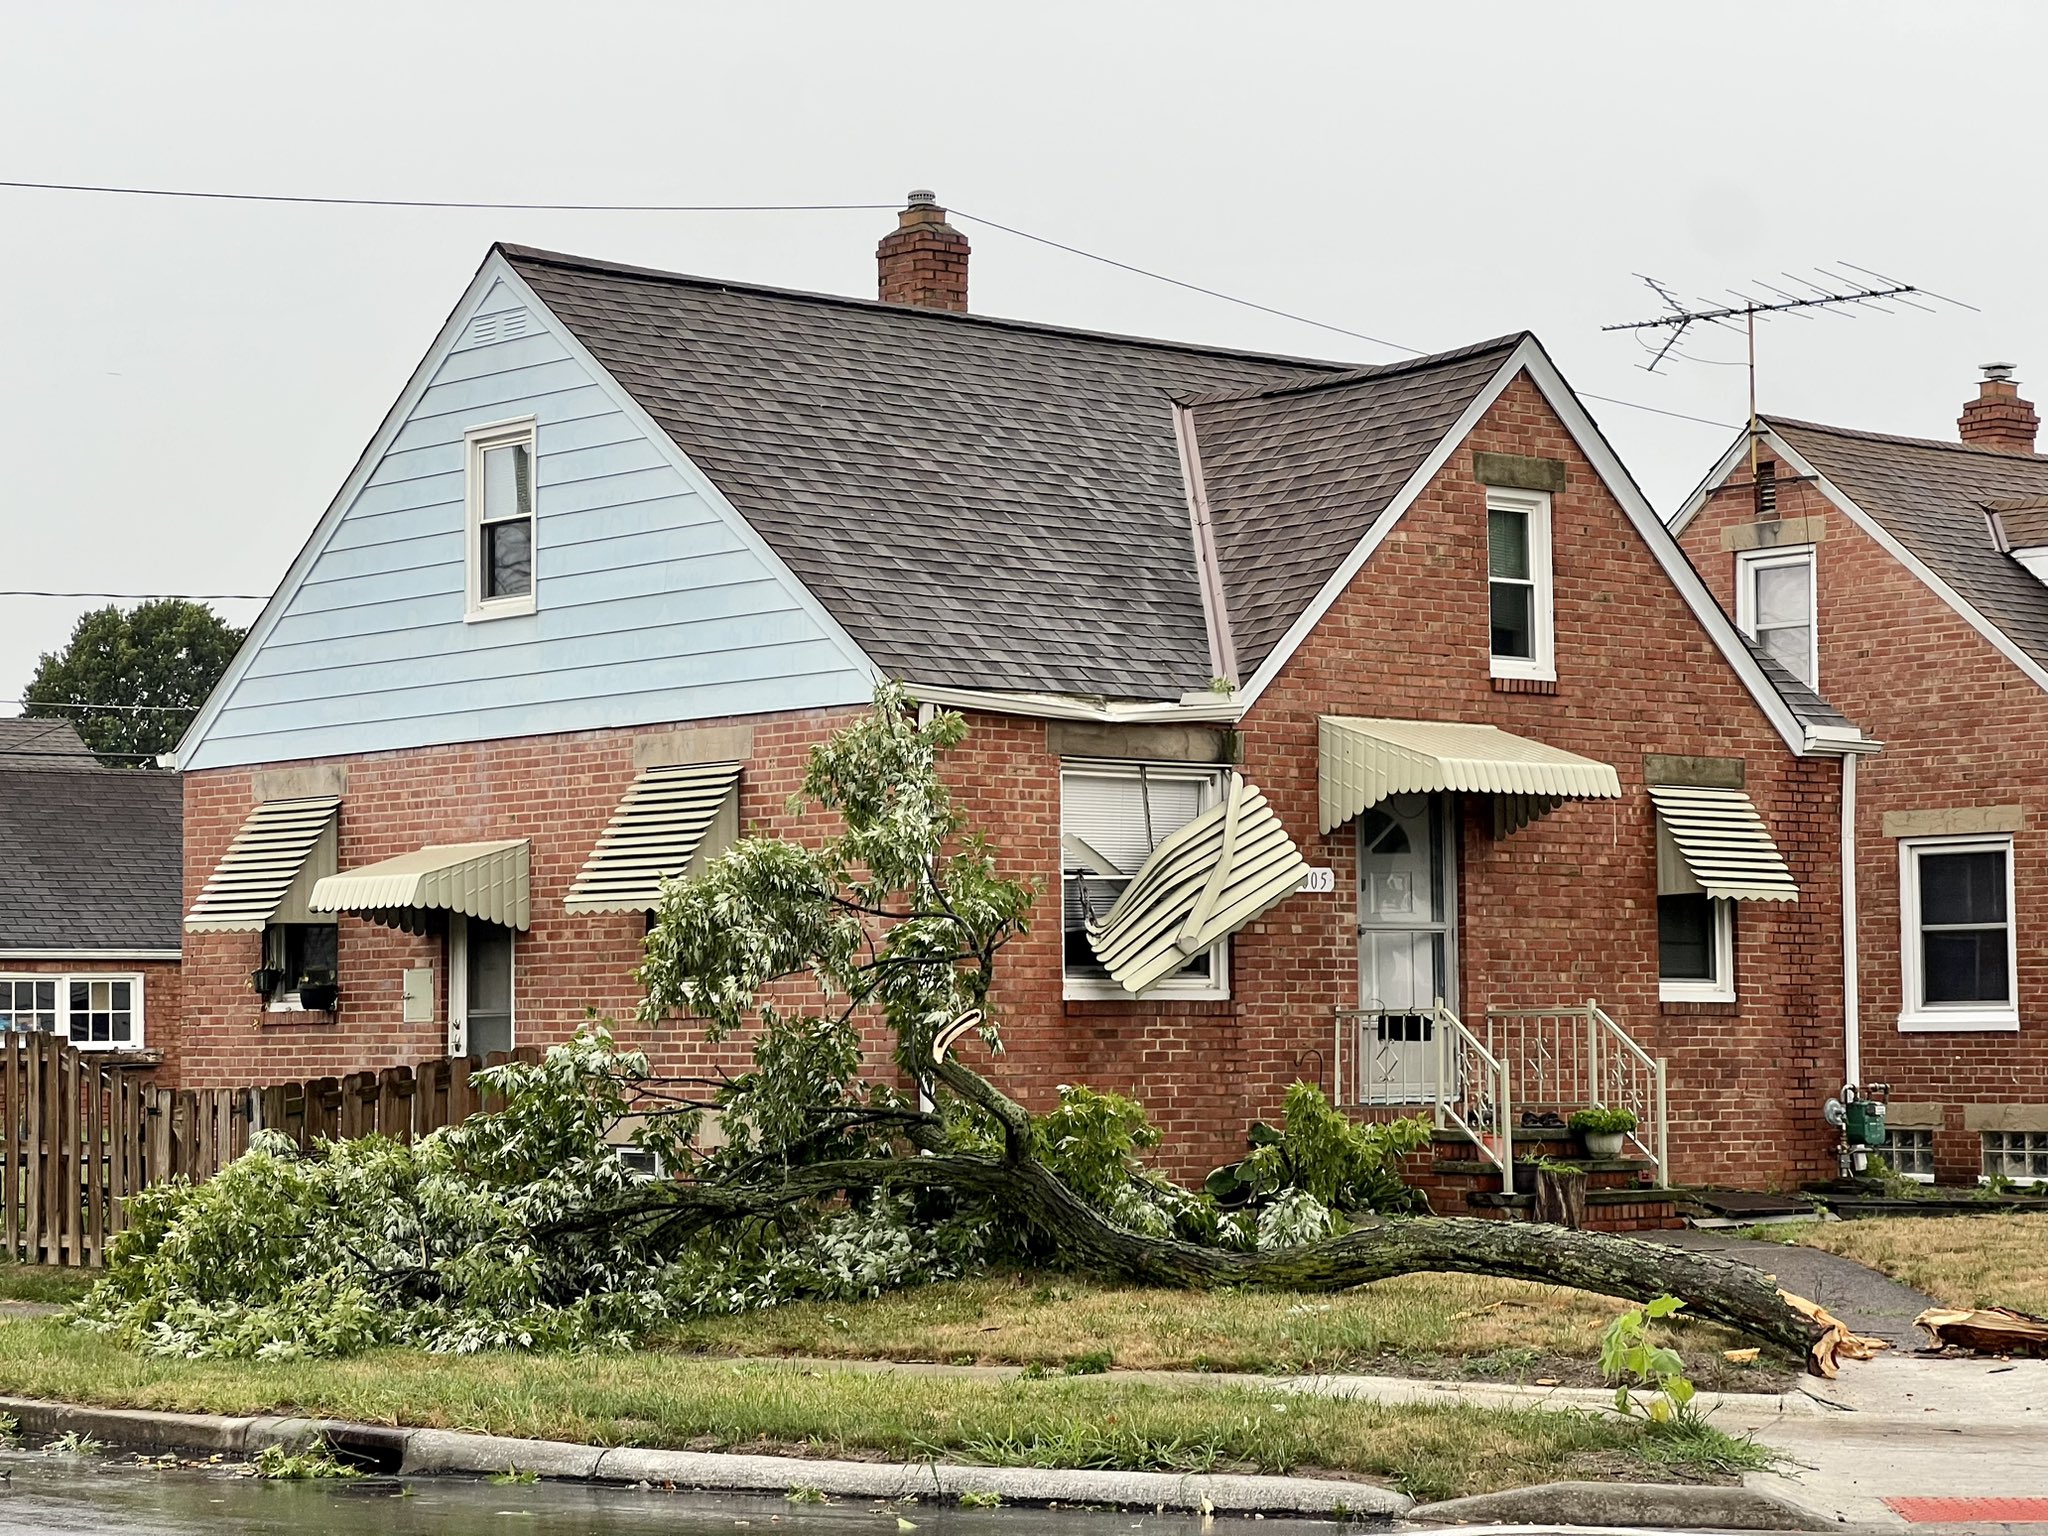
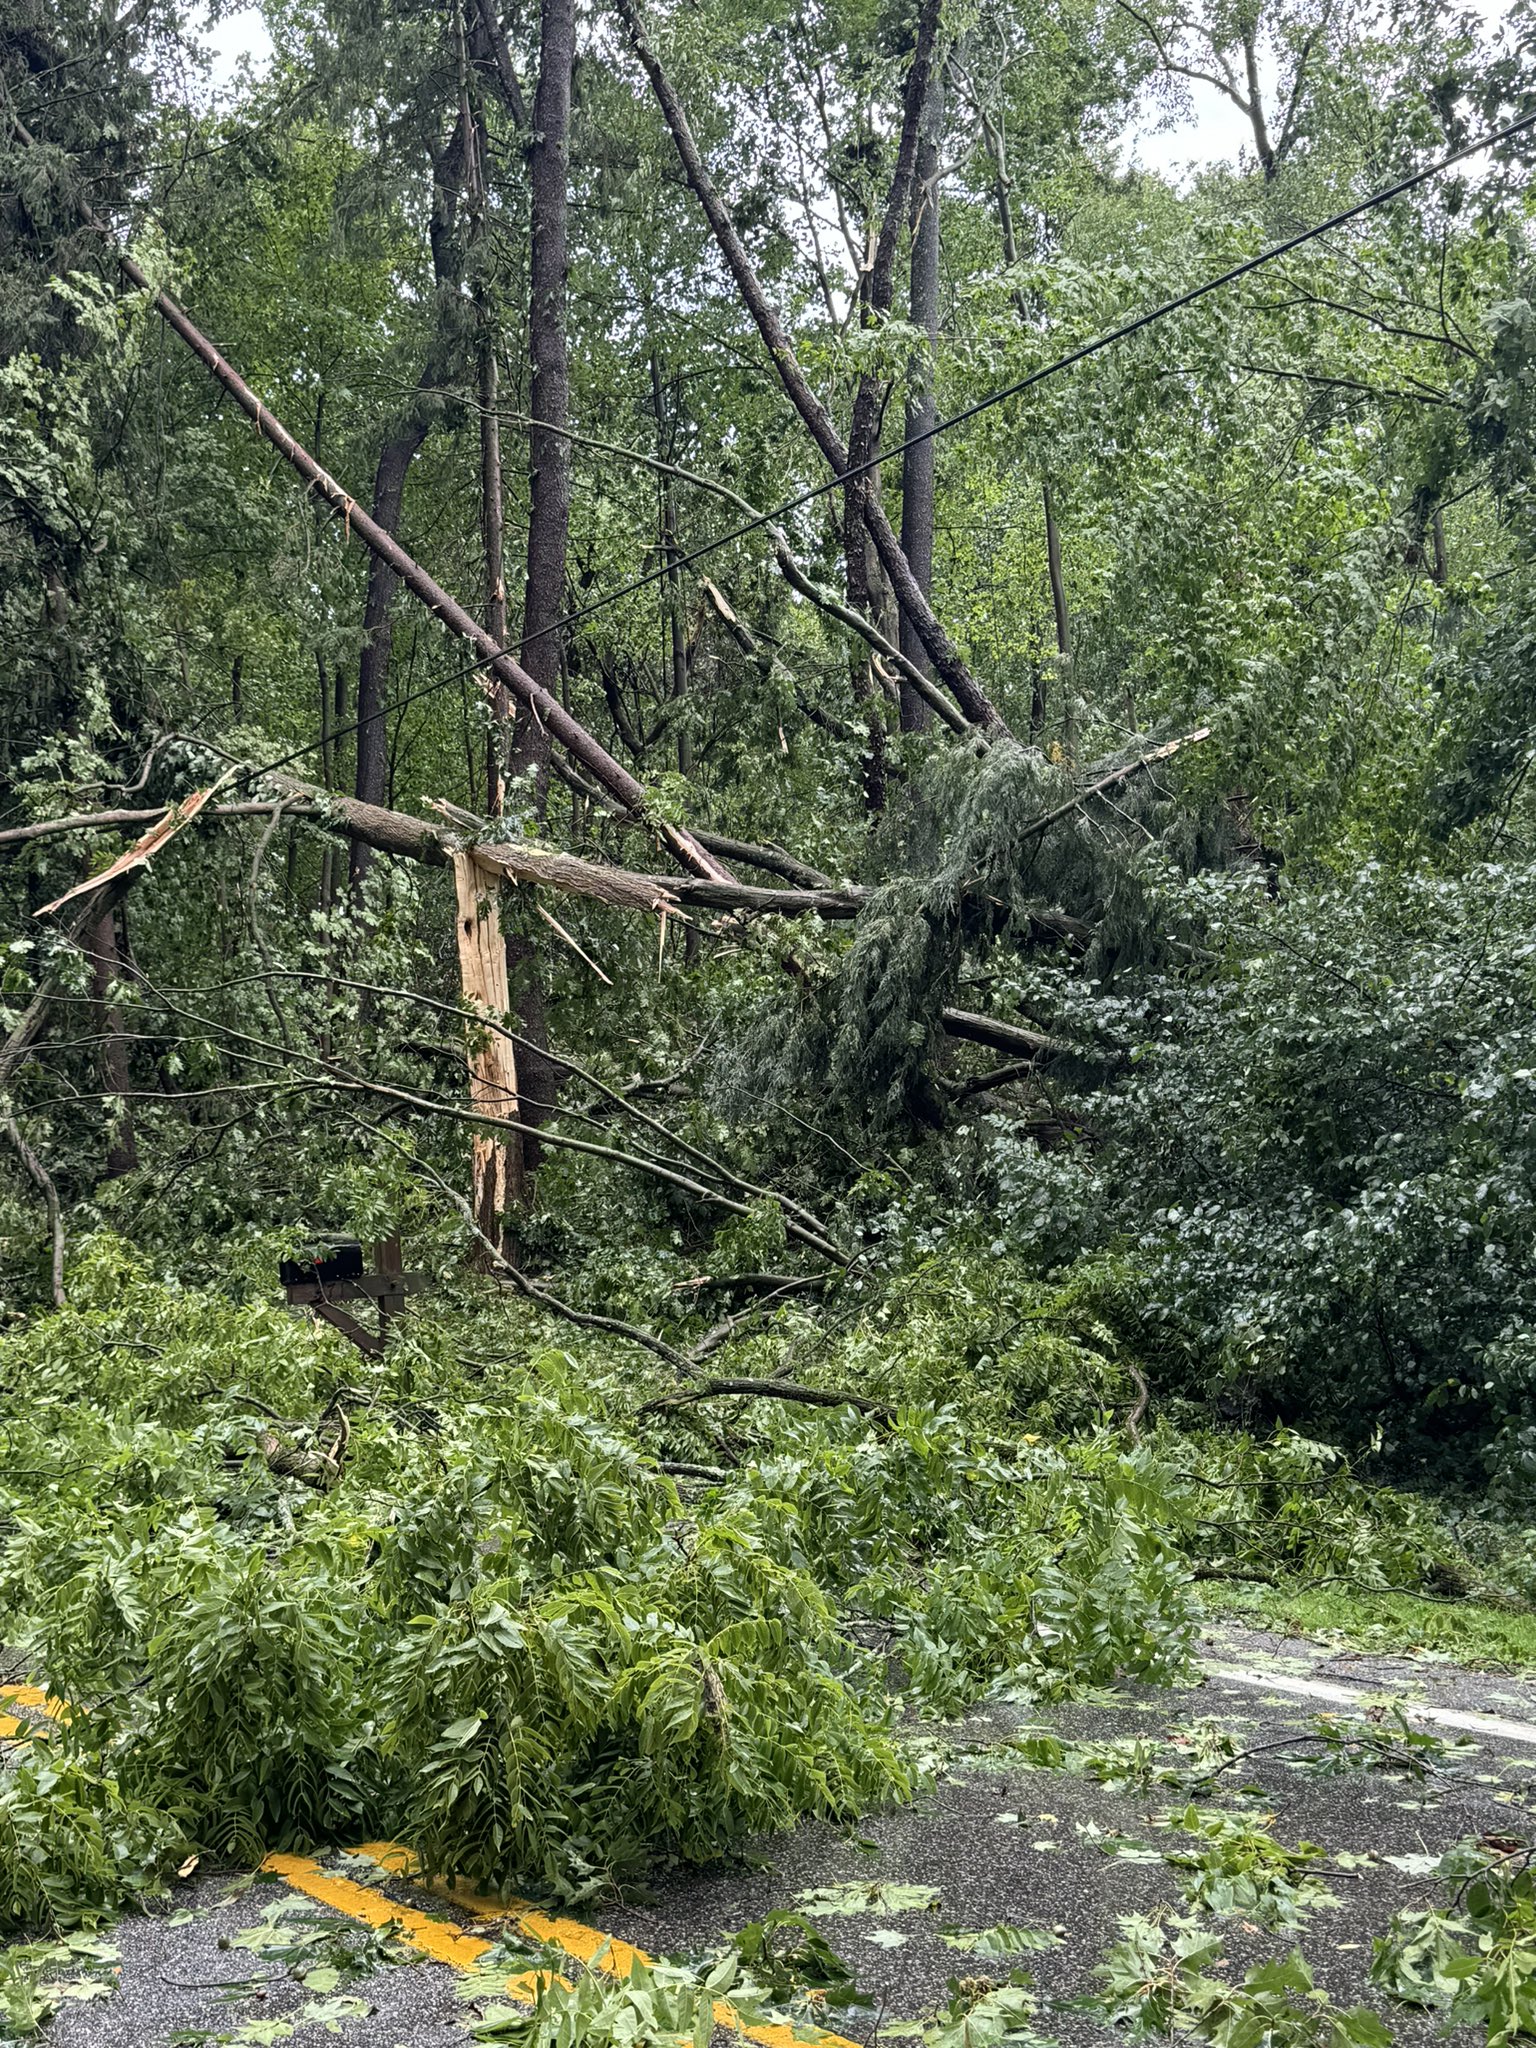
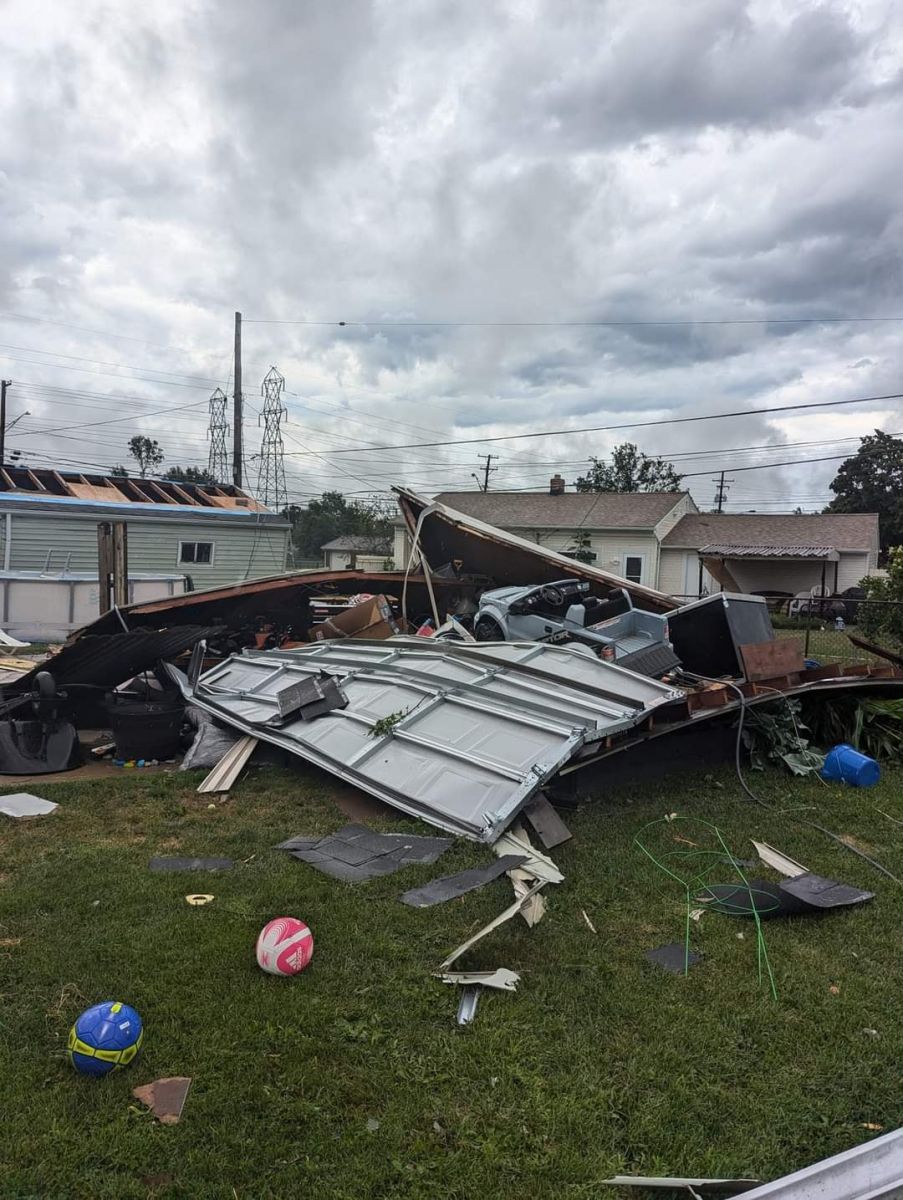
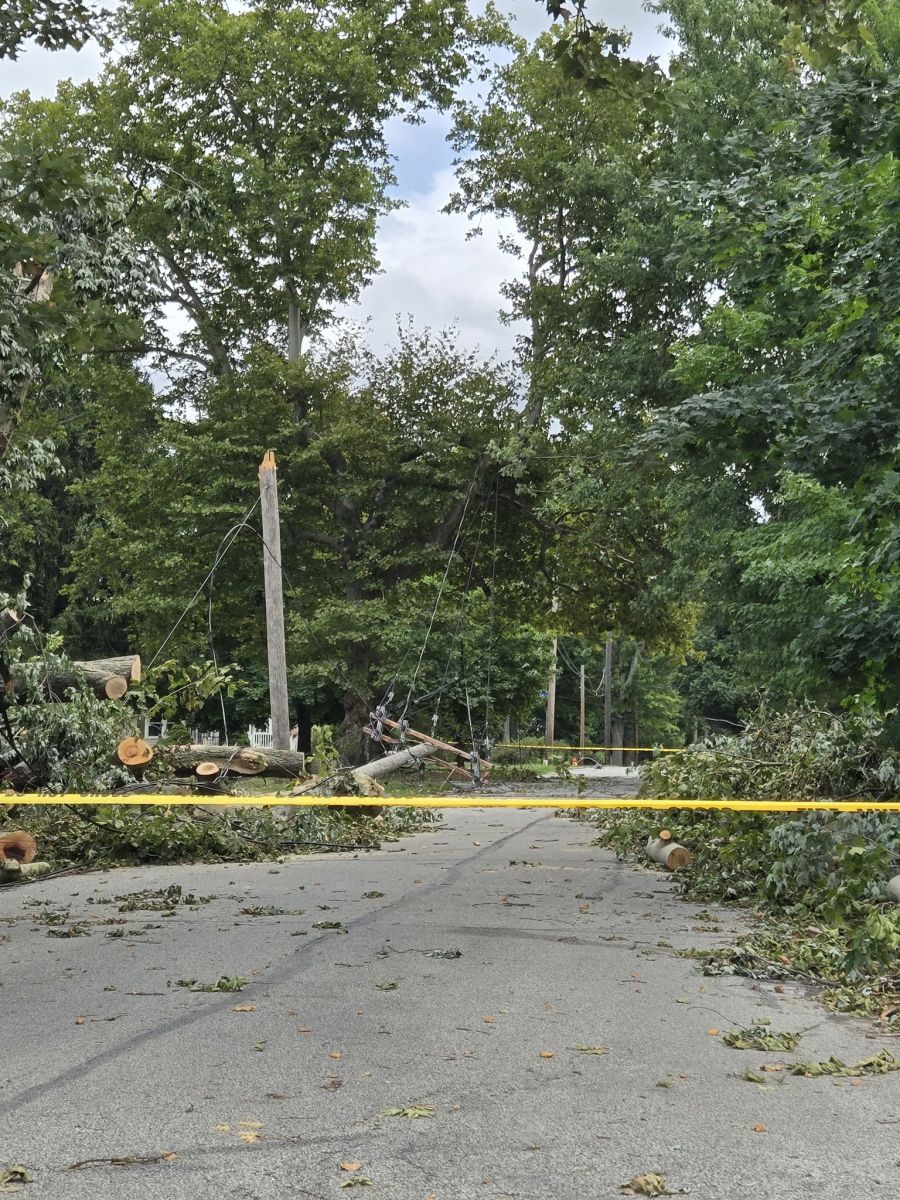
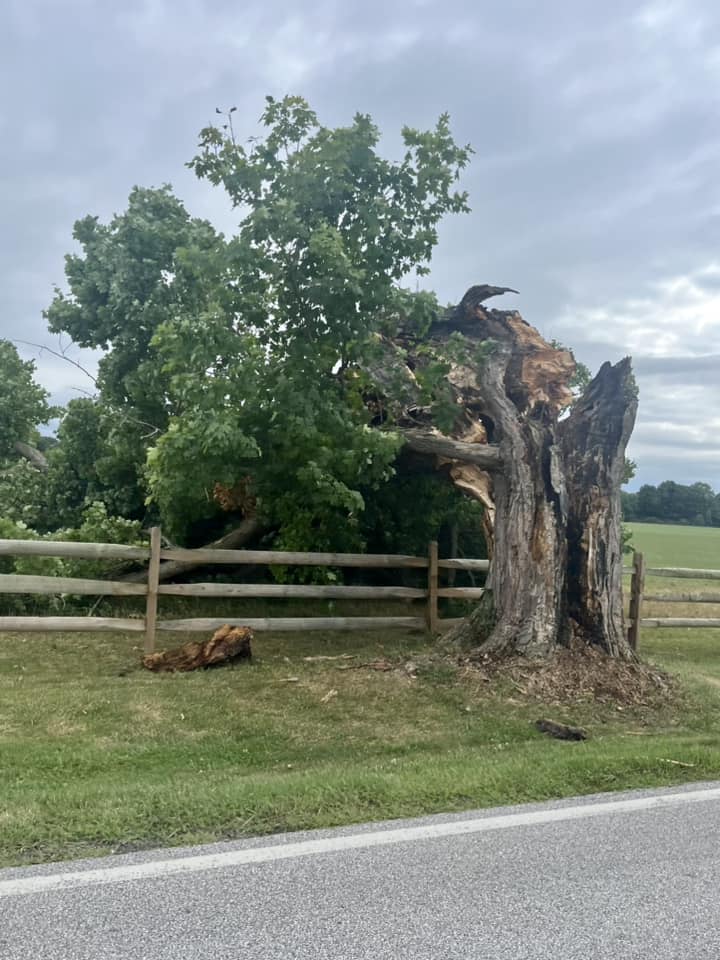
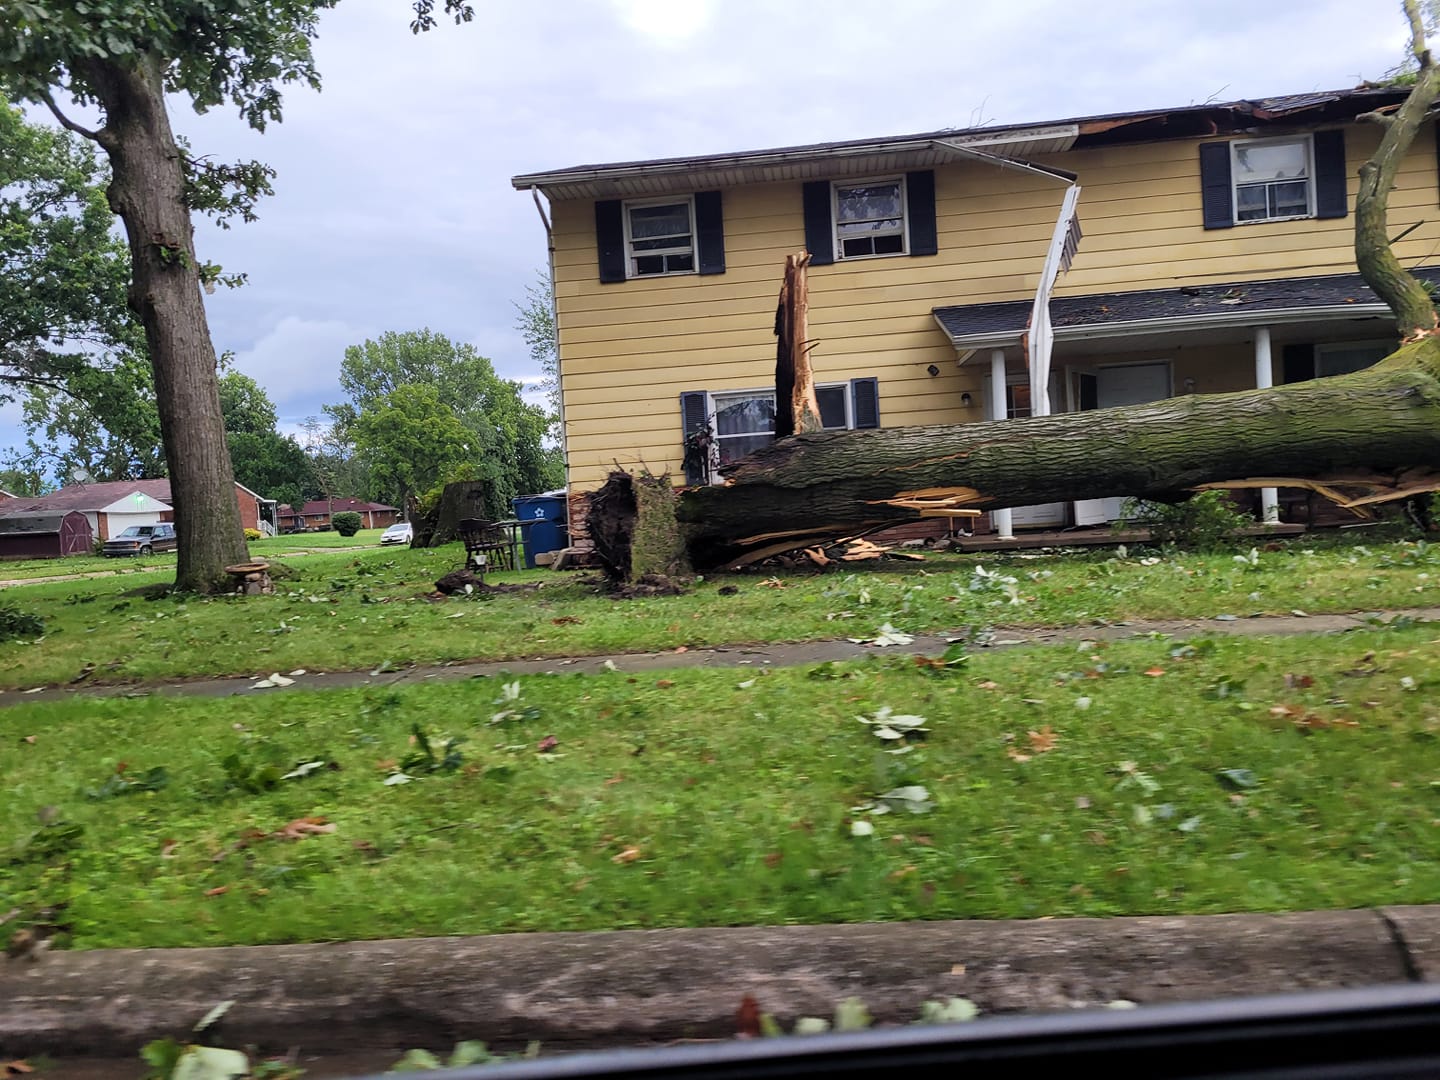
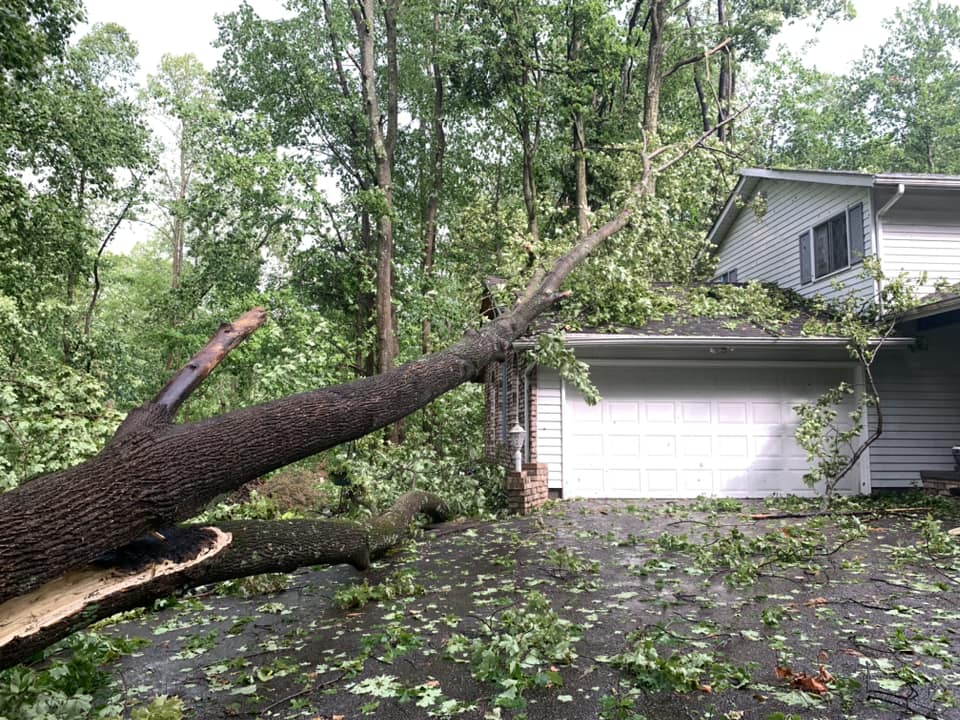
| A large tree snapped and fell on a house in Willoughby. Photo credit: Ryan Doberstyn | A large area of snapped trees in the Chesterland area. Notice how all of the trees are facing one direction, a key indicator of straight-line winds, and in this case, likely 100+ mph wind speeds. | Ductwork blown off roof E 93rd and Kinsman in Cleveland. Photo credit: Cameron Keske | A large tree snapped in Eastlake. Photo credit: Aurora Fink |
 |
 |
 |
 |
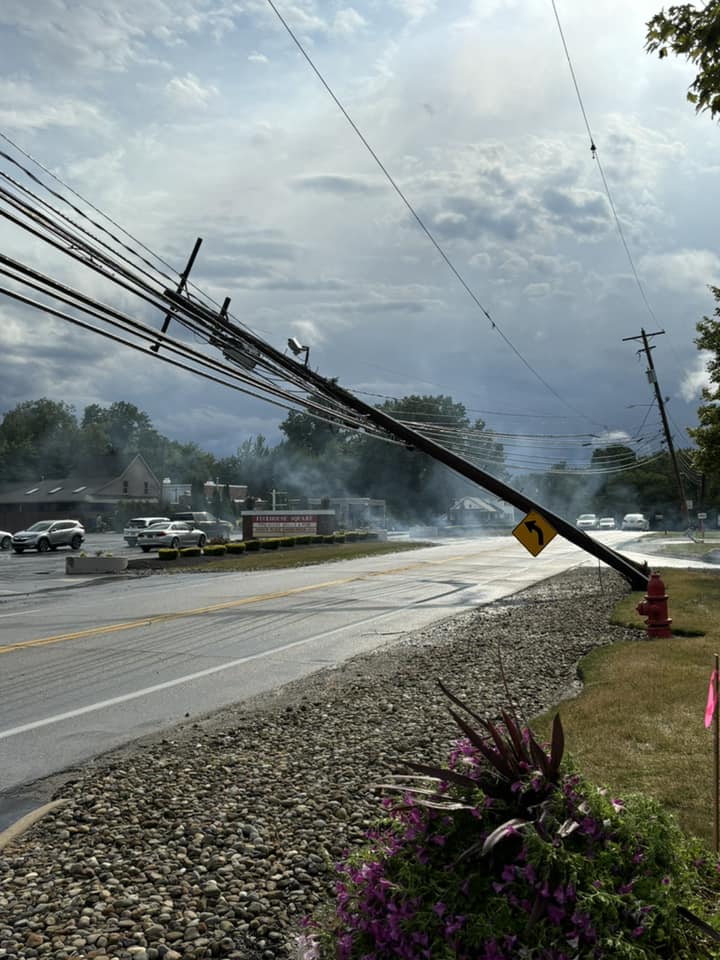
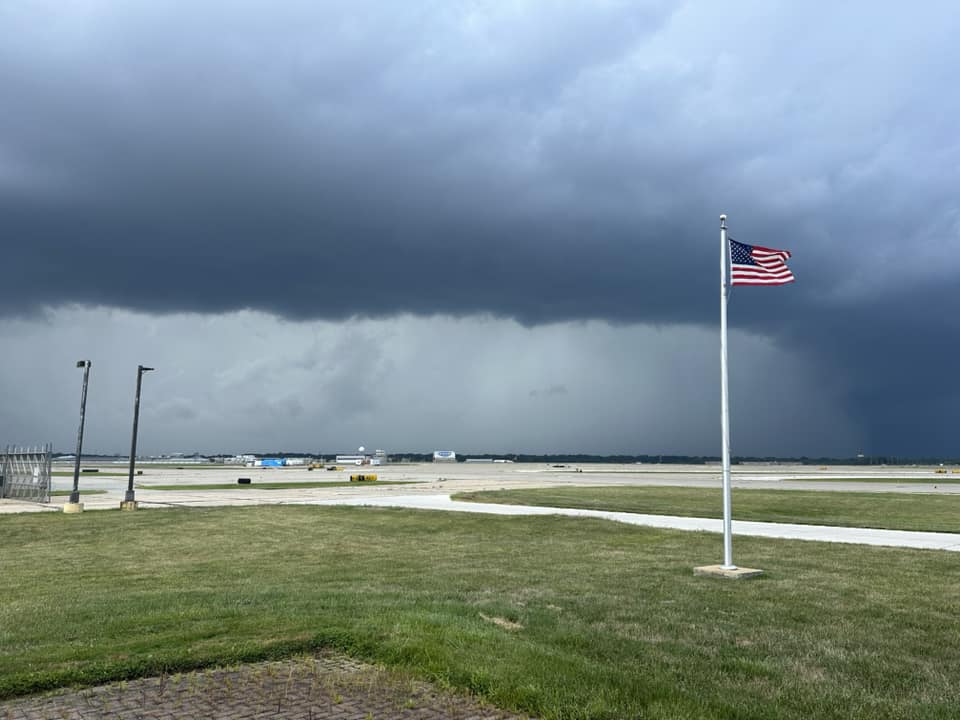
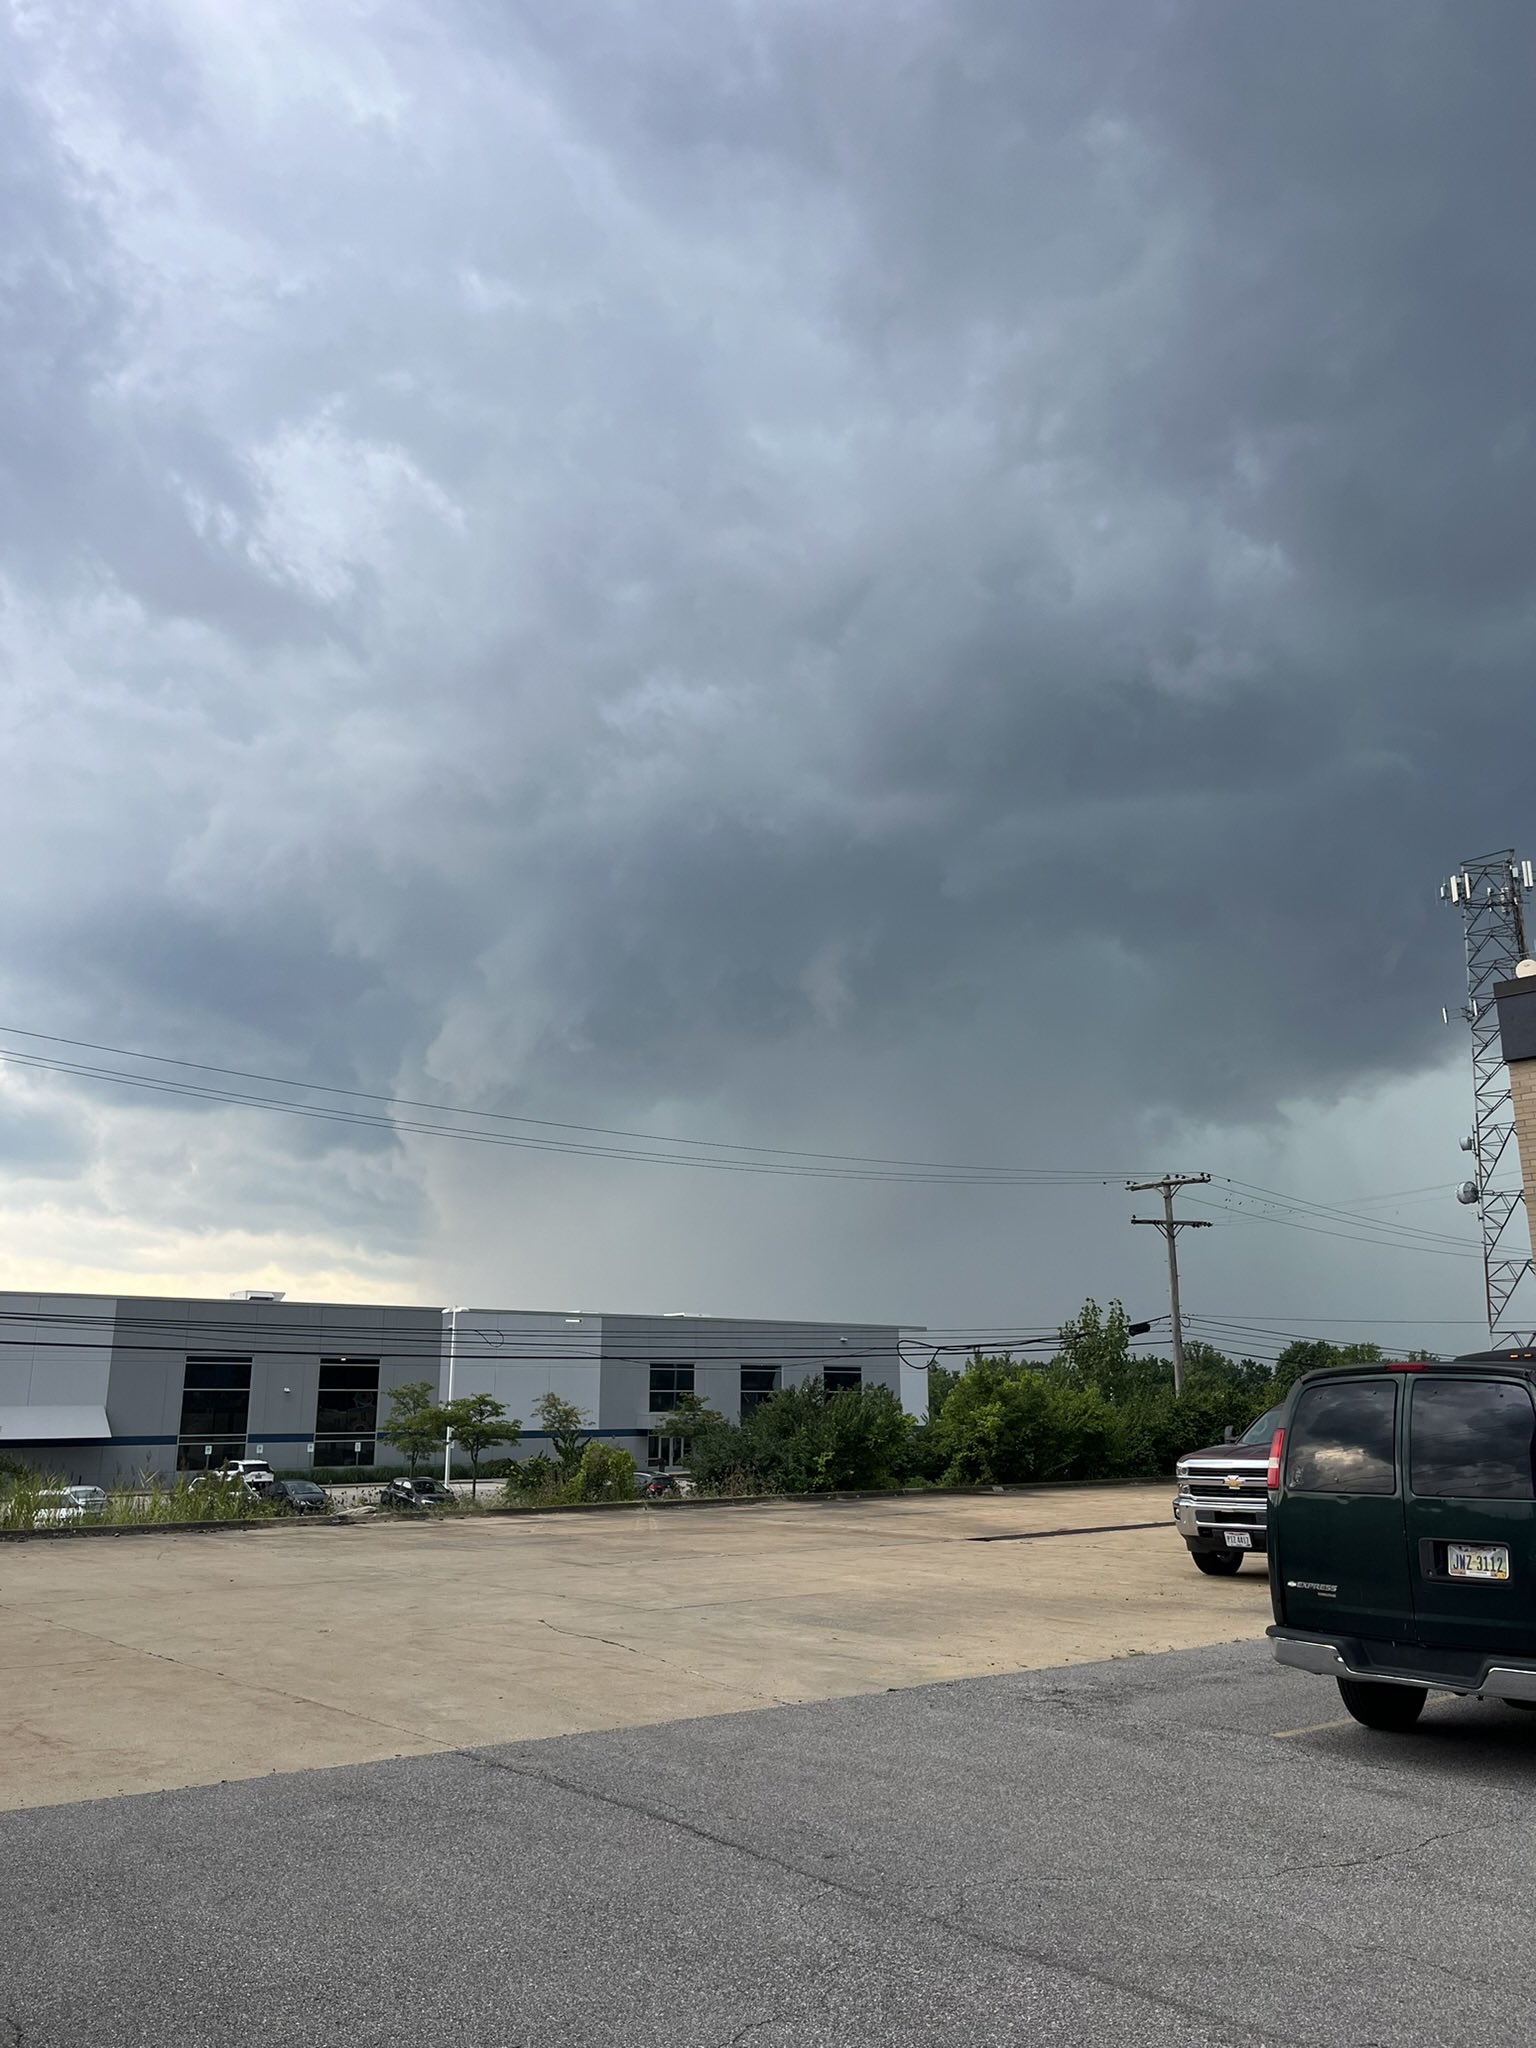
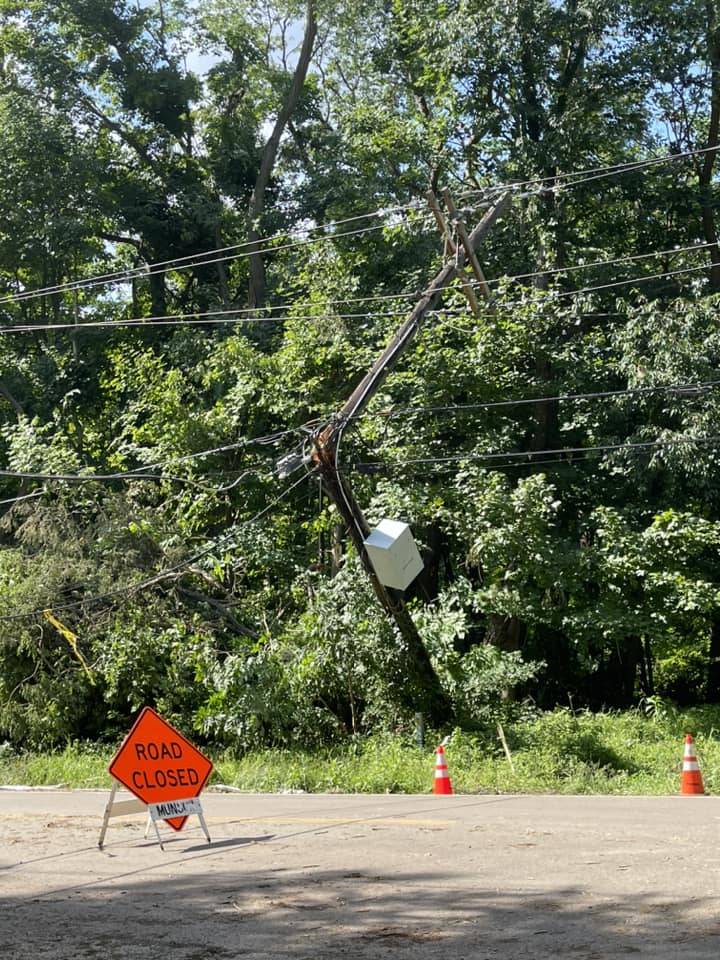
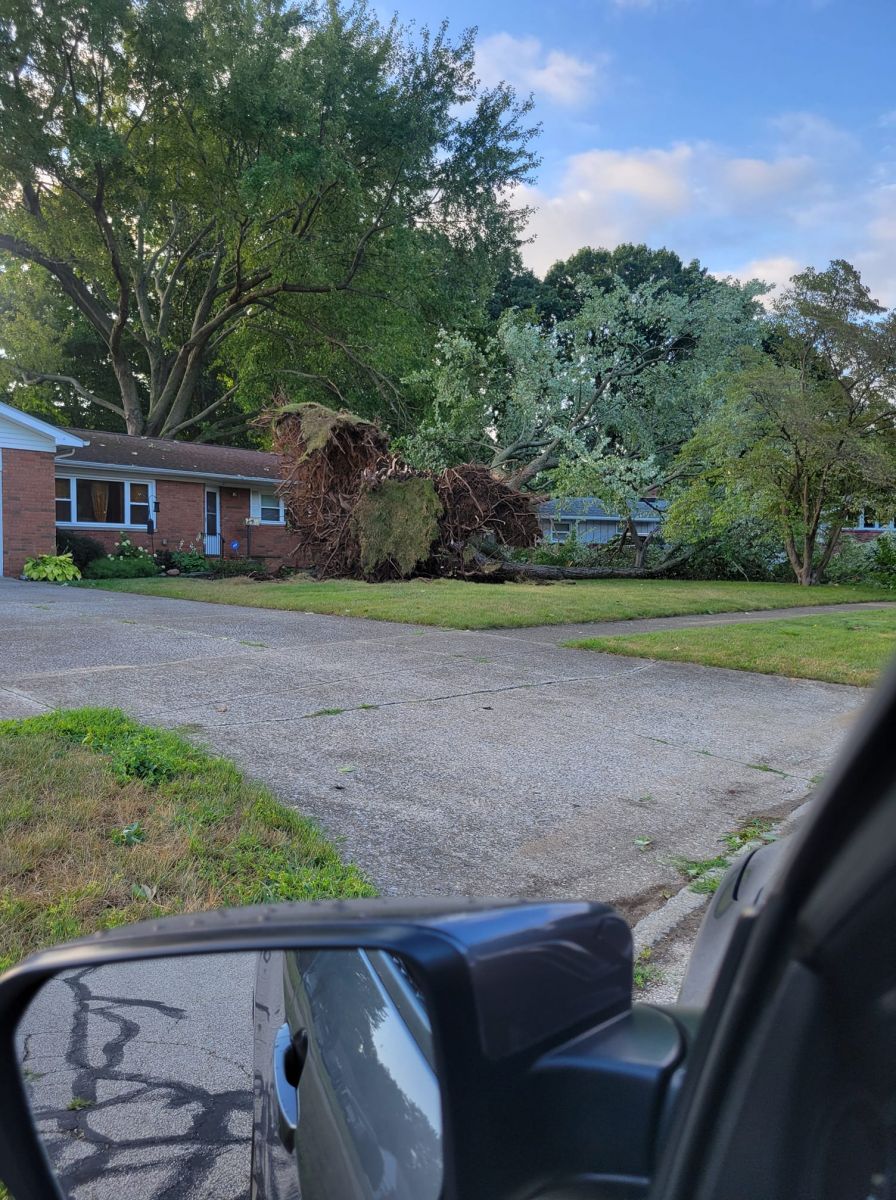
| This picture was taken just before the tornado went through Avon Lake. Photo credit: Erin Byrne | Power pole bent by winds in Willoughby Hills at Route 6. Photo credit: Jennifer Bubonics | Large tree uprooted in Richmond Heights. Photo credit: Gina Wilkolak | West 159th Cleveland. Photo credit: Valeria Sirvaitis Fecko |
 |
 |
 |
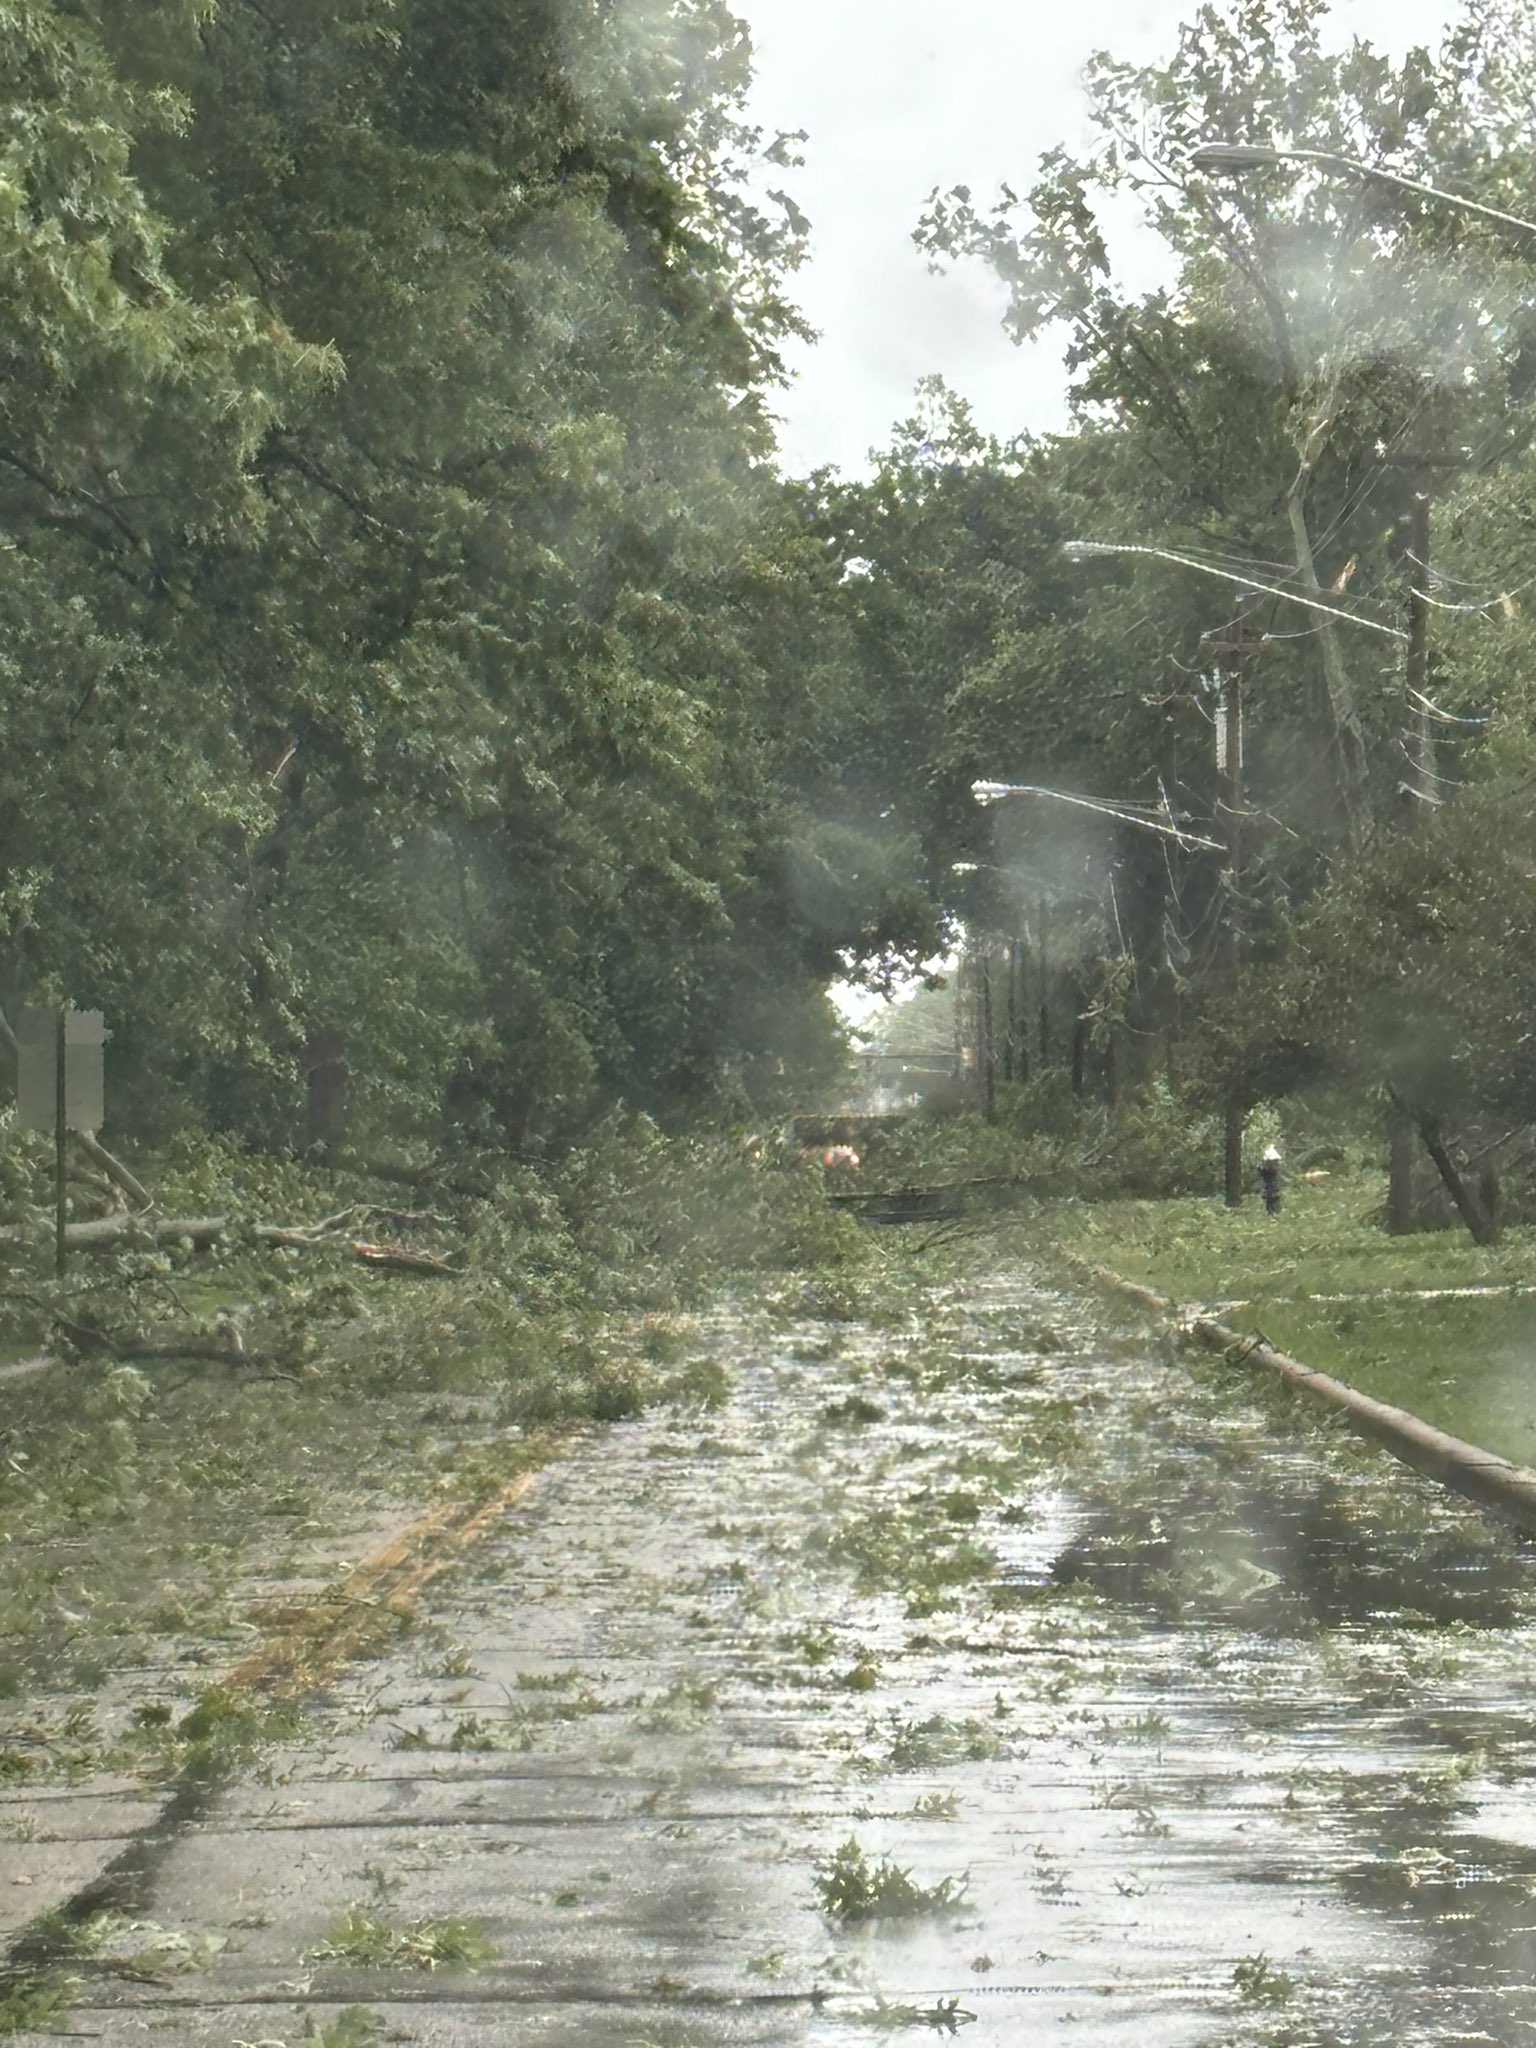 |
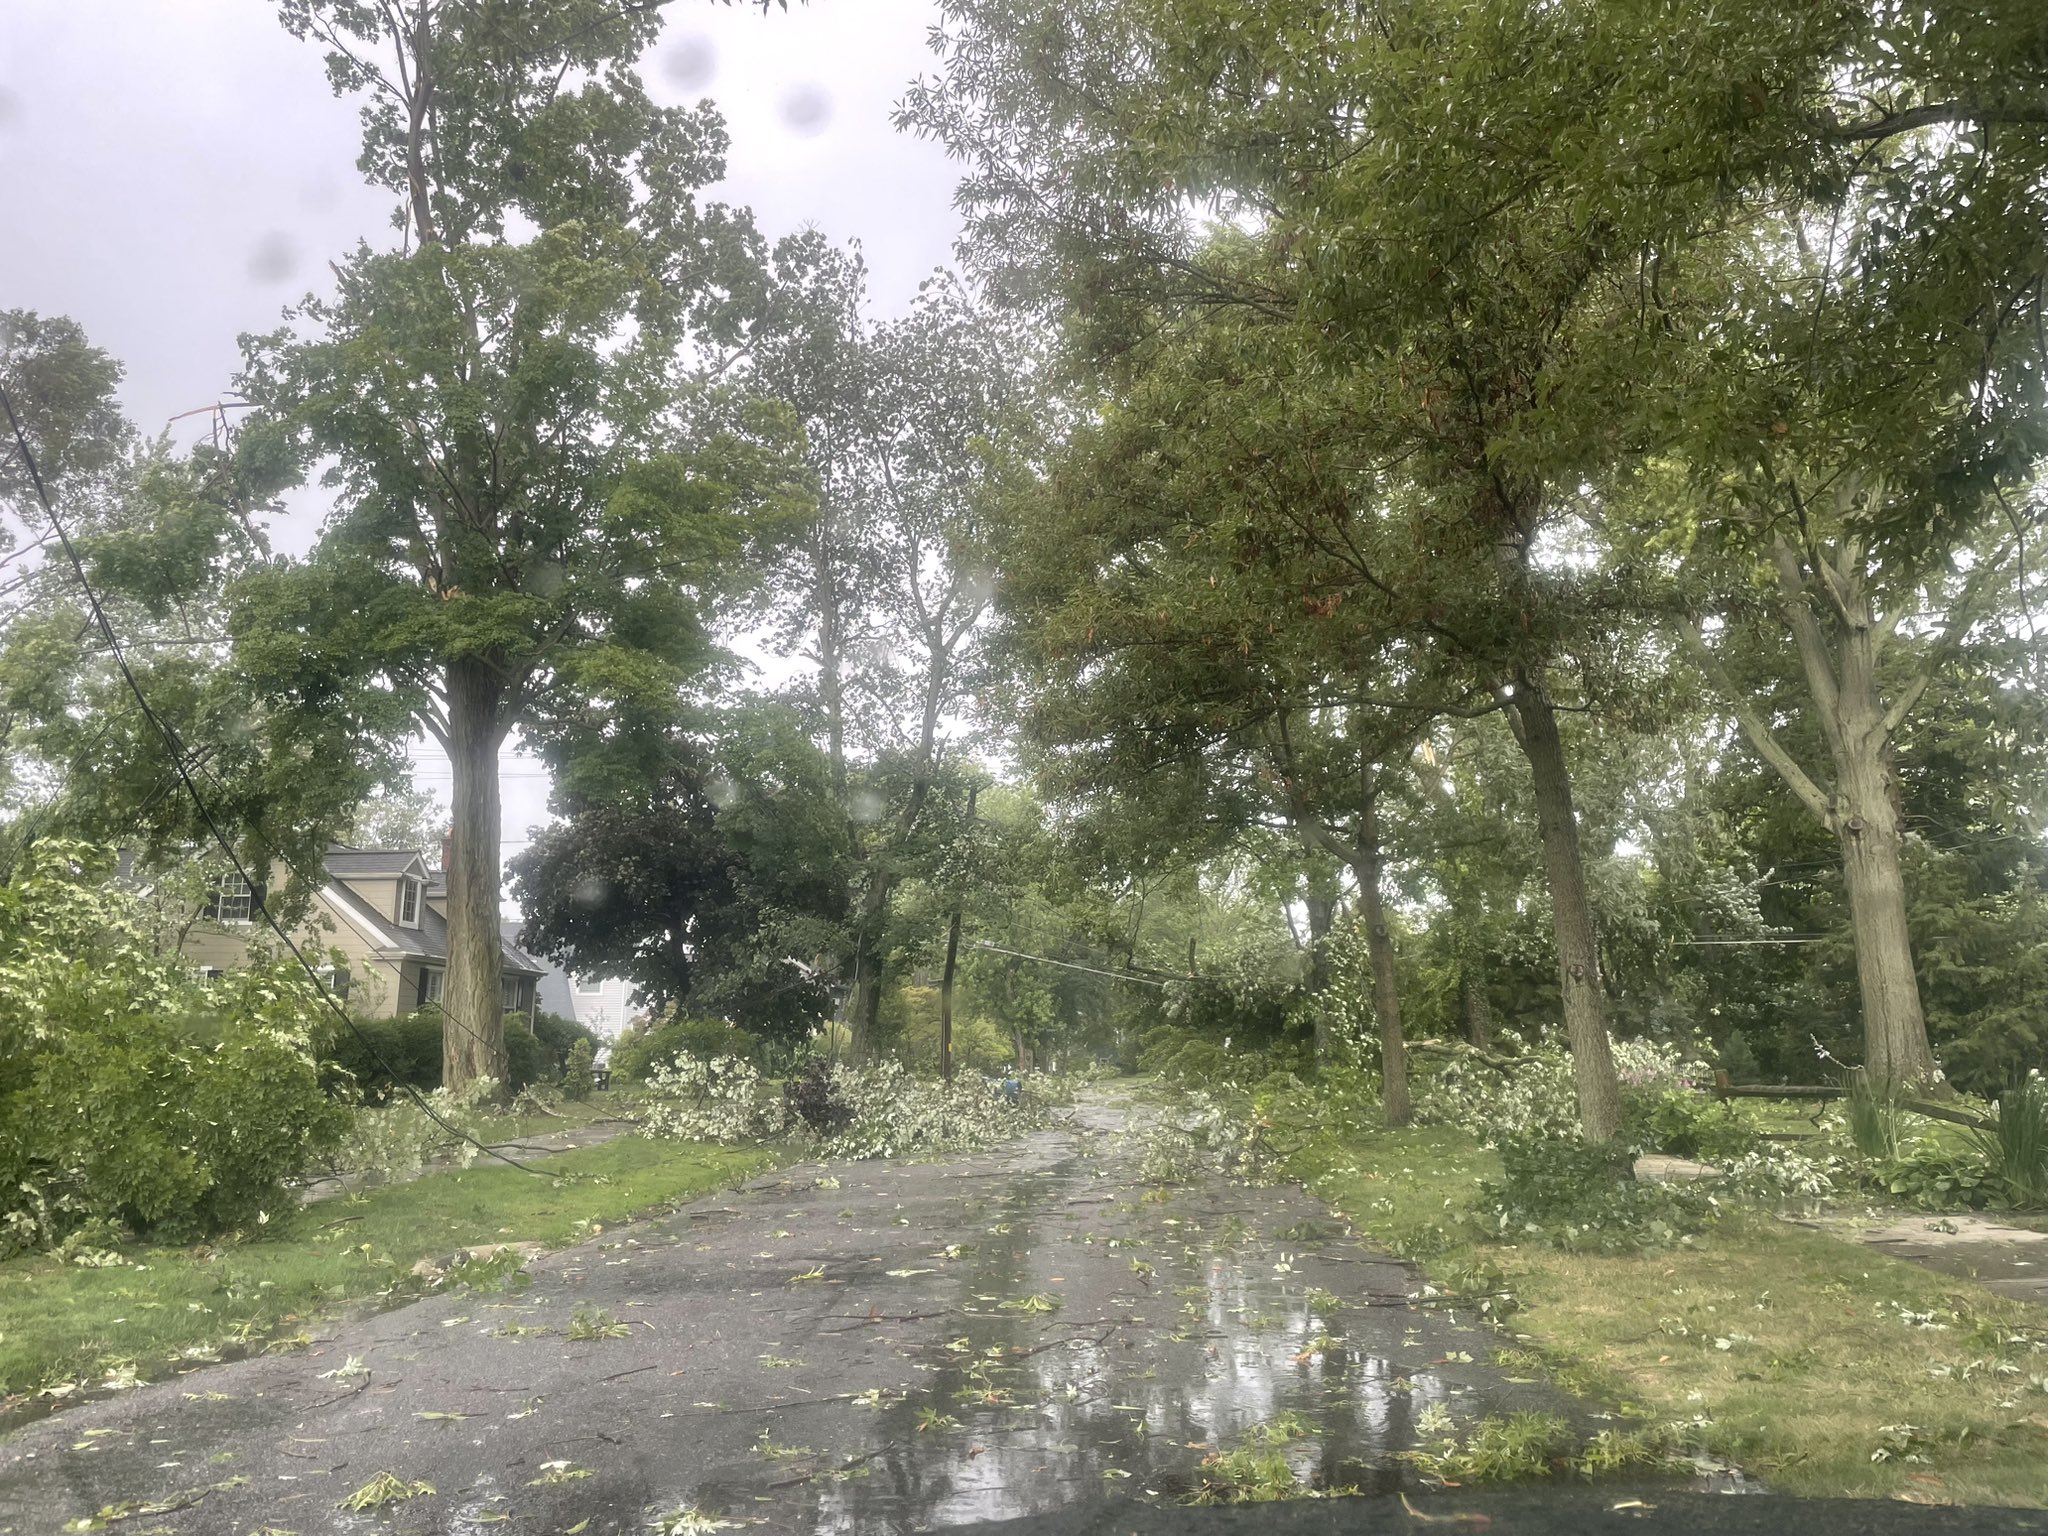
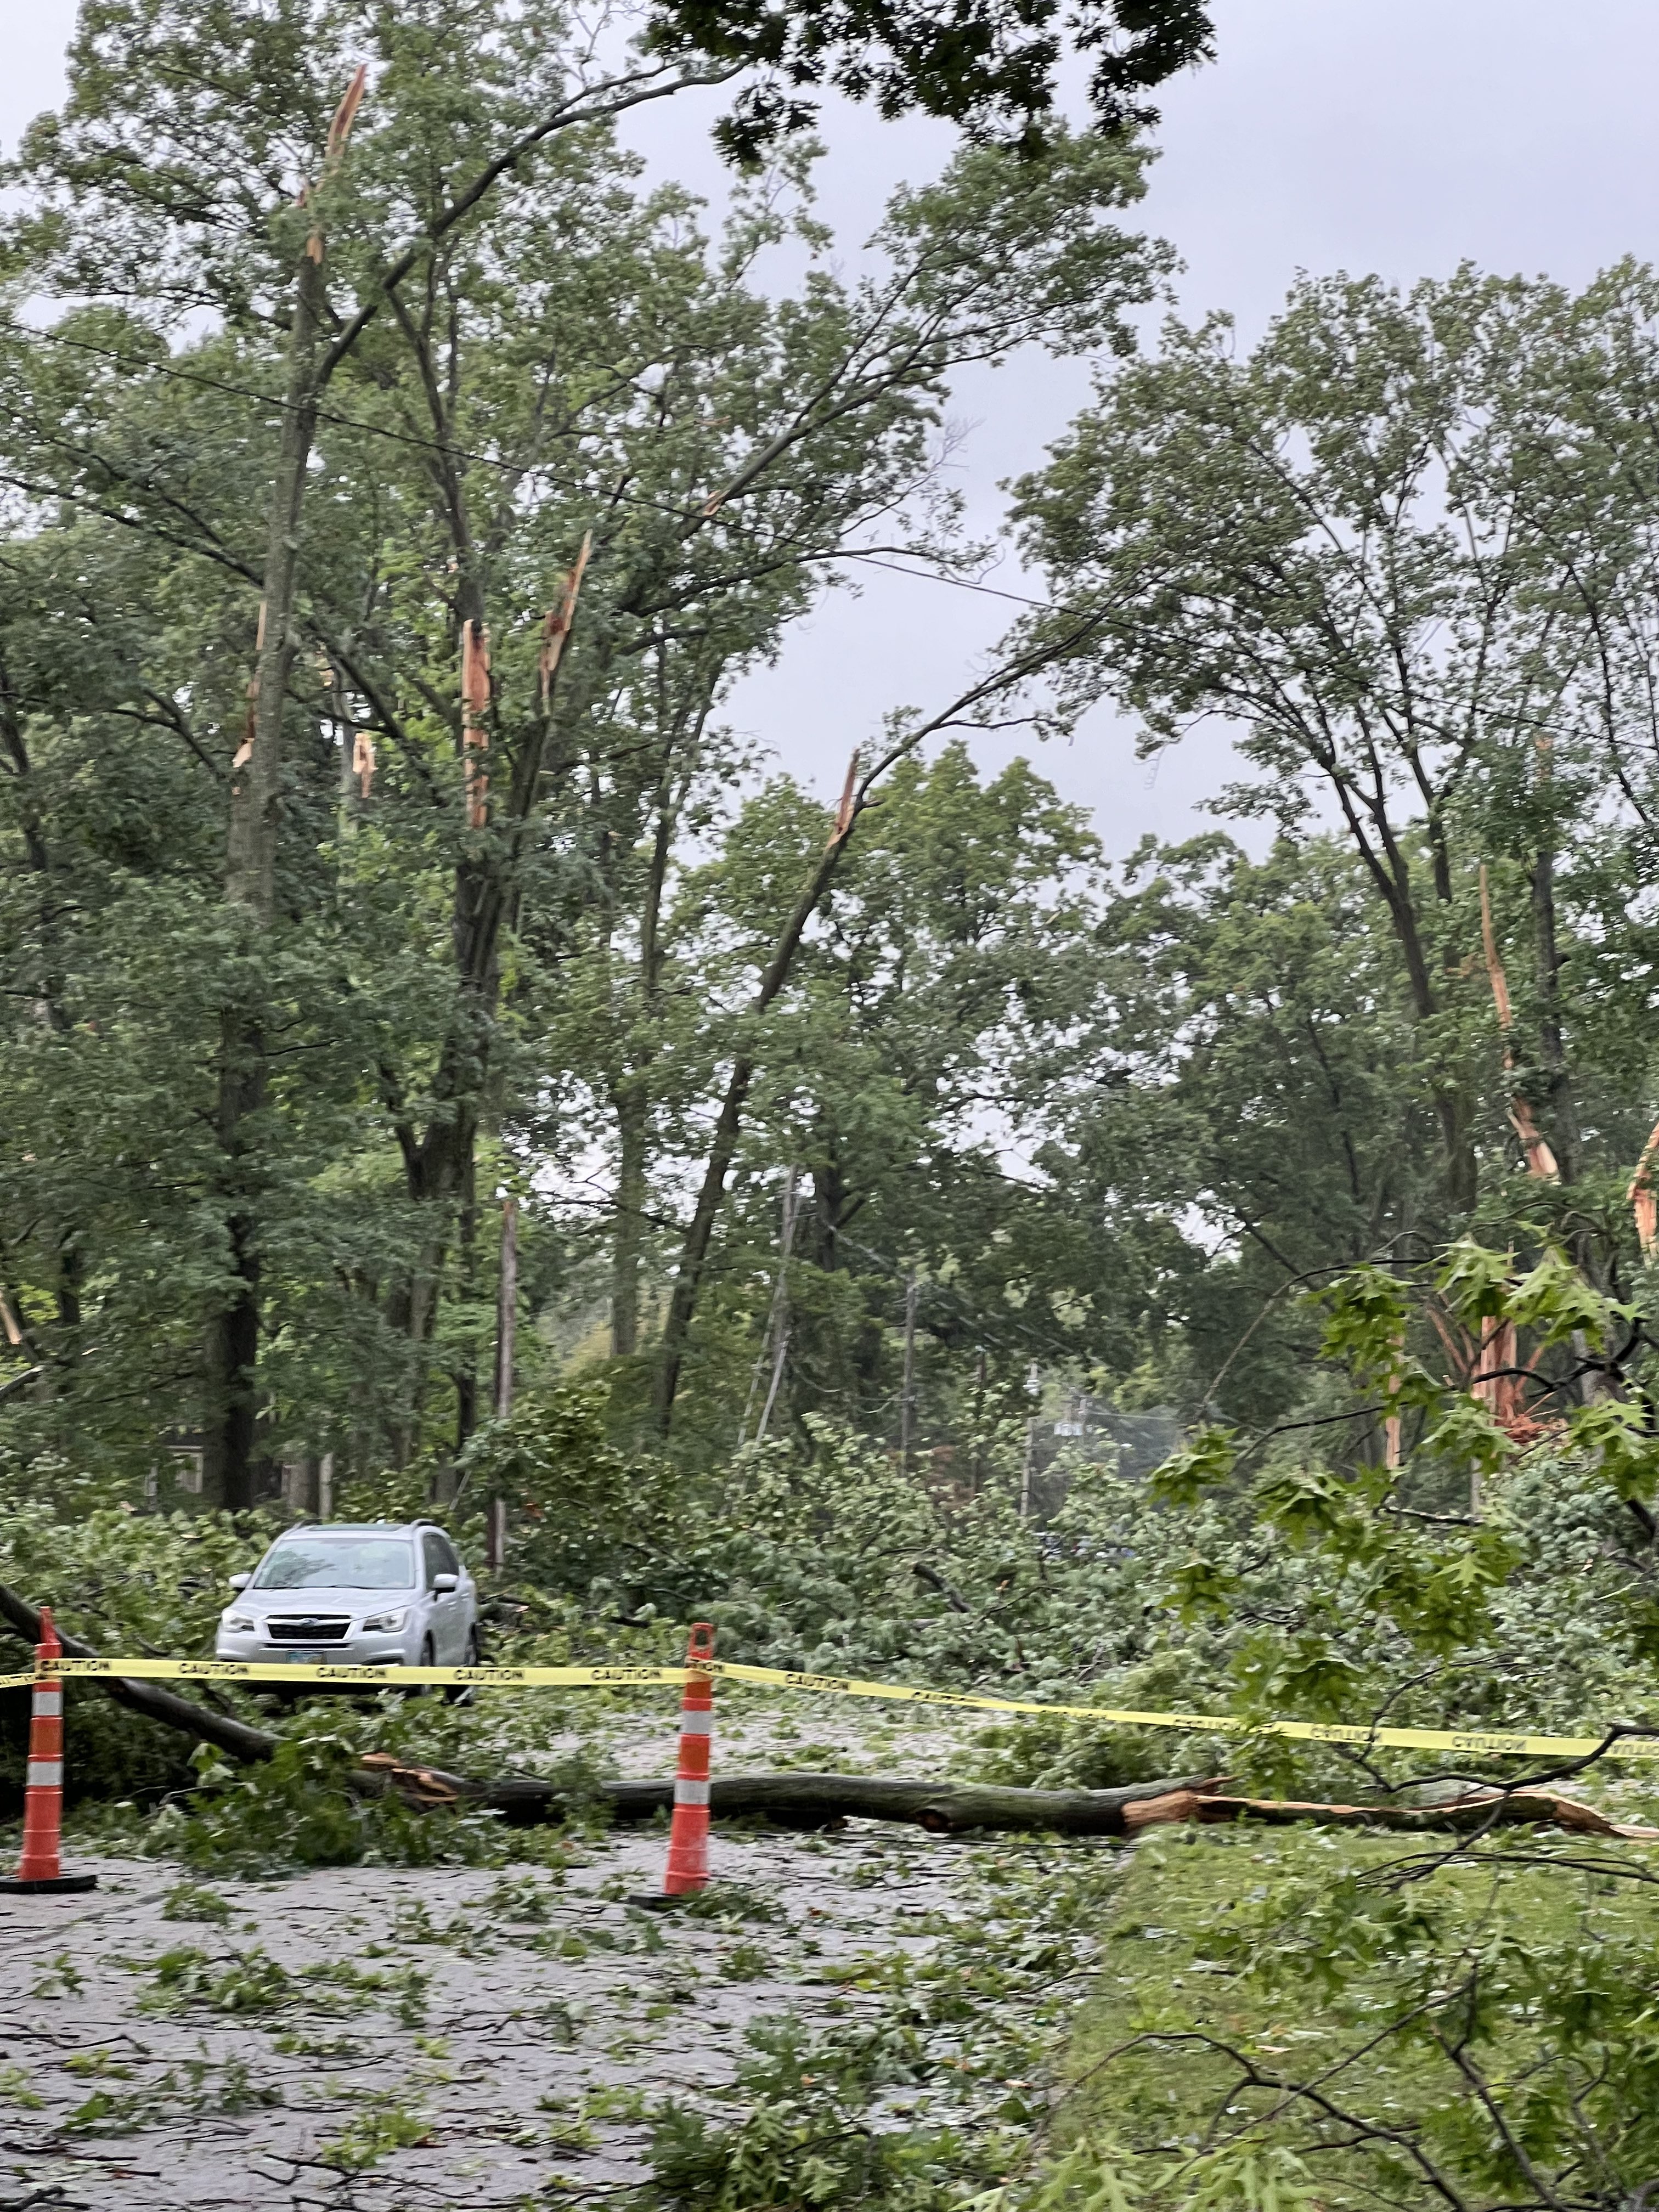
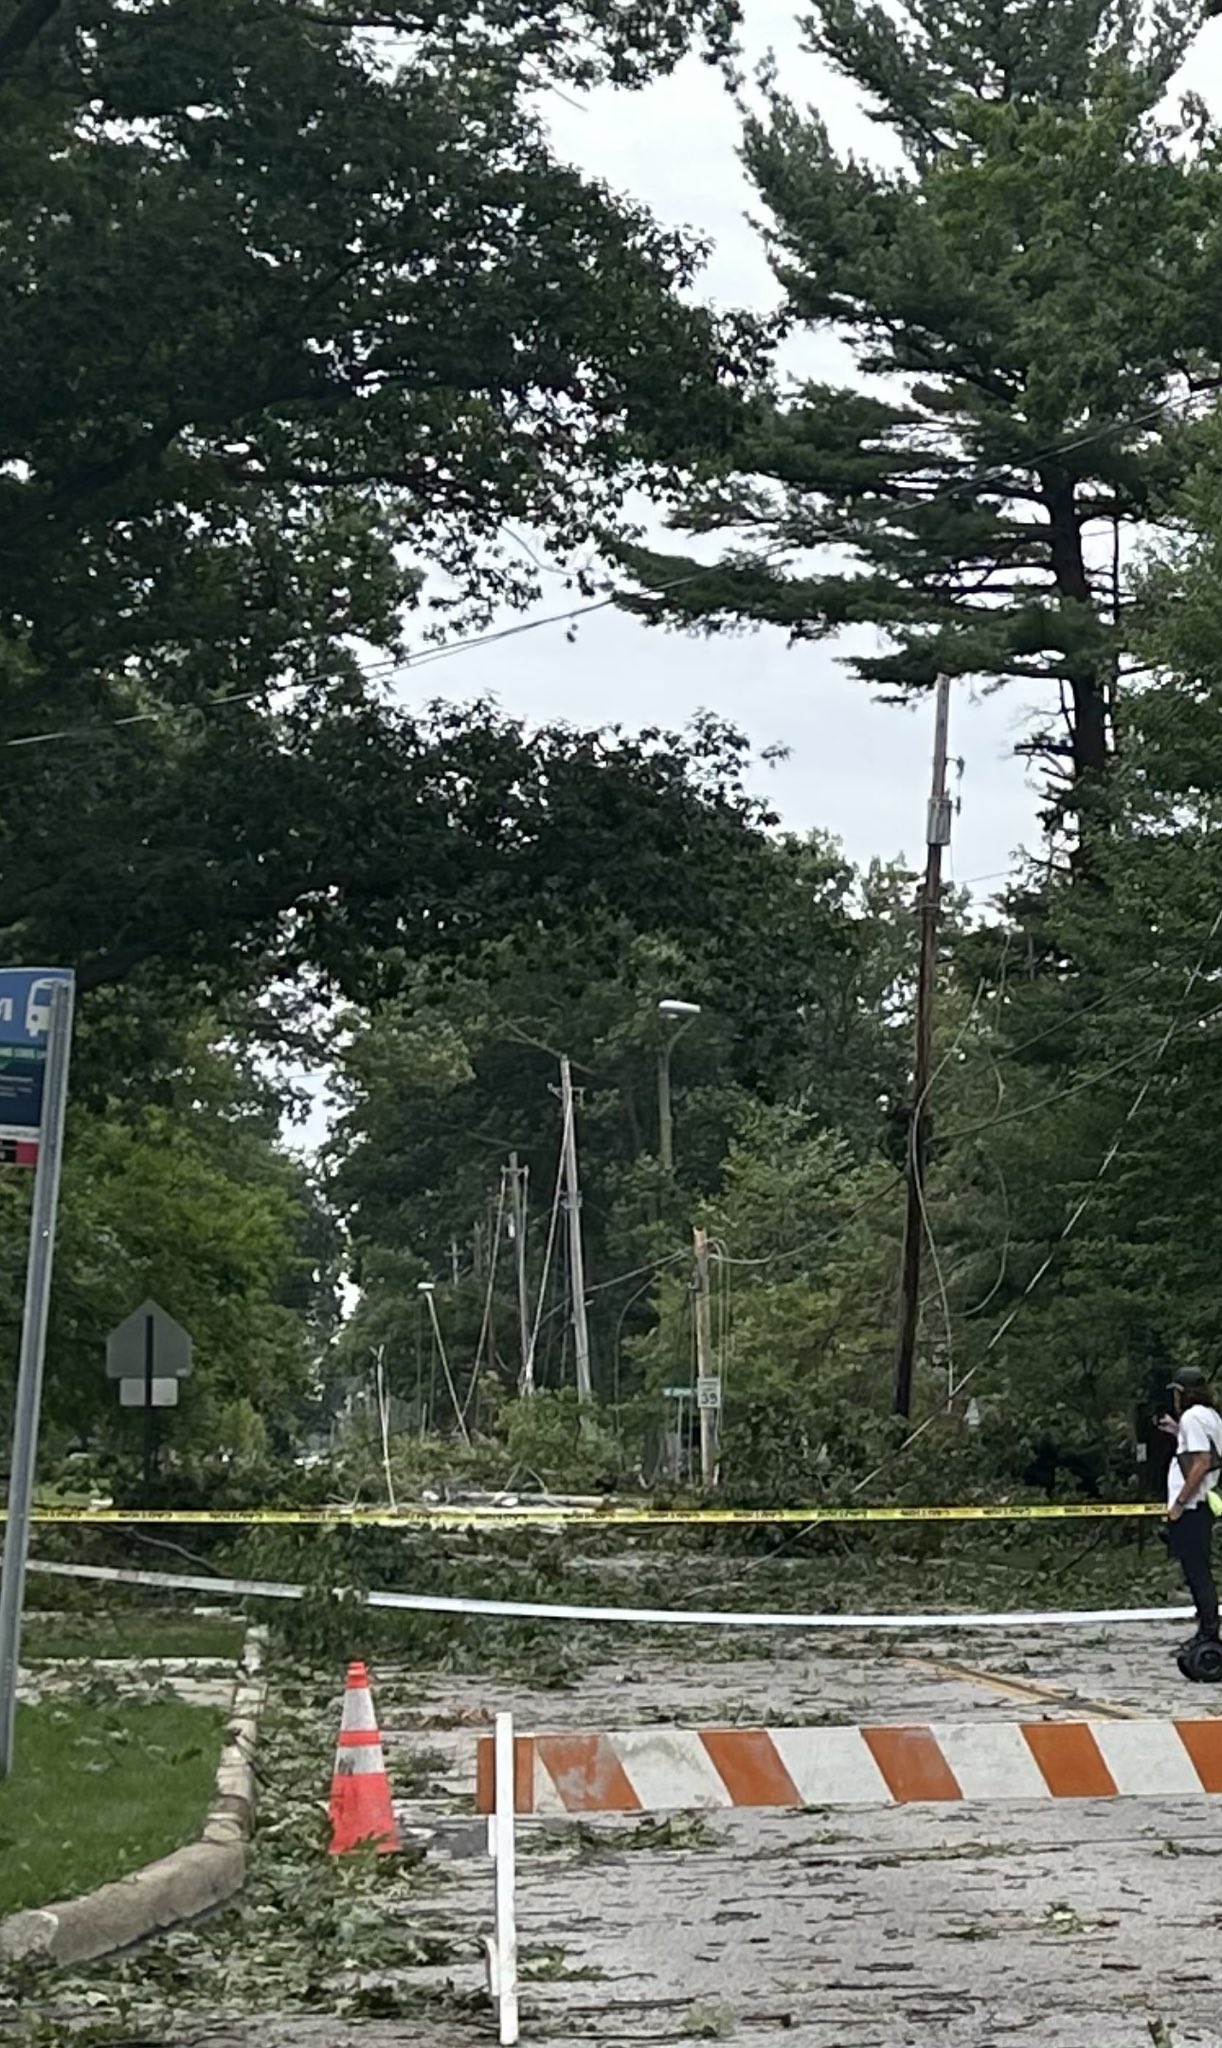
| Rocky River on Laurel Avenue. Photo credit: Amanda Greenfield | Cleveland Hopkins Airport. Photo credit: Chuck Cali | Avon Photo credit: Garrett | Wolf Road by Huntington Reservation. Photo credit: Emily Mahoney |
|
 |
 |
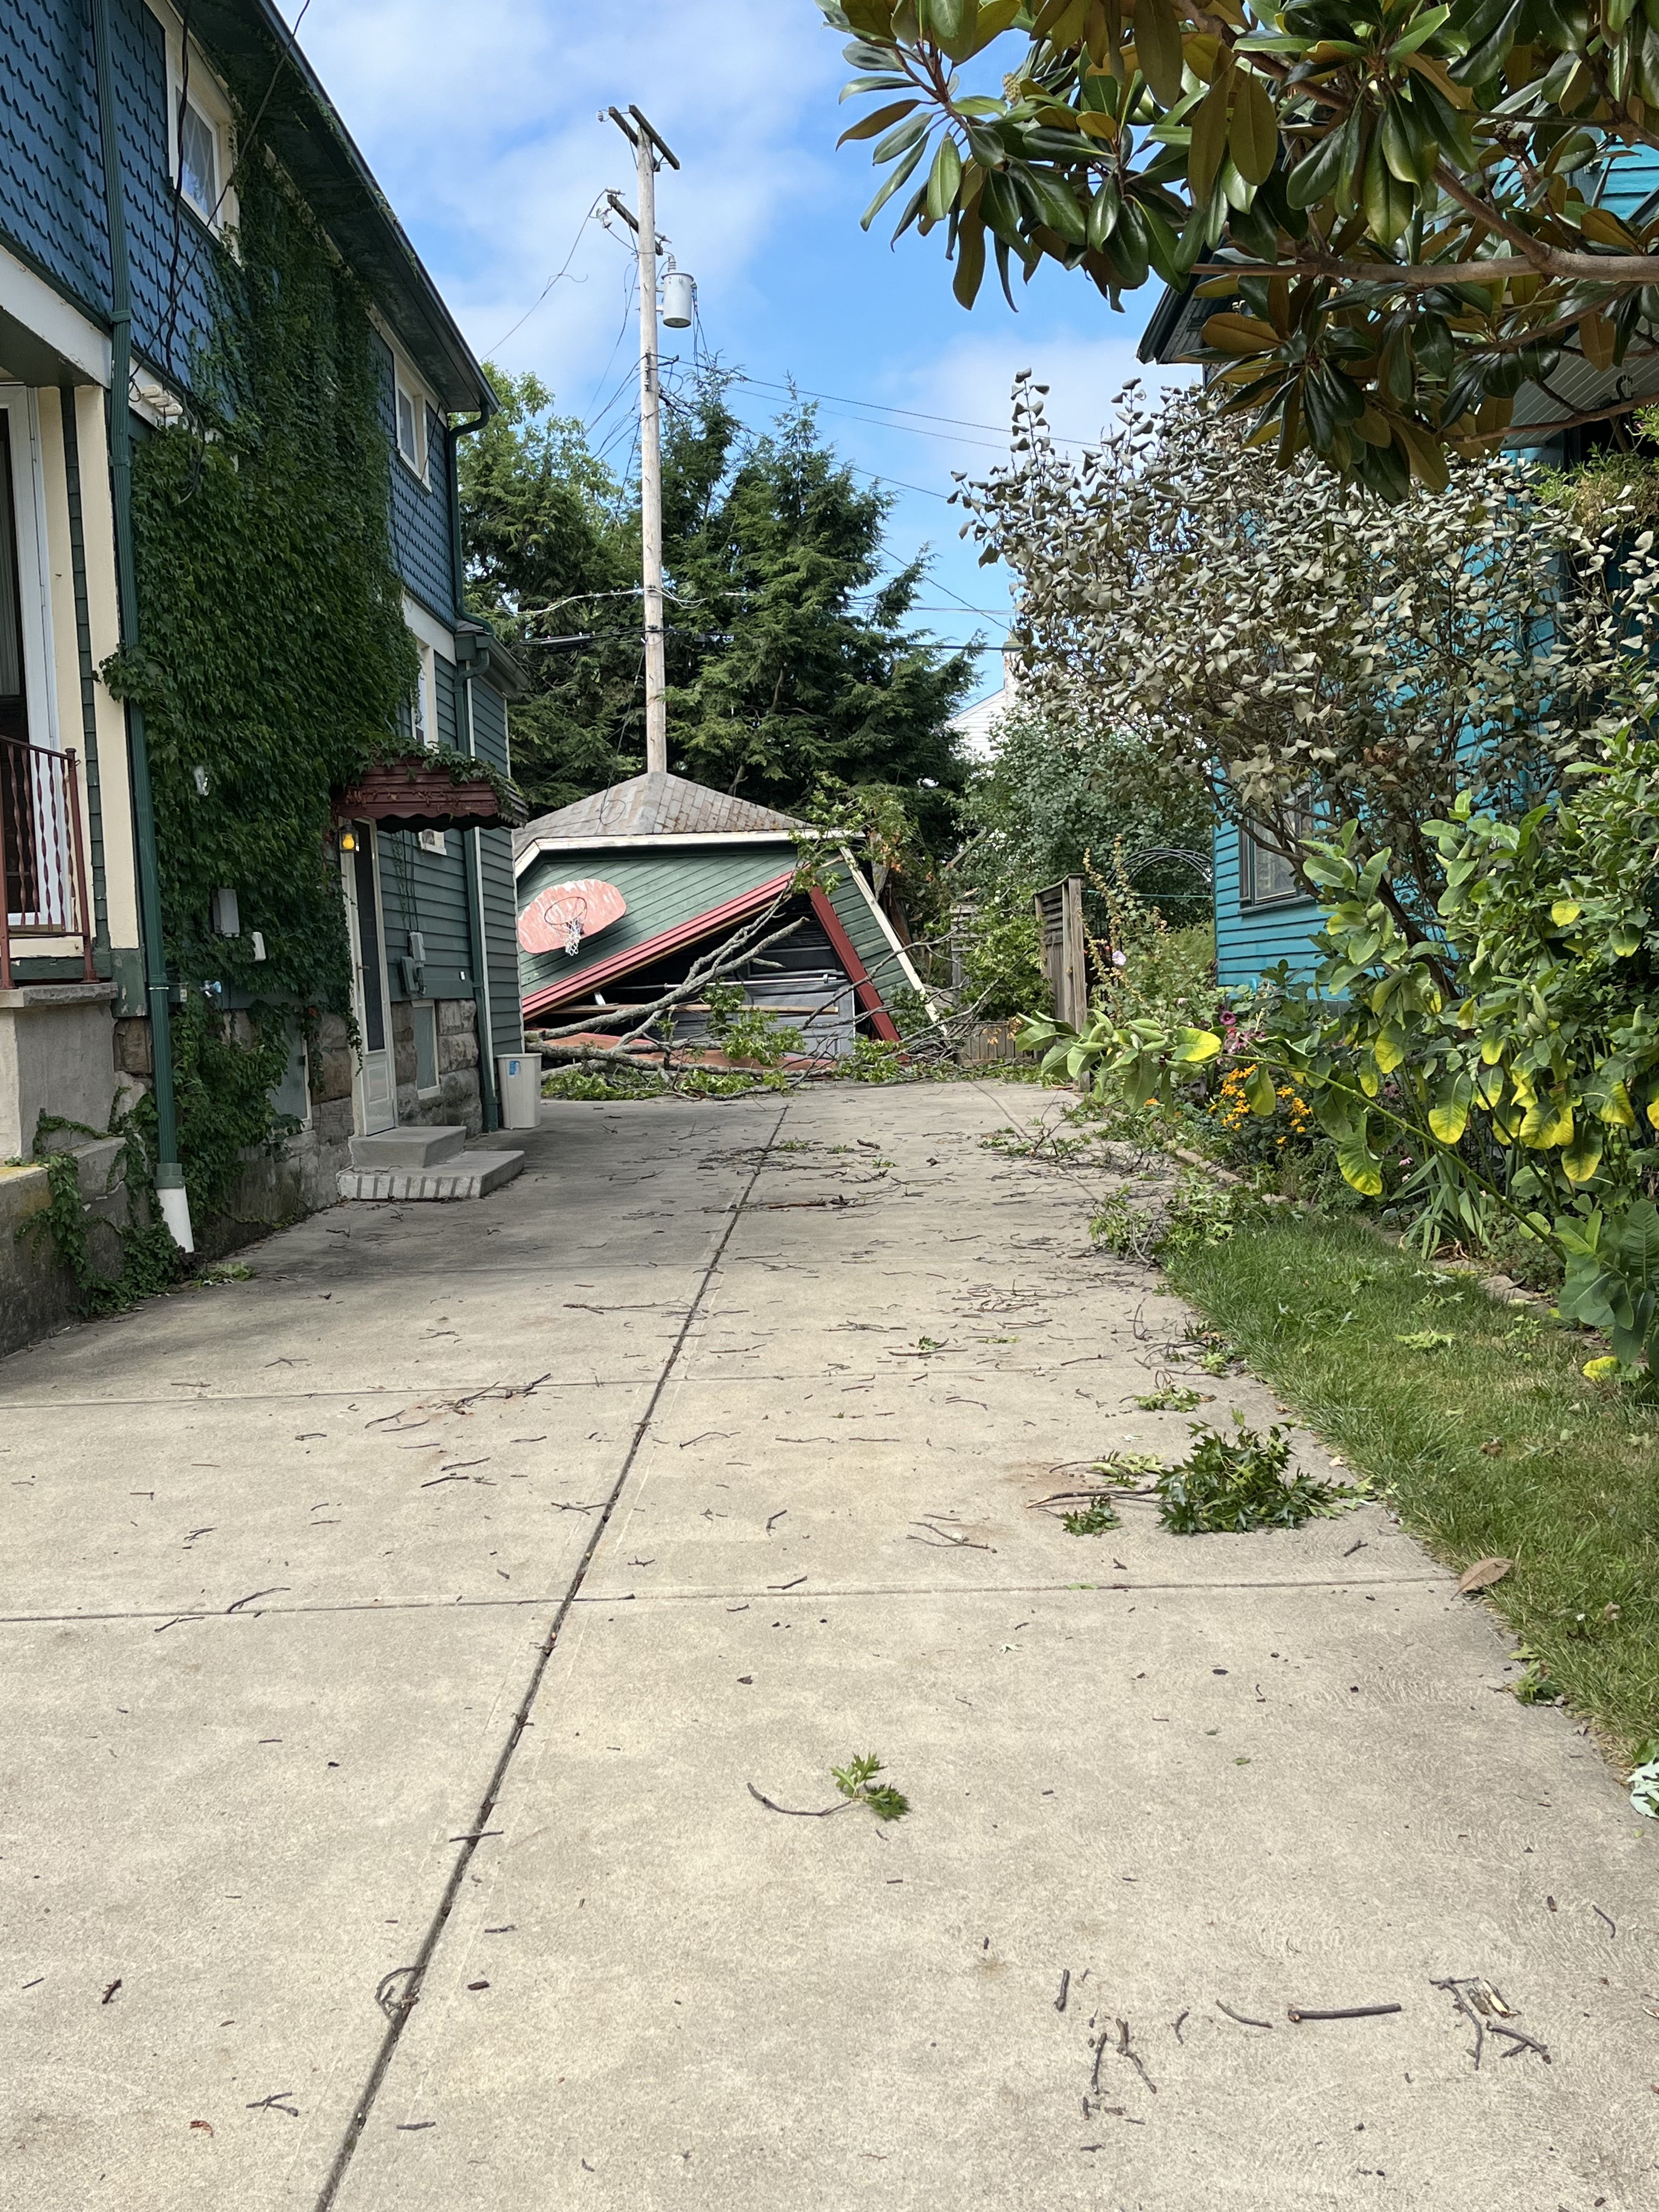 |
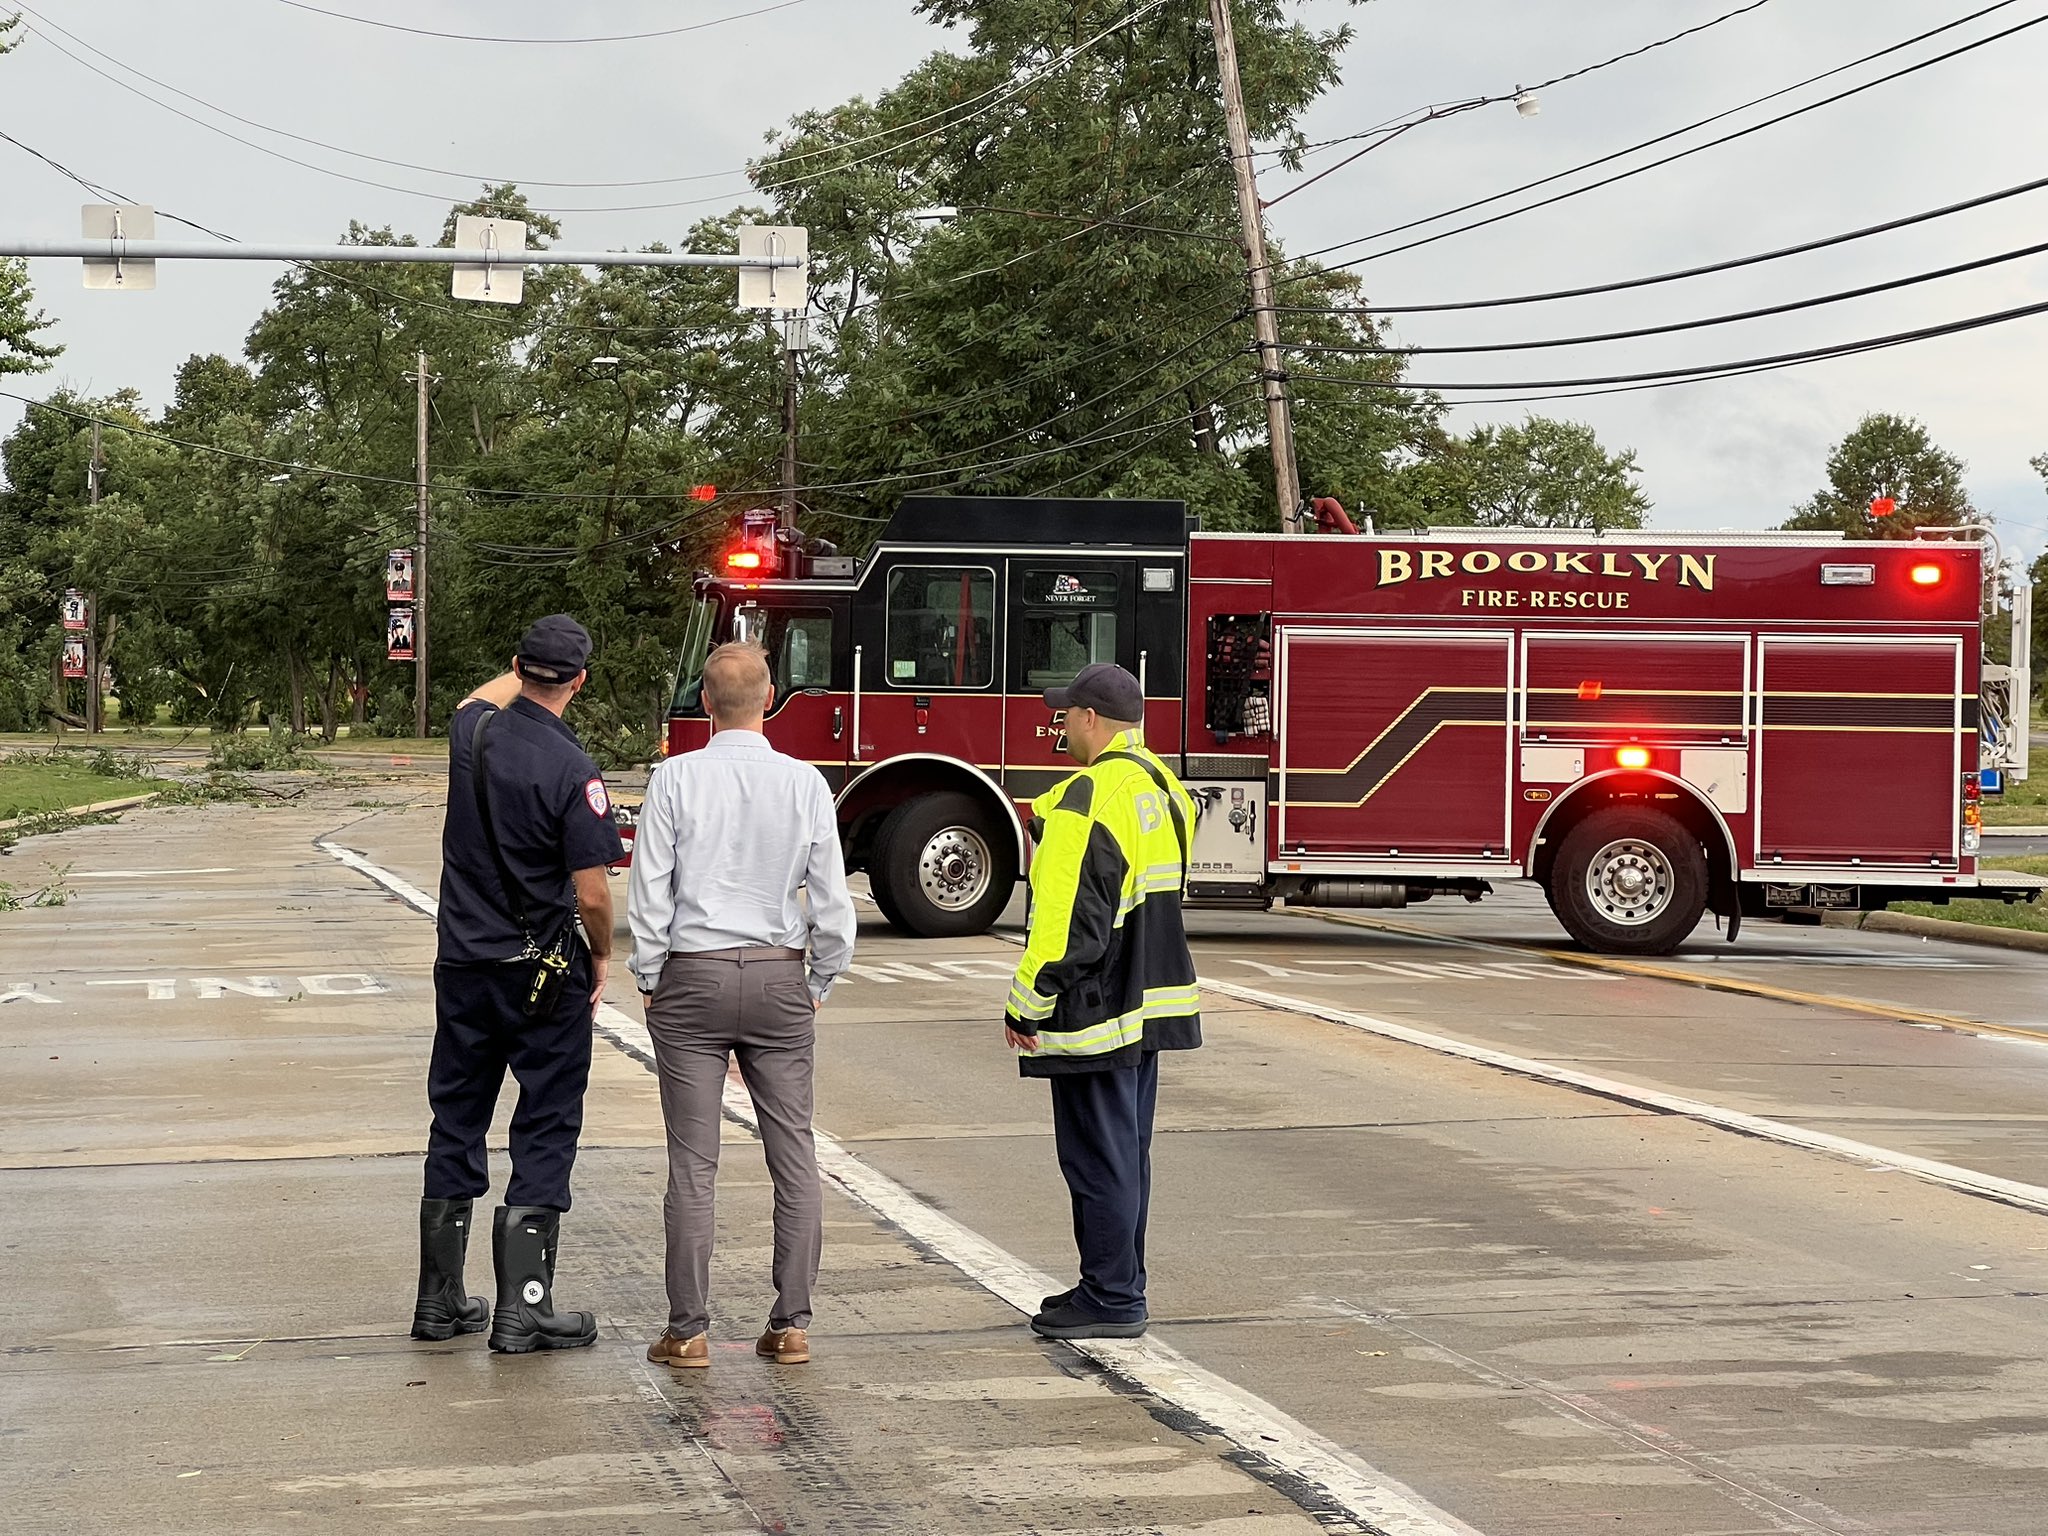
| Seven Hills | Parma Heights Big Creek Parkway Photo credit: Michael Garvin | Orchard Avenue and Williamston Avenue in Brooklyn. Photo credit: Jeff Christner | Lakewood Photo credit: MC |
 |
 |
 |
 |
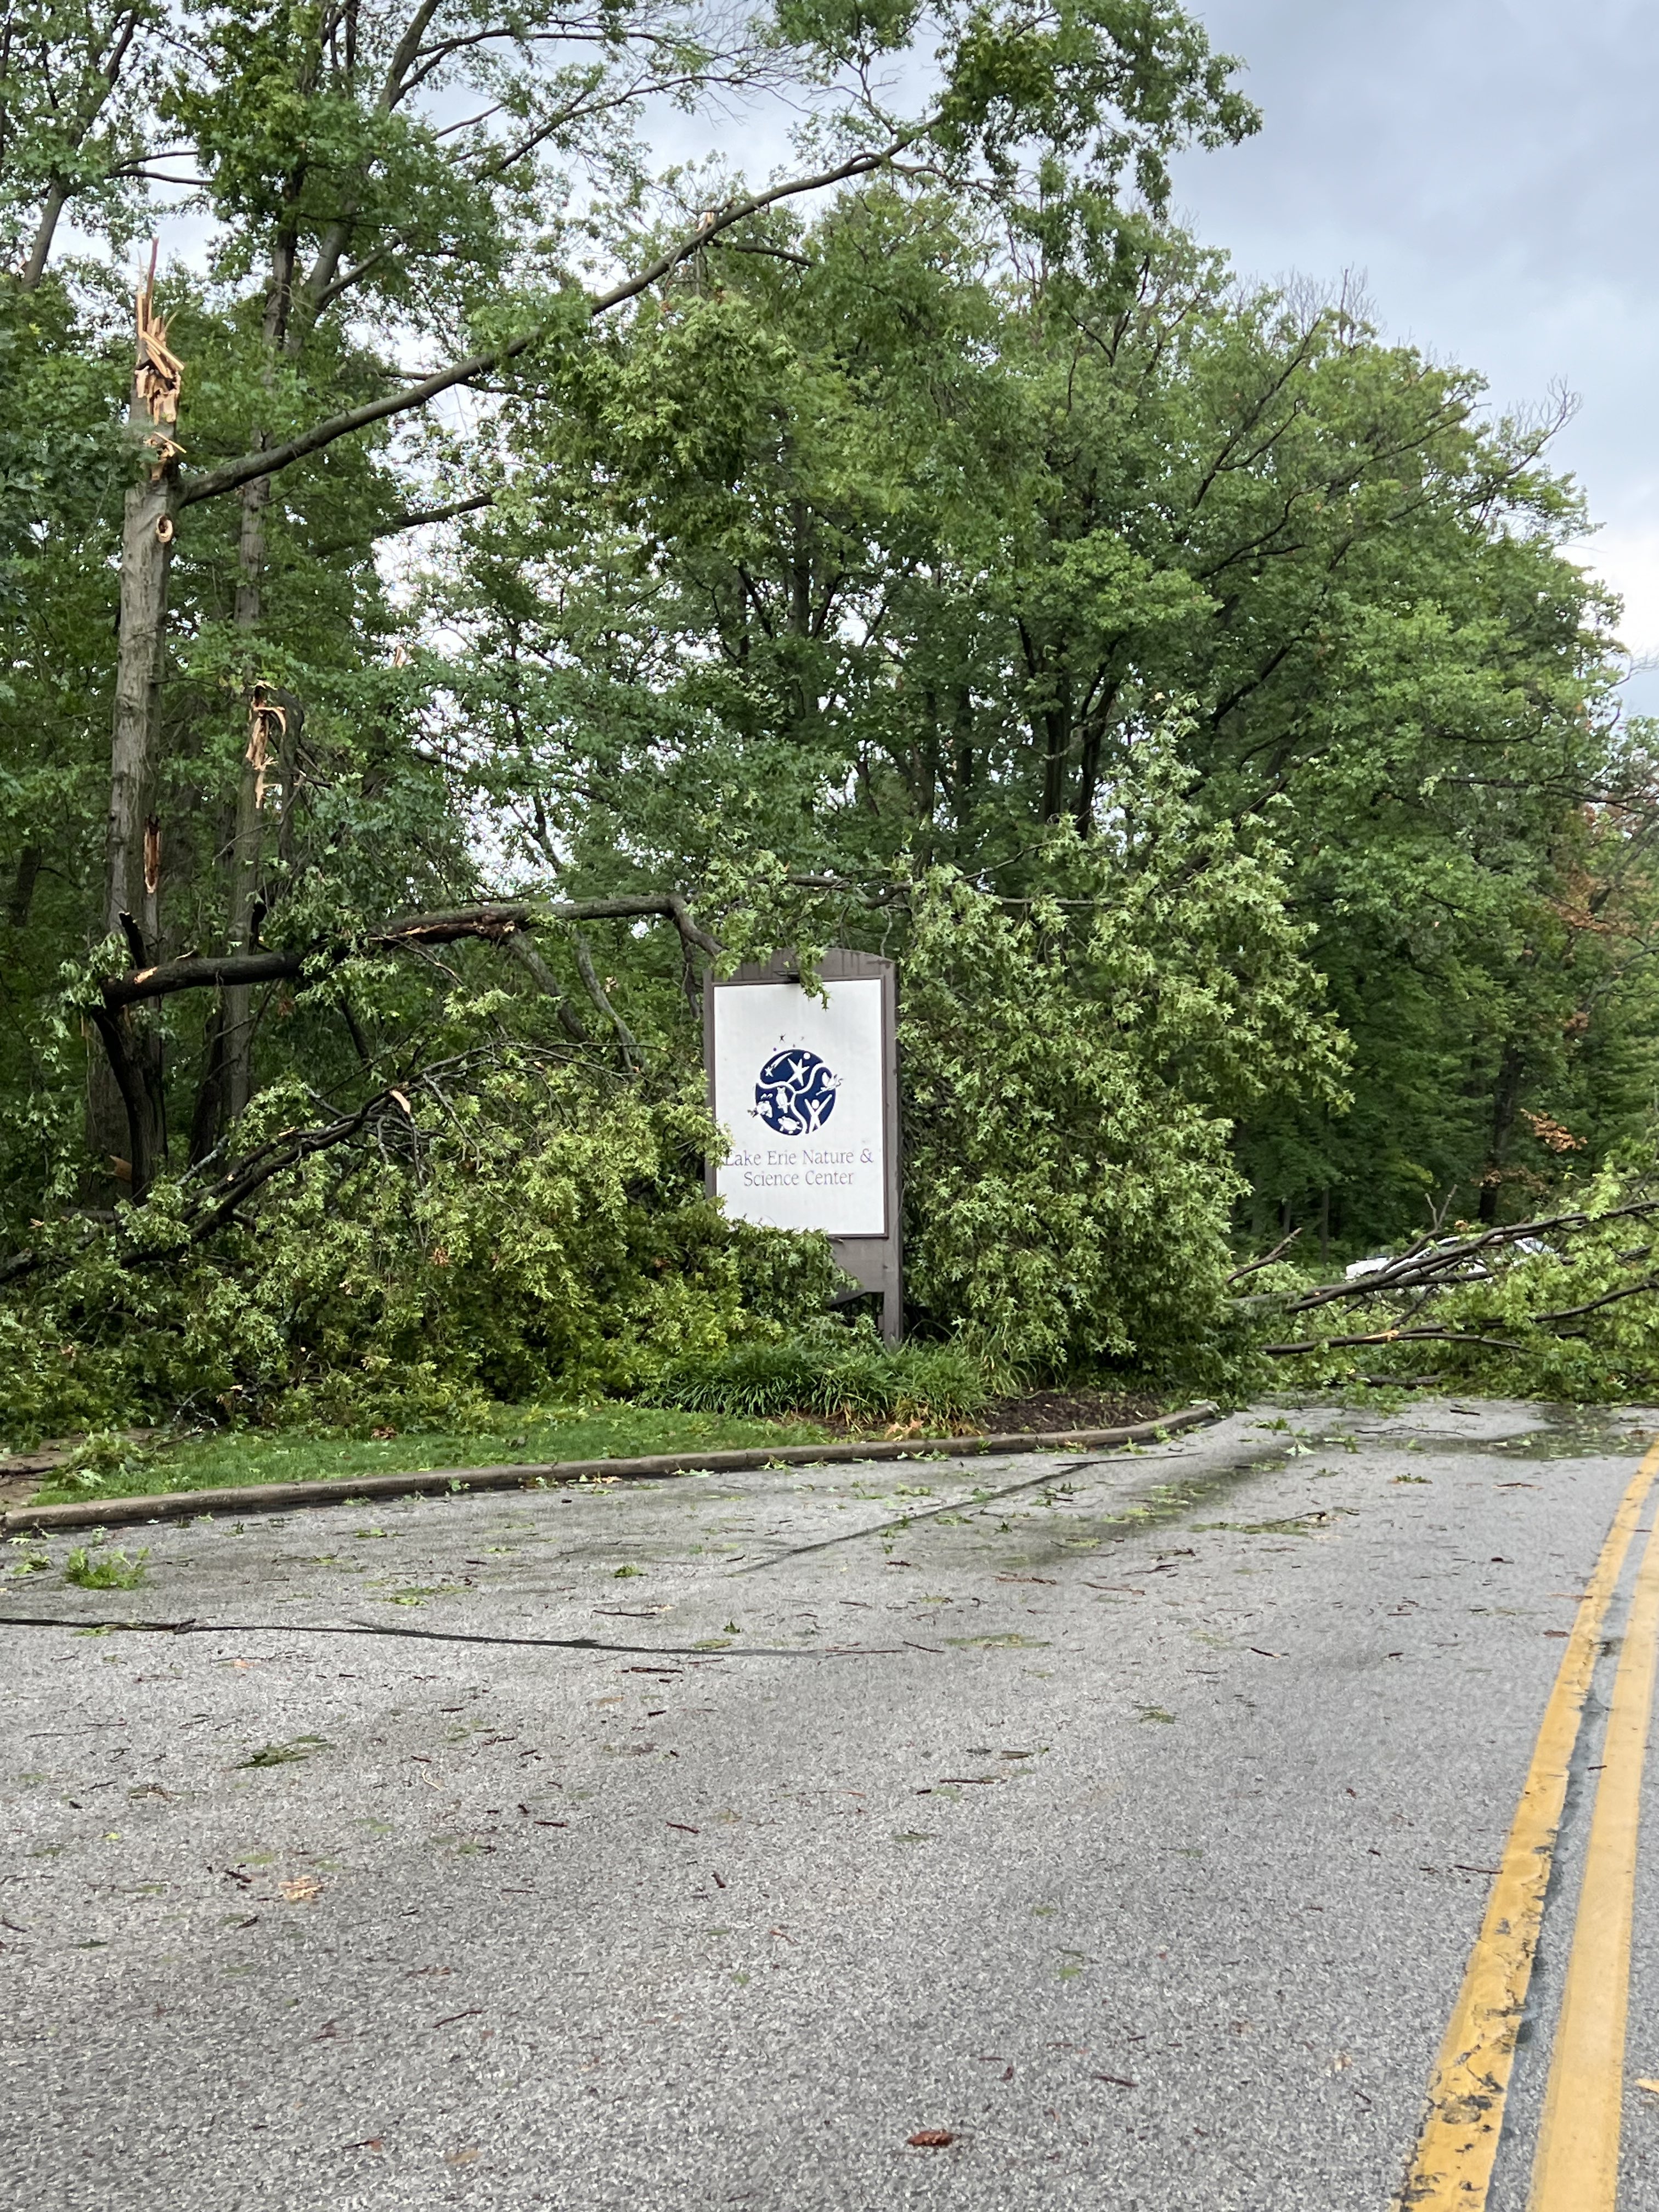
| Lake Erie Nature and Science Center. Photo credit: Evan | Garfield Heights | Gates Mills. Photo credit: Kristin Smith | Biddulph Road and Ridge Road Brooklyn. Photo credit: Jeff Christner |
 |
 |
 |
 |
| Bay Village. Photo Credit: Tj Salay | Bay Village at Osborn Rd and Woodpark Drive. Photo credit: Evan | Bay Village. Photo Credit: Dave Phillips | Brook Park |
 |
 |
 |
 |
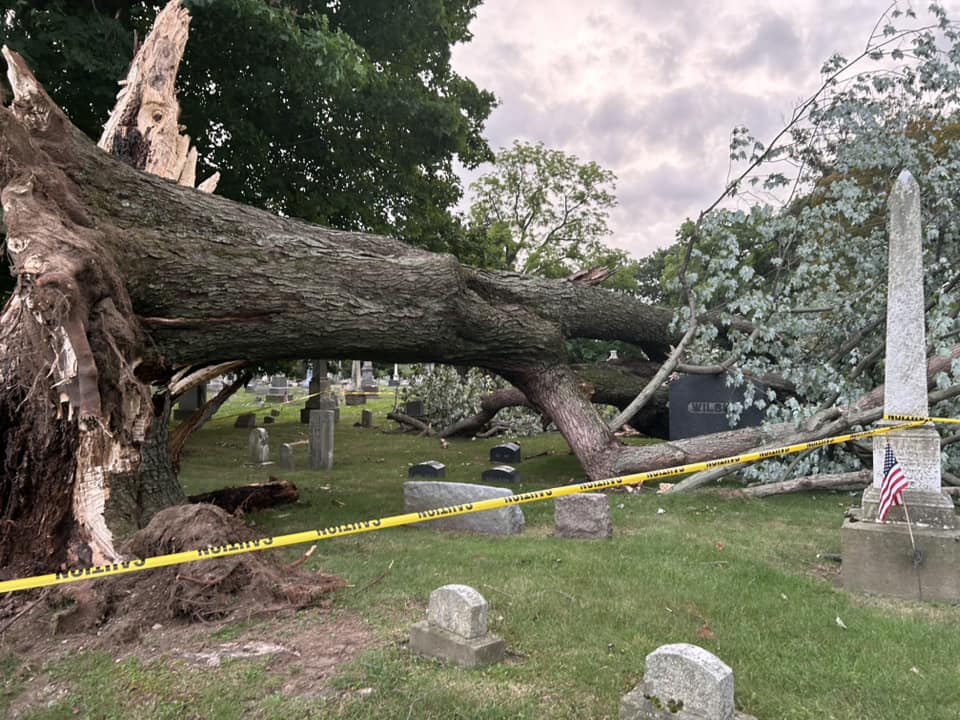
| Munson Photo credit: Amy Richmond | Nowlen Street Mentor. Photo credit: Danielle Semick | Evergreen Cemetery in Painesville. Photo credit: Hannah Elizabeth | Waite Hill Photo Credit: Natalie McNamara |
 |
 |
 |
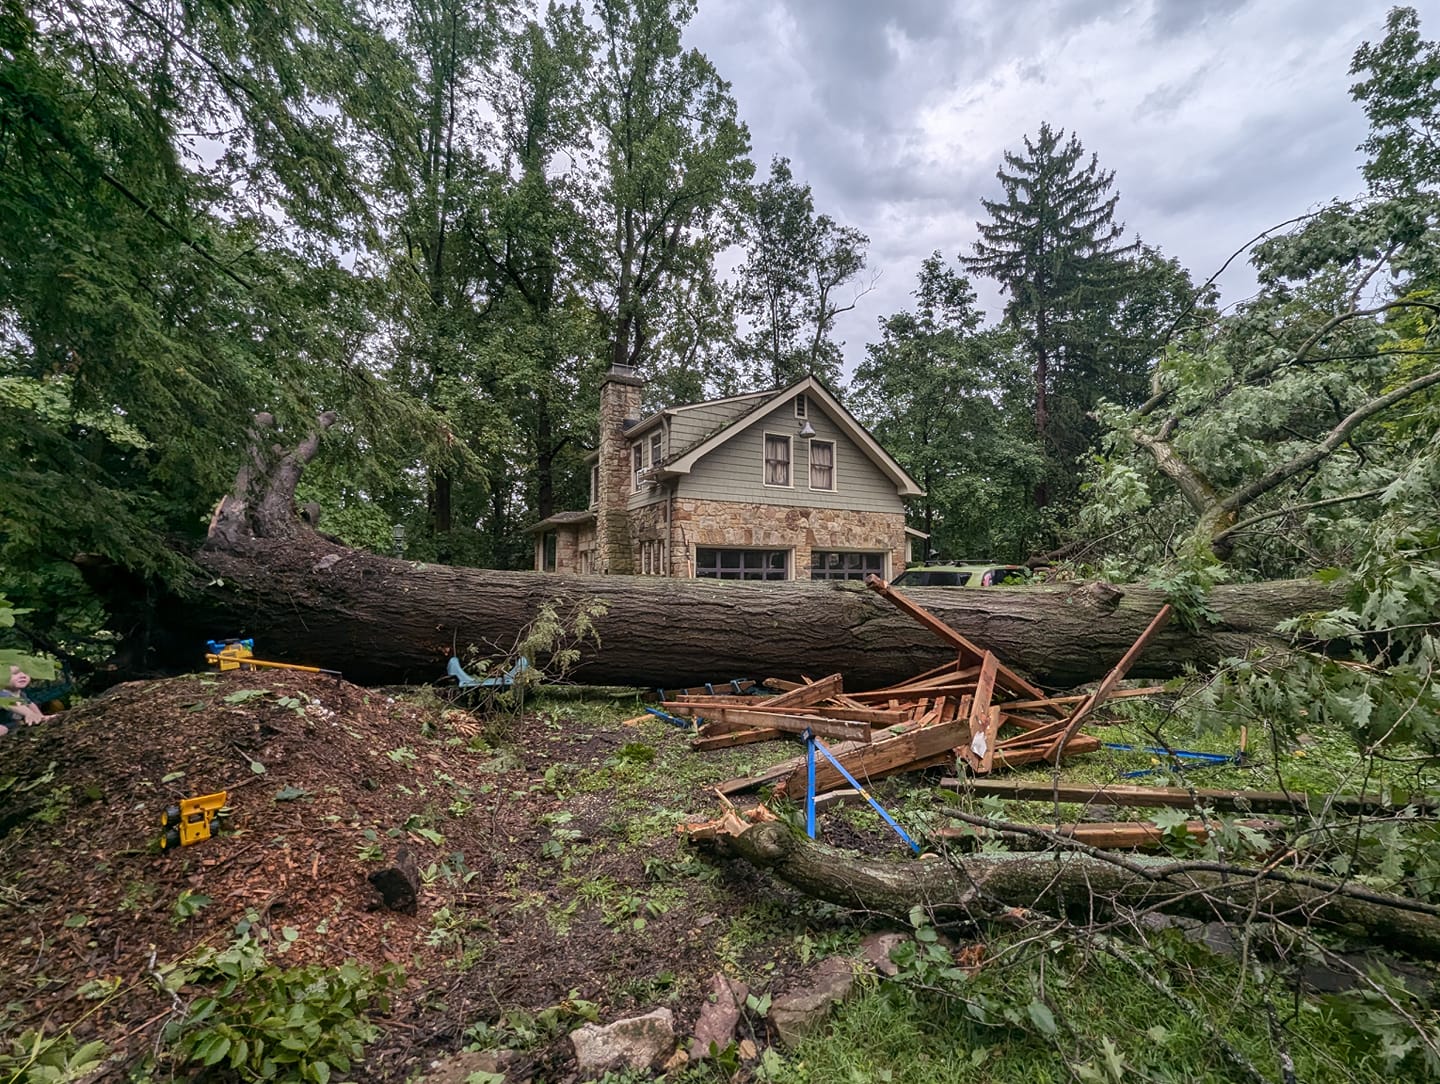 |
| Mentor Photo Credit: Jessica Habat | Lorain Photo credit: Erin Burton | Chesterland Photo Credit: Ann Smorado | Chesterland Photo credit: Staci Shaffer |
Radar
 |
 |
 |
 |
| Radar loop showing base reflectivity (upper left), base velocity (upper right), correlation coefficient (bottom left), and storm relative velocity (bottom right) associated with the Avon Lake to Rocky River. Note the appearance of a rotational velocity couplet from Bay Village to near the Rocky River/Lakewood border, and an occasional tornadic debris signature (lower correlation coefficient values along with high reflectivity and a rotational couplet). | Radar loop showing base reflectivity (upper left), base velocity (upper right), correlation coefficient (bottom left), and storm relative velocity (bottom right) for the Brook Park to Bedford tornado. Note the appearance of a rotational velocity couplet from Brook Park to Bedford and a tornado debris signature (lower correlation coefficient values along with high reflectivity and a rotational couplet). After the tornado dissipated in Bedford, strong straight-line winds accelerated across southern Solon doing tree damage. | Radar loop showing base reflectivity (upper left), base velocity (upper right), correlation coefficient (bottom left), and storm relative velocity (bottom right) for the Richfield tornado. Note how a small rotational couplet develops while crossing out of Cuyahoga County into Richfield, with a tornado debris signature (lower correlation coefficient values along with high reflectivity and a rotational couplet) briefly developing thereafter. The couplet and debris signature quickly dissipated over Boston Township. | Radar loop showing base reflectivity (upper left), base velocity (upper right), correlation coefficient (bottom left), and storm relative velocity (bottom right) for the Chesterland tornado. Note how a small rotational couplet develops over extreme southern Lake County and persists into Chesterland, with a tornado debris signature (lower correlation coefficient values along with high reflectivity and a rotational couplet) briefly developing over Chesterland. |
 |
 |
| Radar loop showing base reflectivity (left) and storm relative velocity (right) as the larger squall line blasted into the Cleveland area and east side. Note the large area of greens and blues (strong "inbound" winds blowing towards the radar at Hopkins Airport) developing over Lake Erie as the squall line organized and pushed onshore. These were very strong winds that developed as a mesovortex near the northern edge of the thunderstorms and enhanced a rear inflow jet, which whipped into the backside of the squall line and led to 70-90 MPH (locally up to 100 MPH) winds across parts of Cuyahoga, Lake, and Geauga Counties. | Radar loop showing base reflectivity (left) and base velocity (right) as the larger squall line blasted across parts of Lake, Geauga, Ashtabula, Portage, Trumbull, Mahoning, and Crawford (PA) Counties. This is from the radar located just west of Pittsburgh, PA, as it has a better viewing angle on the strong northerly winds that did damage with this squall line. Note the pockets of enhanced wind that came across parts of Geauga County into western Trumbull County and from southern Ashtabula County into northern and eastern Trumbull County. These winds may have locally reached 70-80 MPH. |
Storm Reports
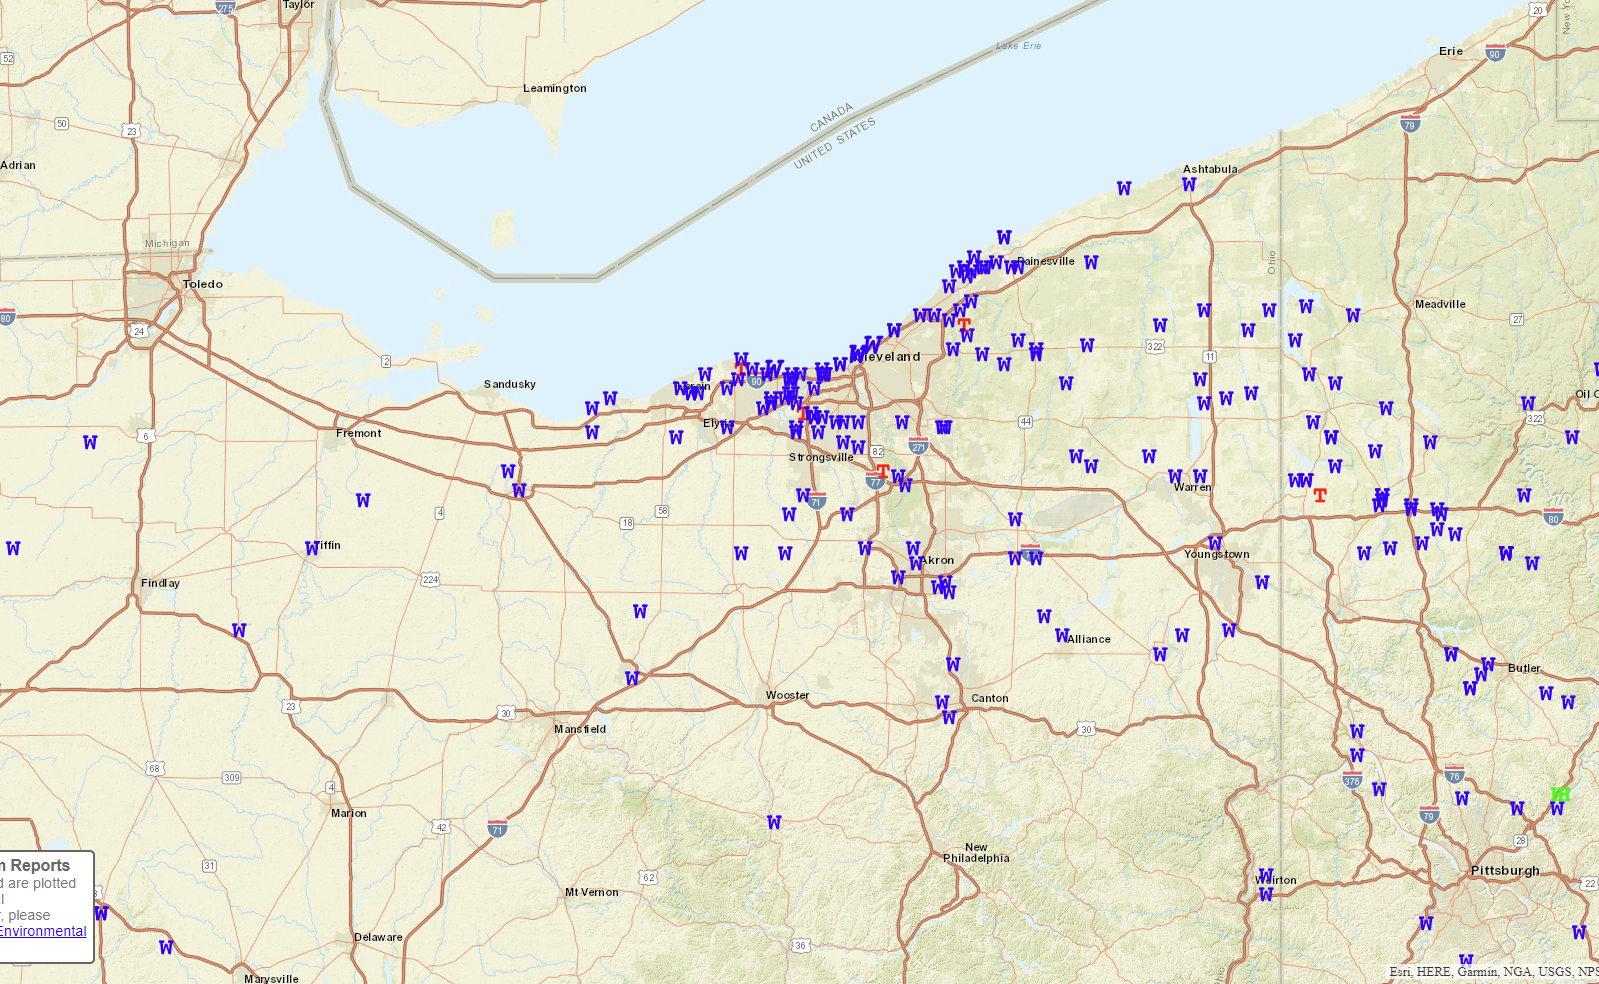 |
| Map of wind damage reports (blue) and tornadoes (red). Click the image to enlarge. Interactive map. Full list of reports in chronological order. |
Environment
 |
 |
 |
| Figure 1: Loop of analyzed fronts and pressure centers, courtesy of the Weather Prediction Center. Note the low pressure tracking along a slow-moving front across northern Ohio. | Figure 2: Loop of hourly 300 mb analyzed winds and divergence. Note the divergence over the region near the right-entrance quadrant of a departing jet streak, adding large-scale lift. | Figure 3: Loop of hourly 500 mb analyzed heights, vorticity, and vorticity advection. Note the subtle height falls and positive vorticity advection through the afternoon of August 6th, suggesting broad upward motion. |
 |
 |
 |
| Figure 4: Loop of hourly mean lowest 100 mb mixing ratio and streamlines, depicting the quality and depth of low-level moisture. Note the pooling of moisture near the frontal boundary over northern Ohio, which helped lead to strong instability with daytime heating. | Figure 5: Loop of hourly MLCAPE and effective deep-layer shear. Note how MLCAPE values climbed to 1500-2500 J/KG across northern Ohio with effective shear values ranging from 30-40 knots across central Ohio to 40-50 knots over Lake Erie and far northeast Ohio. | Figure 6: Loop of effective Significant Tornado Parameter, depicting where instability, deep-layer shear, low-level shear, and low-level moisture are conducive to tornado development. Note the increase across northeastern Ohio Tuesday afternoon as the squall line approached and moved through. |
 |
 |
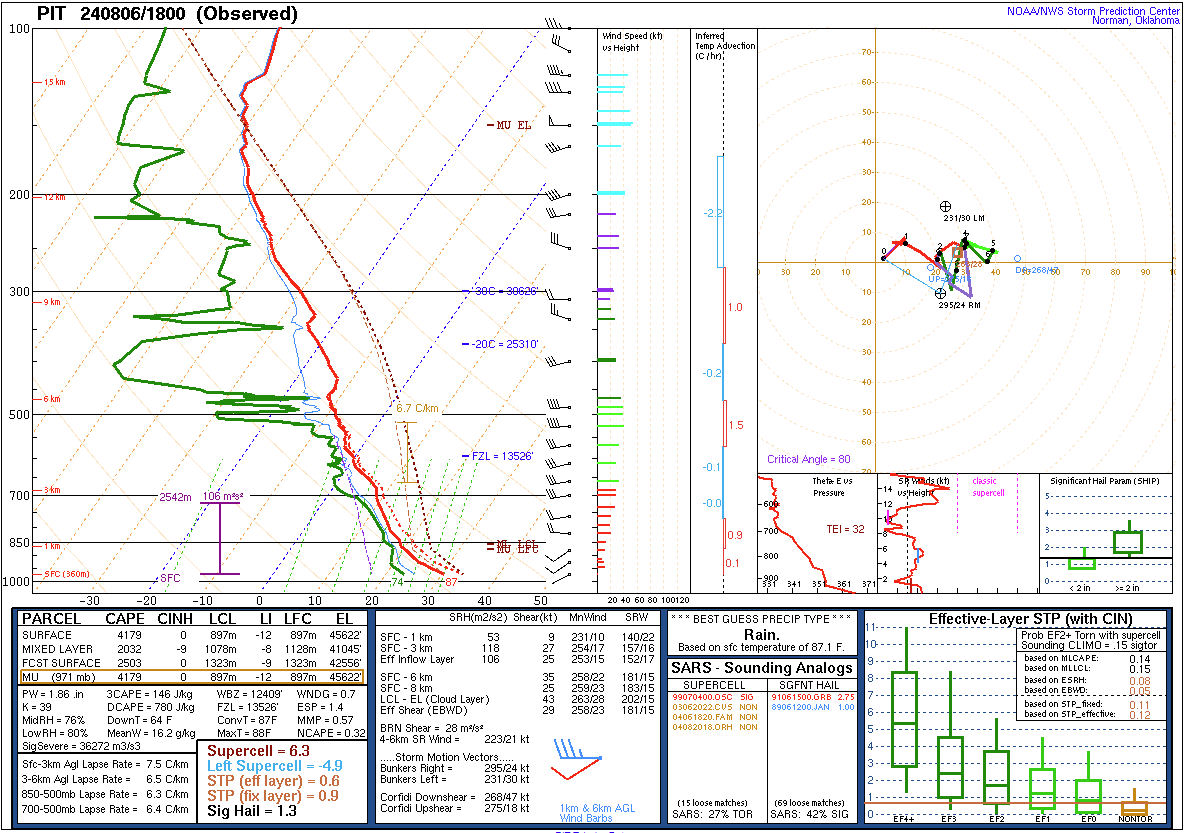 |
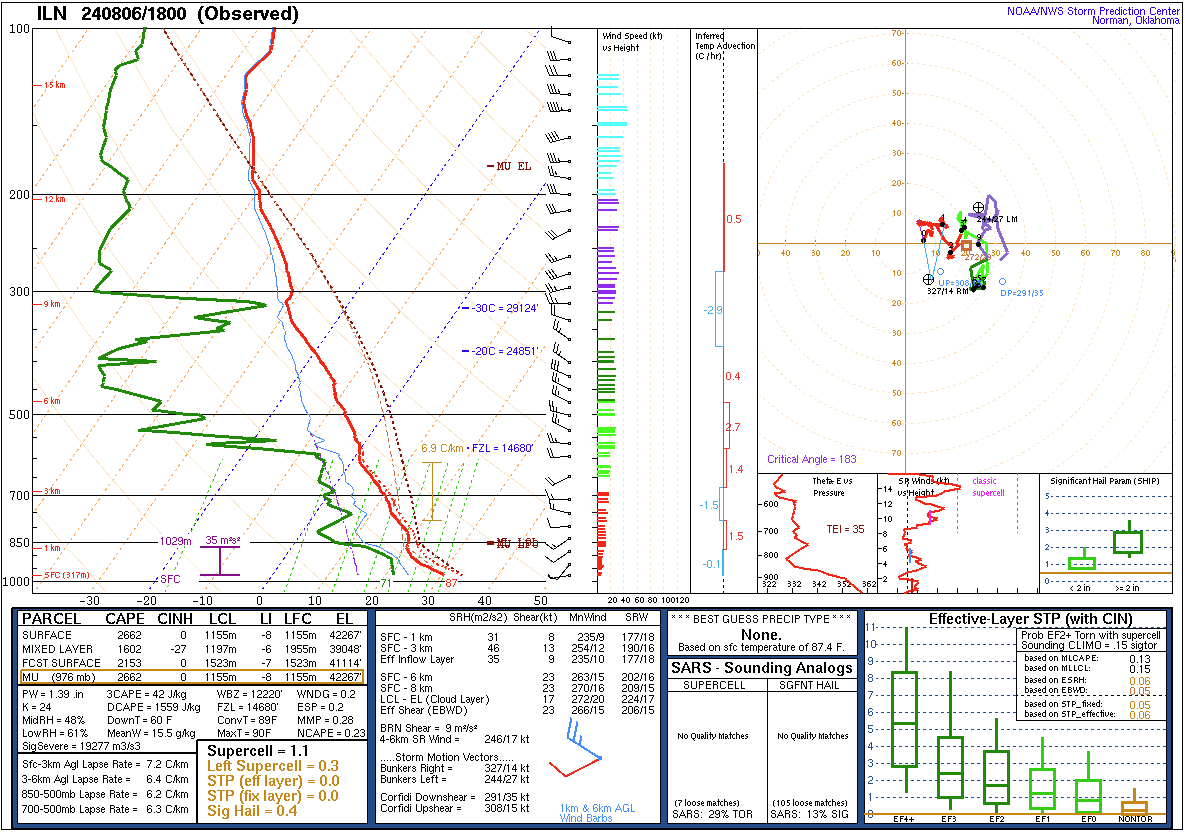
| Figure 7: Loop of hourly 0-3km bulk shear and CAPE. Note the westerly 40-50 knot 0-3 km shear vectors from Lake Erie into northeastern Ohio over-lapping with elevated values of low-level instability. This favored mesovortex development (which can encourage tornadoes and widespread straight-line wind damage) with north-south oriented squall lines. | Figure 8: Observed sounding from Wilmington, OH valid at 2 PM August 6th, 2024. Note the moderate instability, dry air aloft (which can enhance downdrafts and subsequent thunderstorm wind potential) and modest wind shear. Shear was stronger over northern Ohio. | Figure 9: Observed sounding from Pittsburgh, PA valid at 2 PM August 6th, 2024. Note the strong instability and slightly stronger wind shear than in Wilmington. Shear was stronger over northern Ohio and far northwestern Pennsylvania. |
*Figures 2-7 produced via Storm Prediction Mesoanalysis Page.
 |
Media use of NWS Web News Stories is encouraged! Please acknowledge the NWS as the source of any news information accessed from this site. |
|


.png)