Overview
|
On Monday, February 15th and Tuesday, February 16th, an upper-level trough over the southern Great Plains lifted northeast across the mid-Mississippi Valley and Great Lakes region. Meanwhile at 300mb, a 120 knot jet streak ahead of the trough and another 170 knot jet streak northeast of the Great Lakes region, resulted in synoptic scale lift across the region. At the surface, a surface low of approximately 1008 mb developed over the southern Gulf States, deepening to 1000 mb as it moved northeast across the Tennessee and Ohio Valleys to northwest Pennsylvania by 12Z Tuesday, February 16th. Significant moisture advection occurred between 925 mb and 700 mb along with vertical lift associated with isentropic upglide and synoptic forcing previously mentioned. A deformation zone across the region resulted in moderate frontogenesis, primarily between 925-850 mb, which allowed for mesoscale banding to produce very heavy snowfall across portions of the western NWS CLE CWA and points farther west and north, with up to a foot of snow measured in the Toledo, OH area and 6-12” west of a line from far western Cuyahoga County to western Morrow county. Less than 6” of snow was observed elsewhere in the CLE CWA due to mainly sleet and some freezing rain mixing in for much of the event. Significant temperature advection at or near 850mb, allowed warm temperatures aloft to produce a favorable thermal profile for sleet, despite surface temperatures in the low to mid 20s. Maximum wet bulb temperatures of freezing or higher reached as far northwest as Cuyahoga County with some of our southeast counties (e.g. Mahoning County) as high as 2 degrees C. As the main synoptic portion of the event ended on the early morning of Tuesday, February 16, breaks in the ice across Lake Erie allowed for lake effect snow to impact the primary snowbelt region. This lake effect snow, albeit mostly light, became moderate to heavy at some points throughout the day and evening on February 16, resulting in additional snow accumulations of around 6 to 8 inches in the aforementioned areas. You can visualize the snow accumulations well in the interpolated snowfall image in the upper right. |
|
Photos & Video
 |
 |
|
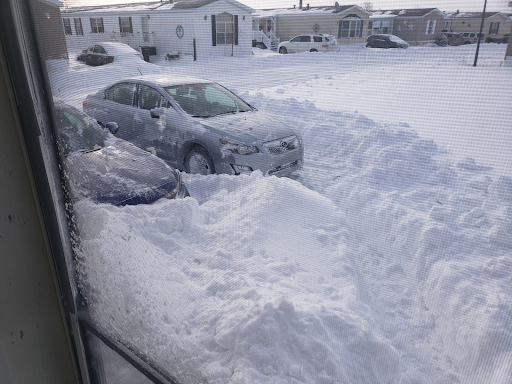
Location: Findlay, OH Photo credit: Jim Martin |
Location: Findlay, OH Photo credit: Larry Kritzell |
Radar
.gif) |
.gif) |
| Radar loop for the event, showing precipitation spreading across the area, and even the lake effect beginning along the lakeshore at the end of the loop. | Top left: reflectivity, top right: velocity, bottom right: correlation coefficient, bottom left: differential reflectivity |
Storm Reports
854
NOUS41 KCLE 171600
PNSCLE
OHZ003-006>014-017>023-027>033-036>038-047-089-PAZ001>003-180400-

Public Information Statement
Spotter Reports
National Weather Service Cleveland OH
1100 AM EST Wed Feb 17 2021

The following are snowfall observations taken during the past 12/24
hours for the storm that has been affecting our region. Appreciation
is extended to highway departments, cooperative observers, Skywarn
spotters and media for these reports. This summary also is available
on our home page at weather.gov/cleveland

**********************12 HOUR SNOWFALL**********************

LOCATION              12 HOUR     TIME/DATE   COMMENTS
                     SNOWFALL           OF
                     /INCHES/   MEASUREMENT

OHIO

...Ashland County...
   3 WSW Hayesville       0.3   820 AM  2/17  Trained Spotter

...Ashtabula County...
   3 ENE Trumbull         4.0   946 AM  2/17  Trained Spotter
   2 N Cherry Valley      3.0   524 AM  2/17  Trained Spotter
   1 ENE Jefferson        2.0   721 AM  2/17  Trained Spotter
   3 E South Madison      0.8   927 AM  2/17  Storm Total = 10.3

...Crawford County...
   1 W Galion               T  1039 AM  2/17  Trained Spotter

...Cuyahoga County...
   2 NNW Euclid           0.5   943 AM  2/17  Storm Total = 8.5
   1 WSW Cleveland Heig   0.5   811 AM  2/17  Storm Total = 7.3
   2 WSW Brooklyn Heigh   0.5   804 AM  2/17  Storm Total = 5.9
   2 SW Cleveland Heigh   0.3   614 AM  2/17  Storm Total = 7.8
   1 W Chagrin Falls      0.3   802 AM  2/17  Storm Total = 8.2
   2 N Brecksville        0.2   922 AM  2/17  Storm Total = 4.8
   Cleveland Hopkins Ai     T   651 AM  2/17  Trained Spotter
   1 NW Lakewood            T   909 AM  2/17  Trained Spotter

...Geauga County...
   2 SE South Madison     5.0   853 AM  2/17  Trained Spotter
   2 W Chardon            3.0   834 AM  2/17  Storm Total = 13.0
   1 S Montville          2.5   745 AM  2/17  Trained Spotter
   2 W Burton             1.2   811 AM  2/17  Storm Total = 6.9
   South Russell          1.0   641 AM  2/17  Storm Total = 13.0
   2 ESE South Thompson   0.6  1013 AM  2/17  Storm Total = 8.2

...Lake County...
   1 NNE Kirtland Hills   3.8   631 AM  2/17  Storm Total = 11.0
   1 NW Concord           1.5   818 AM  2/17  Storm Total = 9.5
   2 ESE Mentor           1.5   841 AM  2/17  Trained Spotter
   1 S Waite Hill         1.4   800 AM  2/17  Storm Total 13.4
   1 E Mentor             1.2   749 AM  2/17  Trained Spotter
   2 WNW Concord          1.1   906 AM  2/17  Storm Total = 9.4
   1 WSW Madison          1.1  1026 AM  2/17  Storm Total = 8.5

...Lorain County...
   2 NE North Ridgevill   0.3   700 AM  2/17  Storm Total = 6.9
   Elyria                 0.1   445 AM  2/17  Trained Spotter

...Mahoning County...
   1 NW Austintown        1.0   832 AM  2/17  Trained Spotter

...Summit County...
   1 N Bath               0.2   709 AM  2/17  Storm Total = 7.1
   Akron-Canton Airport     T   651 AM  2/17  Trained Spotter

...Trumbull County...
   Youngstown Regional      T   651 AM  2/17  Trained Spotter

PENNSYLVANIA

...Crawford County...
   6 E Atlantic           0.8   812 AM  2/17  Storm Total 3.6
   1 NE Meadville         0.5   722 AM  2/17  Storm Total = 5.5

...Erie County...
   2 NW Edinboro          4.5   502 AM  2/17  Trained Spotter
   2 WSW Erie             1.4   659 AM  2/17  Storm Total = 9.4
   2 ESE North East       1.3   706 AM  2/17  Trained Spotter
   3 ENE McKean           1.0   749 AM  2/17  Trained Spotter
   4 S Wesleyville        1.0   659 AM  2/17  Trained Spotter
   4 W Colt Station       1.0   823 AM  2/17  Trained Spotter
   2 W Avonia             0.5   825 AM  2/17  Trained Spotter
   Erie Intl Airport      0.4   700 AM  2/17  Trained Spotter
   1 NNW Girard             T   436 AM  2/17  Trained Spotter


**********************24 HOUR SNOWFALL**********************

LOCATION              24 HOUR     TIME/DATE   COMMENTS
                     SNOWFALL           OF
                     /INCHES/   MEASUREMENT

OHIO

...Ashland County...
   4 SW Ashland           0.2   700 AM  2/17  CoCoRaHS

...Ashtabula County...
   3 E South Madison      6.3   927 AM  2/17  Storm Total = 10.3
   2 NNW Cherry Valley    1.5   900 AM  2/17  Storm Total = 4.5

...Crawford County...
   1 NW Bucyrus           0.1   600 AM  2/17  CoCoRaHS

...Cuyahoga County...
   Cleveland-Kamms Corn   3.0  1251 AM  2/17  Storm Total = 7.5
   ESE South Euclid       2.7   750 AM  2/17  CoCoRaHS
   1 SSW Lakewood         2.0   700 AM  2/17  CoCoRaHS
   1 SSW Westlake         1.6   800 AM  2/17  CoCoRaHS
   2 NNW Parma            1.5   800 AM  2/17  CoCoRaHS
   1 NNE Seven Hills      1.0   700 AM  2/17  CoCoRaHS
   2 SE Brecksville       0.6   700 AM  2/17  CoCoRaHS
   1 NW Berea             0.5   600 AM  2/17  CoCoRaHS
   1 SE Strongsville      0.5   800 AM  2/17  CoCoRaHS

...Erie County...
   3 SSW Huron            0.5   800 AM  2/17  CoCoRaHS
   2 NNE Castalia         0.5   630 AM  2/17  CoCoRaHS

...Geauga County...
   1 E Chardon            6.5   800 AM  2/17  Co-Op Observer
   1 NE Middlefield       3.0   800 AM  2/17  CoCoRaHS

...Lake County...
   3 SW Willoughby        5.3   700 AM  2/17  CoCoRaHS

...Lorain County...
   3 NE North Ridgevill   1.6   700 AM  2/17  CoCoRaHS
   6 SW Wellington        1.0   800 AM  2/17  CoCoRaHS
   1 ENE Oberlin          0.8   730 AM  2/17  Trained Spotter
   SE Elyria              0.4   445 AM  2/17  CoCoRaHS

...Lucas County...
   7 NNE Swanton          0.5   700 AM  2/17  CoCoRaHS

...Mahoning County...
   1 N Canfield           0.4   845 AM  2/17  CoCoRaHS

...Medina County...
   5 WNW Wadsworth        1.8   500 AM  2/17  CoCoRaHS
   1 ENE Medina           0.5   730 AM  2/17  CoCoRaHS

...Morrow County...
   5 ESE Mount Gilead     1.5   600 AM  2/17  CoCoRaHS

...Portage County...
   1 NNW Mantua           1.5   745 AM  2/17  CoCoRaHS
   1 E Ravenna            1.2   720 AM  2/17  CoCoRaHS
   1 W Craig Beach        1.0   700 AM  2/17  Co-Op Observer
   4 NE Kent              0.8   800 AM  2/17  CoCoRaHS
   2 SSW Streetsboro      0.8   700 AM  2/17  CoCoRaHS

...Richland County...
   1 NNE Shelby           8.0  1159 PM  2/16  CoCoRaHS
   1 NW Lexington         0.2   800 AM  2/17  CoCoRaHS

...Summit County...
   1 SW Munroe Falls      0.4   700 AM  2/17  Co-Op Observer
   1 NNE Tallmadge        0.2   700 AM  2/17  CoCoRaHS

...Trumbull County...
   Mosquito Creek Lake    0.2   700 AM  2/17  Co-Op Observer

...Wood County...
   2 WSW Perrysburg       2.0   500 AM  2/17  CoCoRaHS

PENNSYLVANIA

...Crawford County...
   1 S Meadville          3.0   807 AM  2/17  Storm Total = 6.0
   7 NW Meadville         2.4   700 AM  2/17  CoCoRaHS
   3 WNW Springboro       2.0   700 AM  2/17  Co-Op Observer
   2 W Titusville         1.6   700 AM  2/17  Co-Op Observer

...Erie County...
   2 SSW Corry            3.5   900 AM  2/17  Trained Spotter


***********************SNOW ON GROUND***********************

LOCATION                 SNOW     TIME/DATE   COMMENTS
                     ON GROUND           OF
                     /INCHES/   MEASUREMENT

OHIO

...Ashland County...
   3 WSW Hayesville      10.0   820 AM  2/17  Trained Spotter
   4 SW Ashland           5.8   700 AM  2/17  CoCoRaHS

...Ashtabula County...
   3 E South Madison     15.0   927 AM  2/17  Storm Total = 10.3
   3 ENE Trumbull        14.0   946 AM  2/17  Trained Spotter
   2 ESE Pierpont        13.0   801 AM  2/17  Trained Spotter
   2 N Cherry Valley      9.0   524 AM  2/17  Trained Spotter
   1 ENE Jefferson        8.0   721 AM  2/17  Trained Spotter
   2 NNW Cherry Valley    5.0   900 AM  2/17  Storm Total = 4.5

...Crawford County...
   1 W Galion            14.0  1039 AM  2/17  Trained Spotter
   3 WSW Tiro            14.0   716 AM  2/17  Trained Spotter
   1 NE Bucyrus          13.0   700 AM  2/17  Co-Op Observer
   1 NNE Bucyrus         12.0   700 AM  2/17  CoCoRaHS
   1 NW Bucyrus           9.5   600 AM  2/17  CoCoRaHS

...Cuyahoga County...
   ESE South Euclid      11.3   750 AM  2/17  CoCoRaHS
   1 W Chagrin Falls     11.0   802 AM  2/17  Storm Total = 8.2
   1 SSW Lakewood        11.0   700 AM  2/17  CoCoRaHS
   1 WSW Cleveland Heig  11.0   811 AM  2/17  Storm Total = 7.3
   2 WSW Brooklyn Heigh  10.0   804 AM  2/17  Storm Total = 5.9
   Cleveland-Kamms Corn  10.0  1251 AM  2/17  Storm Total = 7.5
   1 SSW Westlake         9.0   800 AM  2/17  CoCoRaHS
   2 NNW Euclid           9.0   943 AM  2/17  Storm Total = 8.5
   2 NNW Parma            8.5   800 AM  2/17  CoCoRaHS
   1 SE Strongsville      8.0   800 AM  2/17  CoCoRaHS
   2 SW Cleveland Heigh   8.0   614 AM  2/17  Storm Total = 7.8
   2 N Brecksville        8.0   922 AM  2/17  Storm Total = 4.8
   1 NW Lakewood          7.0   909 AM  2/17  Trained Spotter
   2 SE Brecksville       7.0   700 AM  2/17  CoCoRaHS
   Cleveland Hopkins Ai   6.0   651 AM  2/17  Trained Spotter
   2 W Shaker Heights     1.4   700 AM  2/17  CoCoRaHS
   1 NNE Seven Hills      1.3   700 AM  2/17  CoCoRaHS

...Geauga County...
   South Russell         17.0   641 AM  2/17  Storm Total = 13.0
   2 W Chardon           15.0   834 AM  2/17  Storm Total = 13.0
   1 E Chardon           14.0   800 AM  2/17  Co-Op Observer
   2 SE South Madison    14.0   853 AM  2/17  Trained Spotter
   1 S Montville         13.0   745 AM  2/17  Trained Spotter
   2 ESE South Thompson  12.0  1013 AM  2/17  Storm Total = 8.2
   2 W Burton             7.0   811 AM  2/17  Storm Total = 6.9
   1 NE Middlefield       7.0   800 AM  2/17  CoCoRaHS

...Lake County...
   1 S Waite Hill        16.0   800 AM  2/17  Storm Total 13.4
   1 WSW Madison         12.0  1026 AM  2/17  Storm Total = 8.5
   1 NNE Kirtland Hills  12.0   631 AM  2/17  Storm Total = 11.0
   3 SW Willoughby       12.0   700 AM  2/17  CoCoRaHS
   1 NW Concord          12.0   818 AM  2/17  Storm Total = 9.5
   2 WNW Concord         11.0   906 AM  2/17  Storm Total = 9.4
   2 ESE Mentor          11.0   841 AM  2/17  Trained Spotter
   1 E Mentor            10.0   749 AM  2/17  Trained Spotter

...Lorain County...
   1 ENE Oberlin         12.0   730 AM  2/17  Trained Spotter
   1 S Oberlin           11.0   800 AM  2/17  Co-Op Observer
   2 NE North Ridgevill  11.0   700 AM  2/17  Storm Total = 6.9
   3 NE North Ridgevill   9.5   700 AM  2/17  CoCoRaHS
   Elyria                 9.0   445 AM  2/17  Trained Spotter
   3 SE Elyria            6.0   819 AM  2/17  Trained Spotter
   SE Elyria              1.3   445 AM  2/17  CoCoRaHS

...Lucas County...
   2 NNE Waterville      17.0   900 AM  2/17  CoCoRaHS
   7 NNE Swanton         14.0   700 AM  2/17  CoCoRaHS
   3 SSW Oregon          13.0   800 AM  2/17  CoCoRaHS

...Mahoning County...
   1 N Canfield           5.0   845 AM  2/17  CoCoRaHS
   1 NW Austintown        4.0   832 AM  2/17  Trained Spotter

...Medina County...
   2 E Homerville         7.0   841 AM  2/17  Storm Total = 5.8
   5 WNW Wadsworth        7.0   500 AM  2/17  CoCoRaHS

...Morrow County...
   5 ESE Mount Gilead    11.5   600 AM  2/17  CoCoRaHS

...Portage County...
   1 SSW Brady Lake       8.0   655 AM  2/17  Trained Spotter
   1 E Ravenna            6.2   720 AM  2/17  CoCoRaHS
   1 W Craig Beach        6.0   700 AM  2/17  Co-Op Observer
   4 NE Kent              6.0   800 AM  2/17  CoCoRaHS
   1 NNW Mantua           6.0   745 AM  2/17  CoCoRaHS
   2 W Kent               5.0   700 AM  2/17  CoCoRaHS
   2 SSW Streetsboro      1.4   700 AM  2/17  CoCoRaHS

...Richland County...
   1 NNE Shelby          11.7  1159 PM  2/16  CoCoRaHS
   Mansfield Lahm Airpo  10.0   700 AM  2/17  Trained Spotter

...Sandusky County...
   2 ENE Fremont         15.0   720 AM  2/17  CoCoRaHS

...Summit County...
   1 N Bath               9.0   709 AM  2/17  Storm Total = 7.1
   1 NNE Tallmadge        7.6   700 AM  2/17  CoCoRaHS
   1 SW Munroe Falls      5.0   700 AM  2/17  Co-Op Observer
   Akron-Canton Airport   4.0   651 AM  2/17  Trained Spotter

...Trumbull County...
   Youngstown Regional   18.0   700 AM  2/17  Trained Spotter
   Mosquito Creek Lake    3.0   700 AM  2/17  Co-Op Observer

...Wood County...
   2 WSW Perrysburg      15.0   500 AM  2/17  CoCoRaHS

PENNSYLVANIA

...Crawford County...
   1 S Meadville         11.0   807 AM  2/17  Storm Total = 6.0
   3 WNW Springboro      10.0   700 AM  2/17  Co-Op Observer
   1 NE Meadville        10.0   722 AM  2/17  Storm Total = 5.5
   6 E Atlantic           9.0   812 AM  2/17  Storm Total 3.6
   2 W Titusville         7.0   700 AM  2/17  Co-Op Observer

...Erie County...
   4 W Colt Station      18.0   823 AM  2/17  Trained Spotter
   4 S Wesleyville       18.0   659 AM  2/17  Trained Spotter
   2 SSW Corry           17.0   900 AM  2/17  Trained Spotter
   2 ESE North East      14.0   706 AM  2/17  Trained Spotter
   2 S North East        14.0   820 AM  2/17  CoCoRaHS
   2 NW Edinboro         13.0   502 AM  2/17  Trained Spotter
   2 WSW Erie            11.0   659 AM  2/17  Storm Total = 9.4
   2 W Avonia             7.0   825 AM  2/17  Trained Spotter
   Erie Intl Airport      4.0   700 AM  2/17  Trained Spotter
Environment
Precipitation type was tricky for this event, with temperature advection at or near the 850 mb level stronger, and slightly further displaced north than forecast. This allowed for sleet to mix with snow along and east of the I-71 corridor, resulting in lower snow totals. However, west of the I-71 corridor, precipitation remained as snow for the entirety of the event, leading to higher snow totals.
 |
 |
 |
| Figure 1: Dprog/Dt of the Nam12, showing the northward trend of warmer 850 mb temperatures shifting northwards into the region. | Figure 2: Frontogenesis (purple contours) at the 850 mb level, showing strong banded precipitation potential across Northwest Ohio. Also shown are heights (black contour) and temperatures (dashed lines). | Figure 3: Maximum wet bulb temperatures in the lowest 400 mb from the SPC mesoanalysis. Note the 0 degrees Celsius line, denoted by the purple contour, moving north along and east of the I-71 corridor. Temperatures that are less than 0 degrees Celsius are blue-colored whereas temperatures greater than 0 degrees Celsius are red-colored. |
 |
 |
 |
| Figure 4: Nam forecast sounding at KCAK (Akron-Canton Regional Airport). Note the warm nose at or near 0 degrees Celsius situated between the 700 and 850 mb layer. In reality, the warm nose was most likely around 1 to 2 degrees Celsius and was fairly deep. This allowed sleet to be the prevailing precipitation type. | Figure 5: SPC mesoanalysis showing the prevailing precipitation type across the region. In particular, note the northward-extent of the purple numbers (4/5/6), indicating sleet, while the blue numbers out west (7/8/9) were indicating snow. | Figure 6: HREF dominant precipitation type forecast at midnight on Feb 15. Note the sleet line, shown in pink, with snow (blue) to the north and west, freezing rain (red) to the south and east, and rain (green). Just a small change in the temperature profile aloft shifted this line about 50 to 100 miles northwest, resulting in a sharp gradient of snowfall totals. |
 |
Media use of NWS Web News Stories is encouraged! Please acknowledge the NWS as the source of any news information accessed from this site. |
|


