The information in this document is preliminary and unofficial. Official climate request can be made through the National Center for Environmental Information or the Midwestern Regional Climate Center.
Click on each tab to see climate information from the different locations.
|
Highs |
Lows |
|||
|
2/3 |
63 |
None in 2016 |
|
|
|
2/20 |
67 |
|
|
|
|
3/9 |
73 |
|
|
|
|
11/2 |
77 |
|
|
|
|
11/18 |
73 |
|
|
|
|
12/26 |
65 |
|
|
|
March was the 7th warmest on record. The average temperature for the month was 45.3 degrees.
April was the 7th snowiest on record. The total snowfall for the month was 5.1 inches.
May was tied for the 4th snowiest on record with several other years. A trace of snow was reported.
August was the warmest August ever on record. The average temperature for the month was 76.7 degrees.
September was the 4th warmest on record. The average temperature for the month was 68.9 degrees.
September was the 6th wettest on record. The total rainfall for the month was 6.54 inches.
November was the 9th warmest on record. The average temperature for the month was 45.9 degrees.
2016 was the 5th warmest year ever in Akron-Canton with an average temperature of 53.0 degrees.
The 2015-2016 Winter Season was tied for the 6th least snowiest Winter with 1968-1969 with 30.2 inches of snow.
The yearly average temperature was 53.0 degrees. The normal average yearly temperature is 50.1 degrees.
The yearly total precipitation was 38.65 inches. The normal yearly precipitation is 39.56.
The yearly total snowfall was 42.1 inches.
The warmest temperature for the year was 95 on 7/23 and 8/11.
The coldest temperature for the year was -3 on 2/14.
The greatest daily snowfall was on 2/16. 4.1 inches of snow fell.
The wettest day was 6/16. 1.84 inches of rain fell.
|
Highs |
Lows |
|||
|
2/3 |
63 |
None in 2016 |
|
|
|
6/11 |
94 |
|
|
|
|
7/13 |
95 (Tie) |
|
|
|
|
8/5 |
94 (Tie) |
|
|
|
|
9/7 |
94 (Tie) |
|
|
|
|
10/17 |
82 (Tie) |
|
|
|
|
11/2 |
78 |
|
|
|
|
11/18 |
74 |
|
|
|
|
12/26 |
68 |
|
|
|
March was the 7th warmest on record. The average temperature for the month was 44.8 degrees.
April was tied for the 8th snowiest on record with 1952. The total snowfall for the month was 7.8 inches.
May was tied for the 9th snowiest on record with 2011 and several other years. A trace of snow was reported.
July was the 5th warmest on record. The average temperature for the month was 76.8 degrees.
August was tied for the warmest August ever on record with 1947. The average temperature for the month was 77.8 degrees.
September was the 2nd warmest on record. The average temperature for the month was 70.5 degrees.
October was tied for the 8th warmest on record with 1949. The average temperature for the month was 59.2 degrees.
November was tied for the 2nd warmest on record with 2001 and 1902. The average temperature for the month was 48.8 degrees.
2016 was the warmest year ever in Cleveland with an average temperature of 54.2 degrees.
The yearly average temperature was 54.2 degrees. The normal average yearly temperature is 50.7 degrees.
The yearly total precipitation was 36.47 inches. The normal yearly precipitation is 39.10.
The yearly total snowfall was 42.1 inches.
The warmest temperature for the year was 95 on 7/13 and 7/22.
The coldest temperature for the year was 1 on 2/14.
The greatest daily snowfall was on 4/9. 4.0 inches of snow fell.
The wettest day was 6/16. 1.26 inches of rain fell.
|
Highs |
Lows |
|||
|
2/1 |
58 (Tie) |
4/10 |
20 |
|
|
2/3 |
63 |
|
|
|
|
2/20 |
66 (Tie) |
|
|
|
|
2/28 |
64 |
|
|
|
|
5/28 |
90 (Tie) |
|
|
|
|
6/20 |
92 (Tie) |
|
|
|
|
6/26 |
92 (Tie) |
|
|
|
|
11/18 |
75 |
|
|
|
|
12/26 |
63 (Tie) |
|
|
|
March was the 7th warmest on record. The average temperature for the month was 42.9 degrees.
March was also the 10th least snowiest on record. The total snowfall for the month was 1.1 inches.
August was the 2nd warmest on record. The average temperature for the month was 75.6 degrees.
August was also the 4th wettest on record. The total precipitation for the month was 8.12 inches.
September was tied for the 6th warmest on record with 1961. The average temperature for the month was 68.5 degrees.
November was tied for the 5th warmest on record with 2015. The average temperature for the month was 48.1 degrees.
2016 was tied with 1949 for the 4th warmest year ever in Erie with an average temperature of 52.6 degrees.
The yearly average temperature was 52.6 degrees. The normal average yearly temperature is 49.9 degrees.
The yearly total precipitation was 45.66 inches. The normal yearly precipitation is 42.21.
The yearly total snowfall was 90.4 inches.
The warmest temperature for the year was 92 on 6/20 and 6/26.
The coldest temperature for the year was 5 on 2/13.
The greatest daily snowfall was on 1/18. 8.5 inches of snow fell.
The wettest day was 8/9. 2.08 inches of rain fell.
|
Highs |
Lows |
|||
|
2/3 |
59 |
4/10 |
16 |
|
|
2/20 |
66 (Tie) |
|
|
|
|
3/9 |
71 |
|
|
|
|
11/1 |
79 |
|
|
|
|
11/2 |
78 |
|
|
|
|
11/18 |
75 |
|
|
|
|
12/26 |
65 |
|
|
|
March was the 6th warmest on record. The average temperature for the month was 44.8 degrees.
April was tied for the 8th snowiest on record with 1992. The total snowfall for the month was 4.2 inches.
July was the 10th warmest on record. The average temperature for the month was 75.0 degrees.
July was also the 9th driest on record. The total precipitation for the month was 1.75 inches.
August was the 2nd warmest on record. The average temperature for the month was 75.8 degrees.
September was tied for the 3rd warmest on record with 1978. The average temperature for the month was 68.5 degrees.
November was the 6th warmest on record. The average temperature for the month was 46.1 degrees.
2016 was the 5th warmest year ever in Mansfield with an average temperature of 52.5 degrees.
The yearly average temperature was 52.5 degrees. The normal average yearly temperature is 49.8 degrees.
The yearly total precipitation was 35.24 inches. The normal yearly precipitation is 44.17.
The yearly total snowfall was 38.6 inches.
The warmest temperature for the year was 92 on 6/11, 7/23, and 8/11.
The coldest temperature for the year was -6 on 2/14.
The greatest daily snowfall was on 12/9. 5.0 inches of snow fell.
The wettest day was 2/24. 1.50 inches of rain fell.
|
Highs |
Lows |
|||
|
2/3 |
55 |
None in 2016 |
|
|
|
2/28 |
65 |
|
|
|
|
3/9 |
68 |
|
|
|
|
11/18 |
73 |
|
|
|
March was the 7th wettest on record. The total precipitation for the month was 5.10 inches.
April was the 3rd snowiest on record. The total snowfall for the month was 8.7 inches.
August was the 8th warmest on record. The average temperature for the month was 75.1 degrees.
November was the 6th warmest on record. The average temperature for the month was 45.5 degrees.
2016 was tied with 1953 for the 9th warmest year ever in Toledo with an average temperature of 52.0 degrees.
The yearly average temperature was 52.0 degrees. The normal average yearly temperature is 50.0 degrees.
The yearly total precipitation was 34.33 inches. The normal yearly precipitation is 34.20.
The yearly total snowfall was 36.1 inches.
The warmest temperature for the year was 95 on 6/11.
The coldest temperature for the year was -6 on 12/19.
The greatest daily snowfall was on 12/11. 10.2 inches of snow fell.
The wettest day was 9/17. 1.32 inches of rain fell.
|
Highs |
Lows |
|||
|
2/3 |
62 |
4/10 |
15 |
|
|
2/20 |
65 (Tie) |
|
|
|
|
2/28 |
62 |
|
|
|
|
3/9 |
73 |
|
|
|
|
3/24 |
73 |
|
|
|
|
11/18 |
72 (Tie) |
|
|
|
|
12/26 |
64 (Tie) |
|
|
|
March was the 4th warmest on record. The average temperature for the month was 44.8 degrees.
April was the 7th snowiest on record. The total snowfall for the month was 8.8 inches.
May was tied for the 3rd snowiest on record with 1963. The total snowfall for the month was 0.2 inches.
August was the 6th warmest on record. The average temperature for the month was 74.0 degrees.
September was tied for the 9th warmest on record with 1933. The average temperature for the month was 67.3 degrees.
October was the 3rd wettest on record. The total precipitation for the month was 6.11 inches.
December was tied for the 4th snowiest on record with 2007. The total snowfall for the month was 23.3 inches.
2016 was tied with 1949 for the 9th warmest year ever in Youngstown with an average temperature of 51.7 degrees.
The yearly average temperature was 51.7 degrees. The normal average yearly temperature is 49.3 degrees.
The yearly total precipitation was 44.34 inches. The normal yearly precipitation is 38.86.
The yearly total snowfall was 71.4 inches.
The warmest temperature for the year was 92 on 7/23.
The coldest temperature for the year was -2 on 2/14.
The greatest daily snowfall was on 12/11. 7.5 inches of snow fell.
The wettest day was 10/20. 3.99 inches of rain fell.
A number of monthly temperature and precipitation records occurred across our climate sites this year.
All of these monthly statistics for our climate stations can be found year round by going to the following link and selecting your station. Data each month are updated within a week if data for the previous month made the "top ten."
NWS Cleveland Local Climate Information
Records that encompass yearly totals such as the wettest/driest/snowiest years on record are again located on our Local Climate Information page.
View our growing local weather events page highlighted below.
Local Weather Events & Local Interest Features Page
The publication, StormData, can be found with the National Centers for Environmental Information.
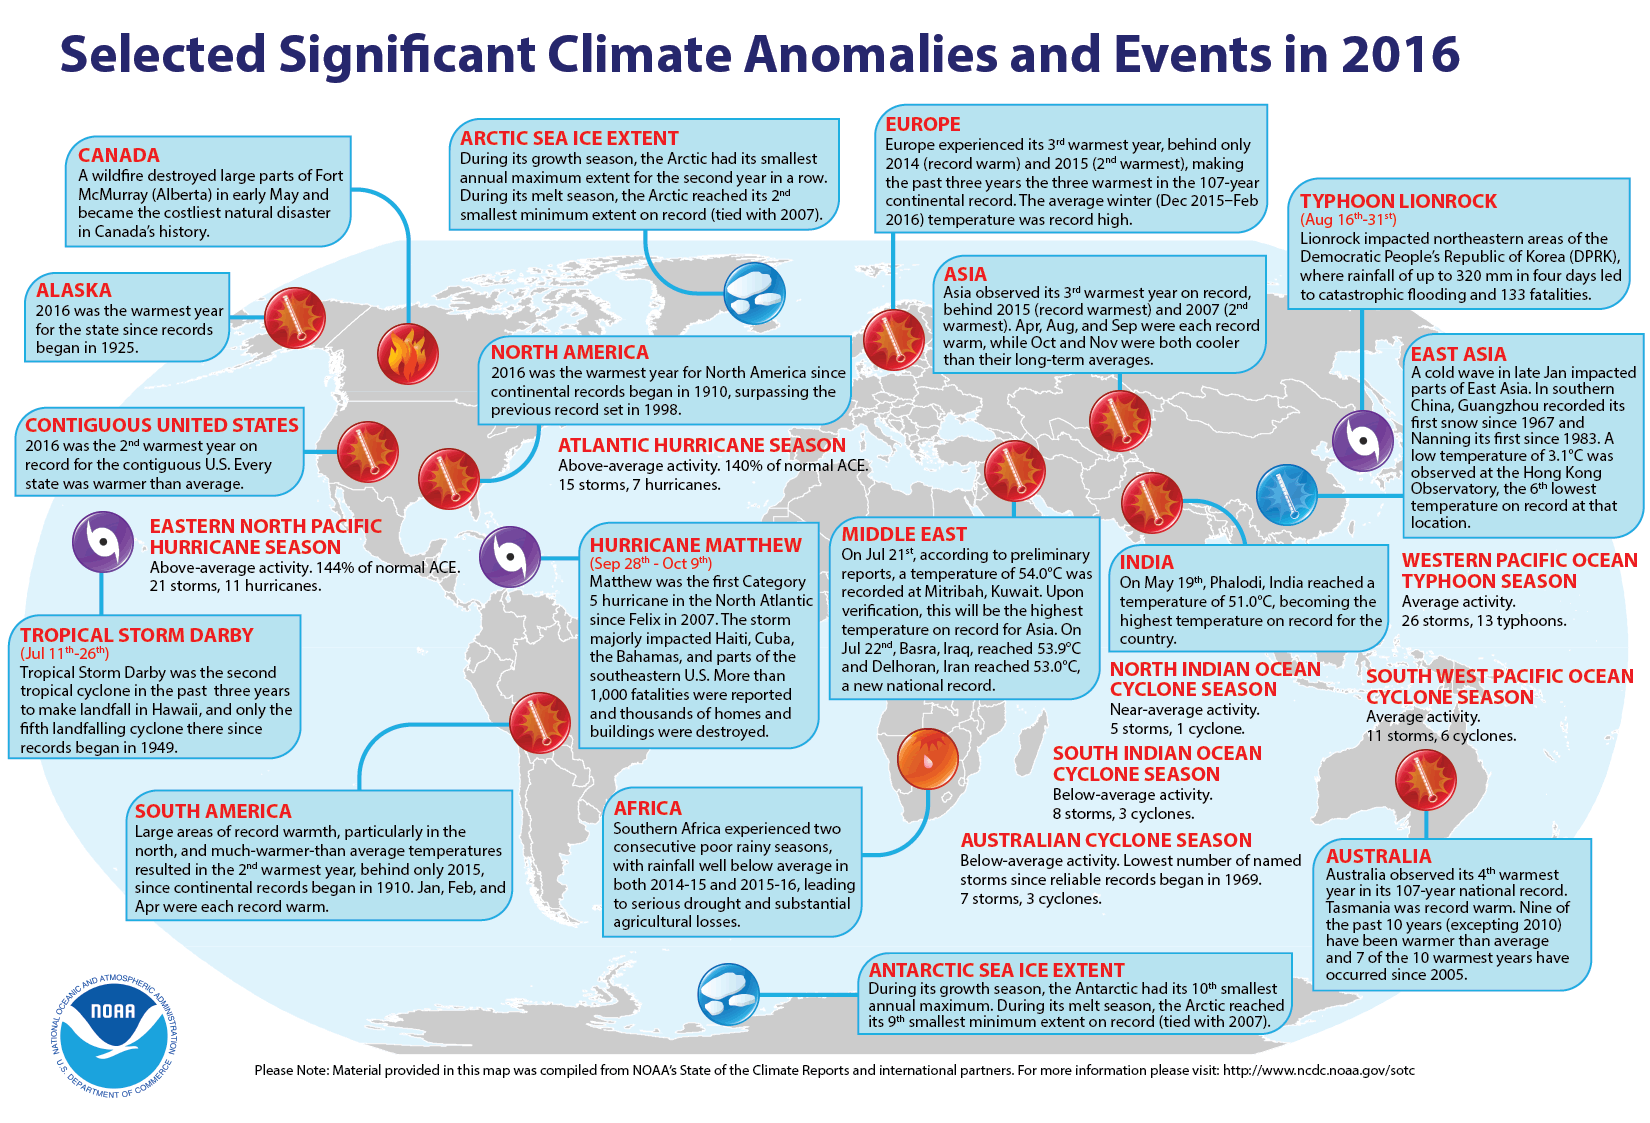
Significant Global Climate Extremes and Anomalies 2016
NCDC 2016 Preliminary Annual Global Climate Report
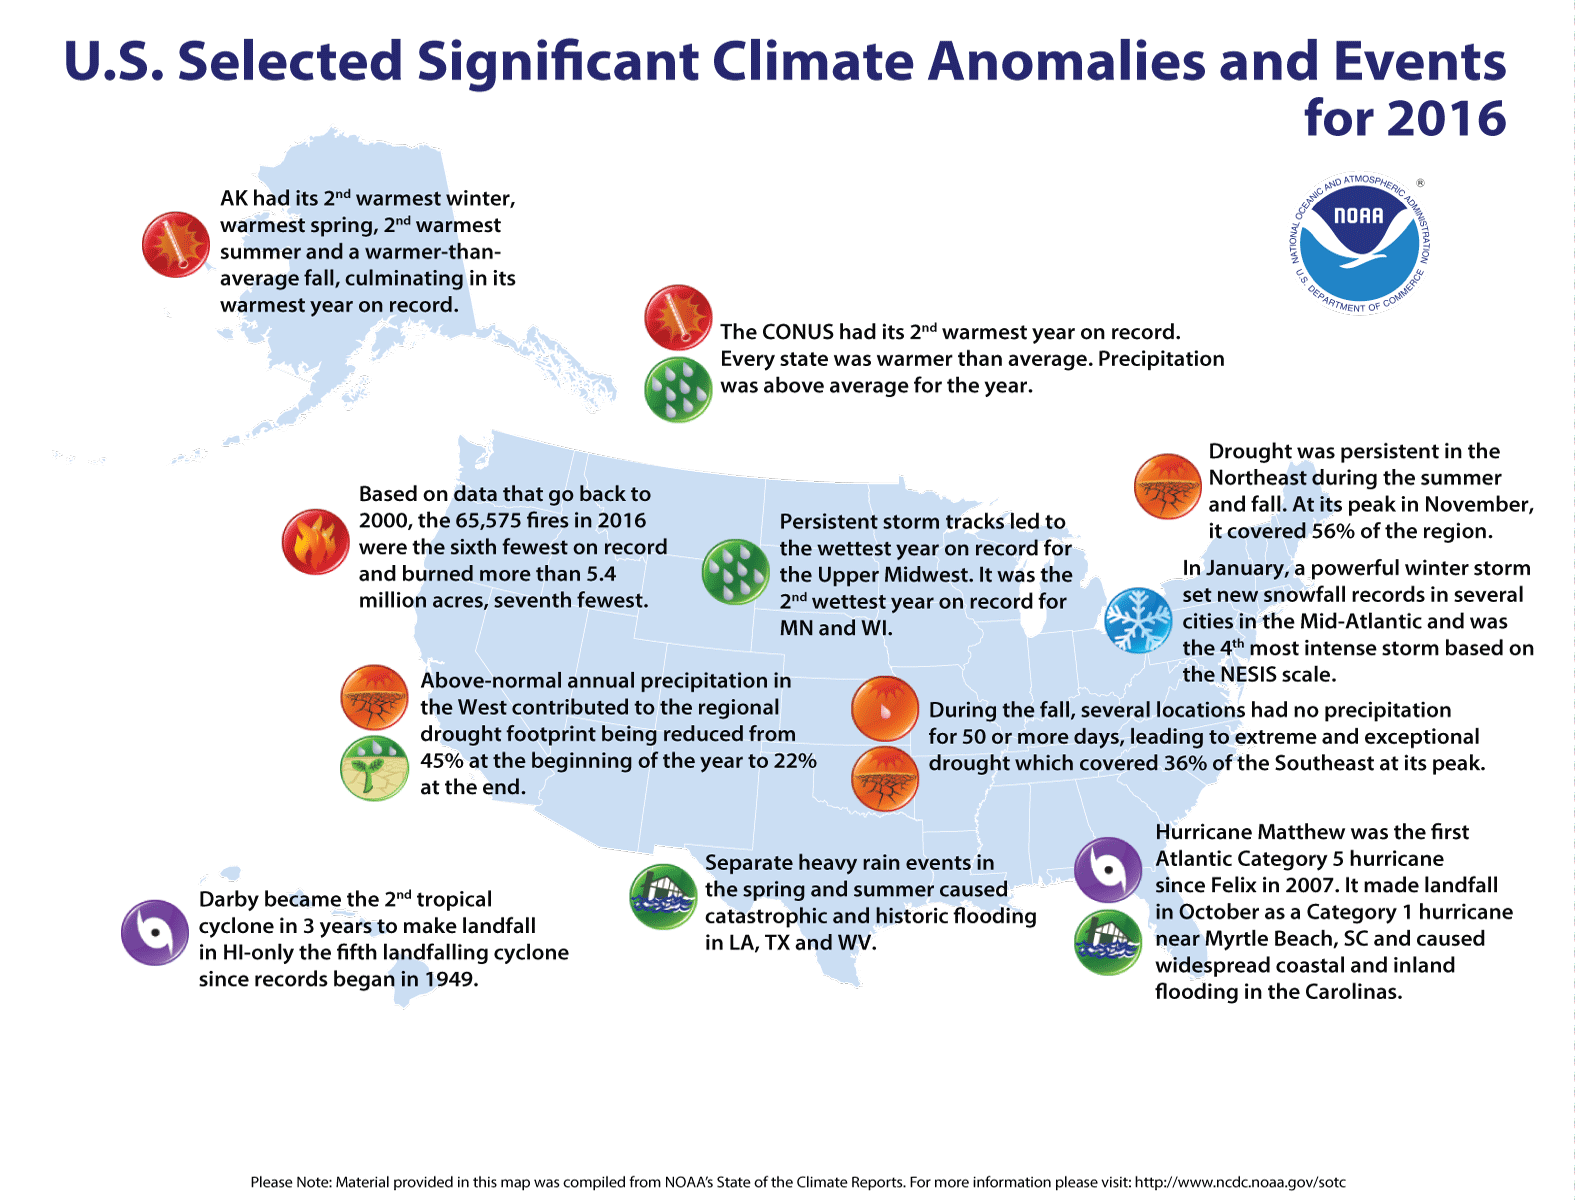
NCDC 2016 Preliminary United States Significant Weather and Climate Events
NCDC 2016 Preliminary State of the Climate - U.S. Summary
Preliminary data is updated in mid-January to reflect end of the year weather. The full analysis will be out in spring.
All data are considered preliminary. The National Centers for Environmental Information (formerly the National Climate Data Center) finalizes and stores the official record of all of our weather data.
Period of record are as follows:
Records data back to 1873 for Erie
1897 for Youngstown
1887 for Canton-Akron
1871 for Cleveland
1873 for Toledo
1916 for Mansfield

