Over the last two months, temperatures have been running well below freezing allowing ice on the local rivers to thicken. Lake Erie was also completely ice covered until recently when some areas along the shore from just east of the islands to near Cleveland, Ohio opened up from the recent warm spell.
A significant snow pack was also present within the watershed of Lake Erie. The snow pack held the equivalent of 2 inches or more of rain waiting to runoff into the rivers. A storm system tracked northeast and remained west of the lower Great Lakes. This storm system brought with it rainfall to the local area. Conditions were primed for the potential for major ice jams and significant river flooding to develop.
As the temperatures warmed well into the 50s over a large portion of northern Ohio and 40s elsewhere on February 21st, the snow began to melt in earnest causing runoff to occur. Rainfall amounts up to 1.75 inch occurred in northwest Ohio and between 0.25 and 0.50 inch fell elsewhere. The significant snow pack in northwest Ohio could have absorbed much of the heavy rain since the snow was so dry preventing a major widespread ice jam flooding situation.
Further east, rivers did respond to the snow melt and rainfall that occurred. As rainfall and snow melt run off into the rivers, the water level begins to rise lifting the ice that is in the river. Large chunks of ice then begin to float downstream and eventually become lodged against bridges, bends in the river, dams, and against Lake Erie ice at the mouth of the river.
As the ice builds up, an ice dam is formed causing the river to rise rapidly and results in flooding up stream from the ice dam. Some times, the pressure of the water behind the ice dam becomes so great that the ice breaks loose with explosive power and can send a wall of water downstream. This flash flood can cause flooding downstream as the water is released. The ice can clog up the river and cause another dam to form at the next obstruction starting the process all over again.
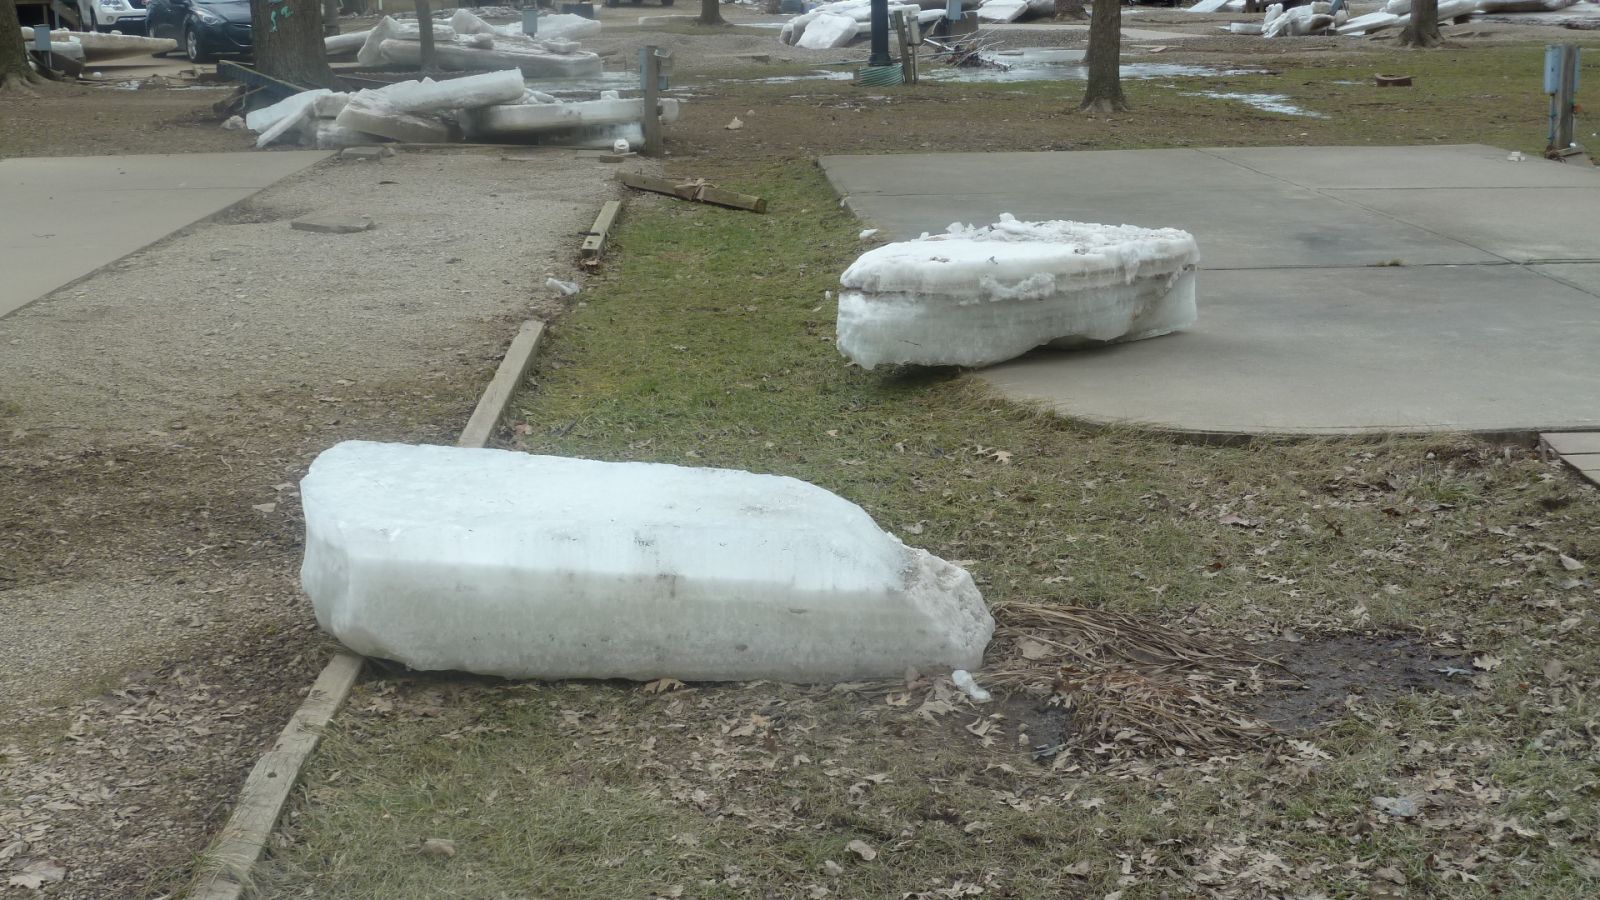
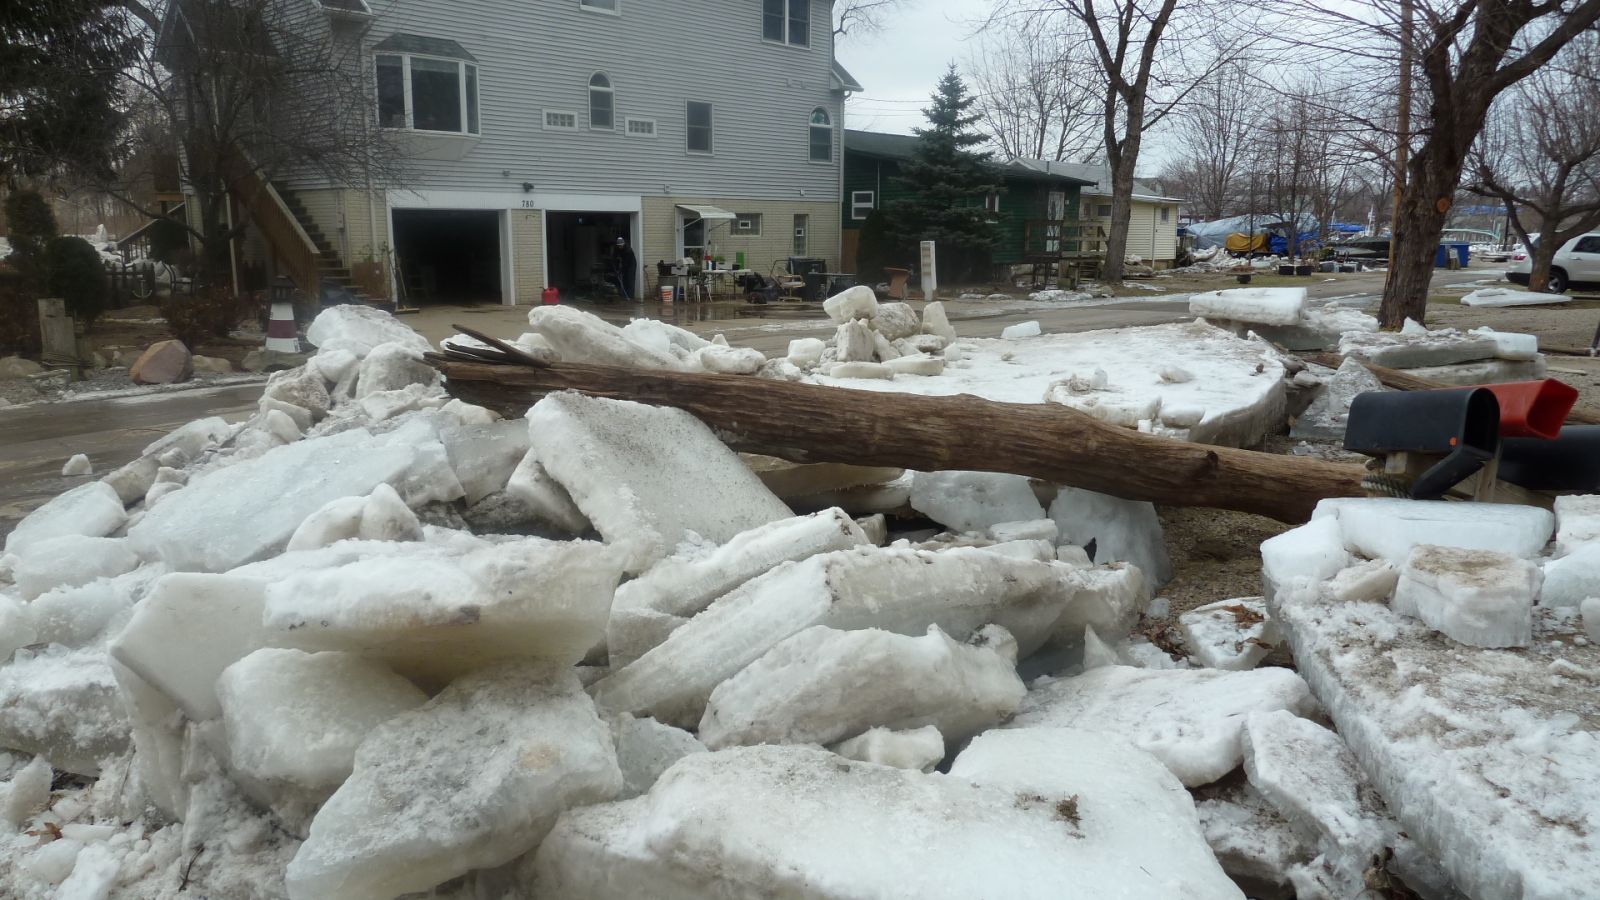
River gages respond by showing rapid increases of water level as the dam forms and a rapid decrease in water as the ice dam bursts. Large chunks of ice can be driven inland from the mainstem river as flooding occurs causing significant damage or total destruction to any thing in it's path.
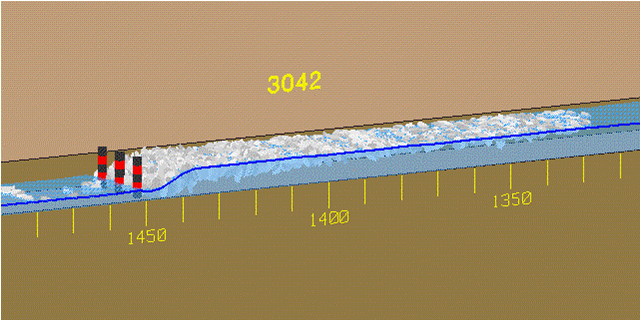
The ice jam model below developed by the Army Corp of Engineers shows a structure blocking the flow of ice. An ice jam forms and then backs up in the river. Notice the rising water level behind the ice jam. This is termed backwater flooding. Ice 6 inches thick can destroy large trees and knock houses off their foundations.
Ice Jam Model
 |
|---|
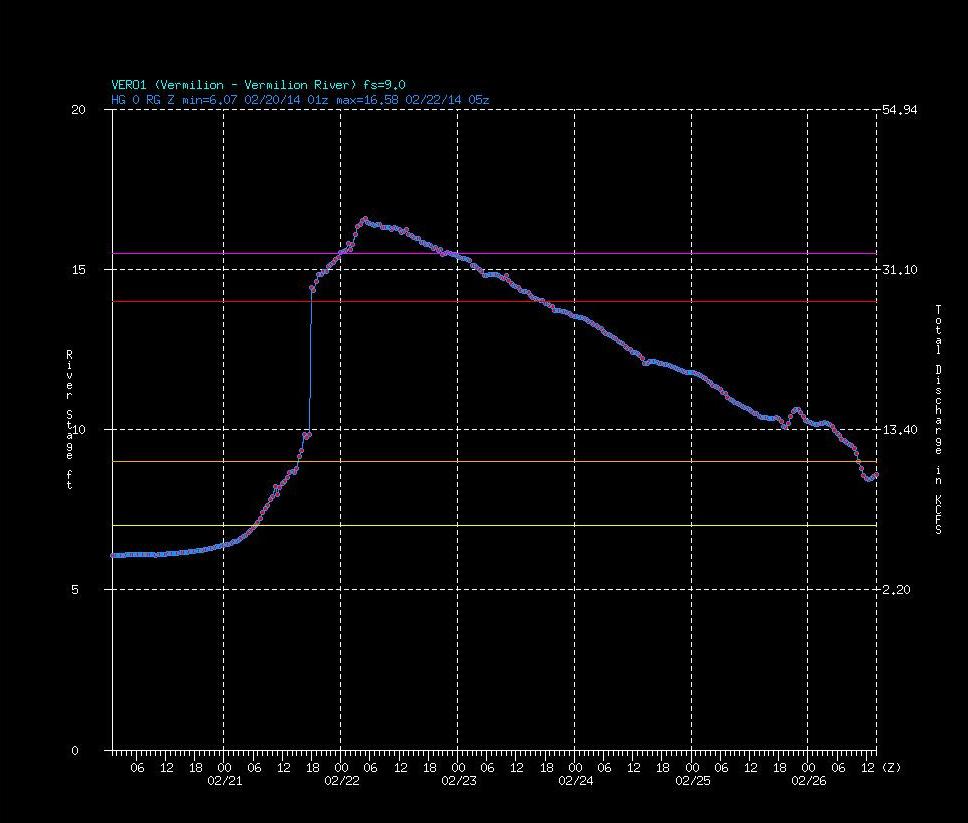
Vermilion River Hydrograph During Ice Jam
(Notice the nearly vertical rise in the river level as the ice jam developed.)
 |
|---|
 |
 |
|---|---|
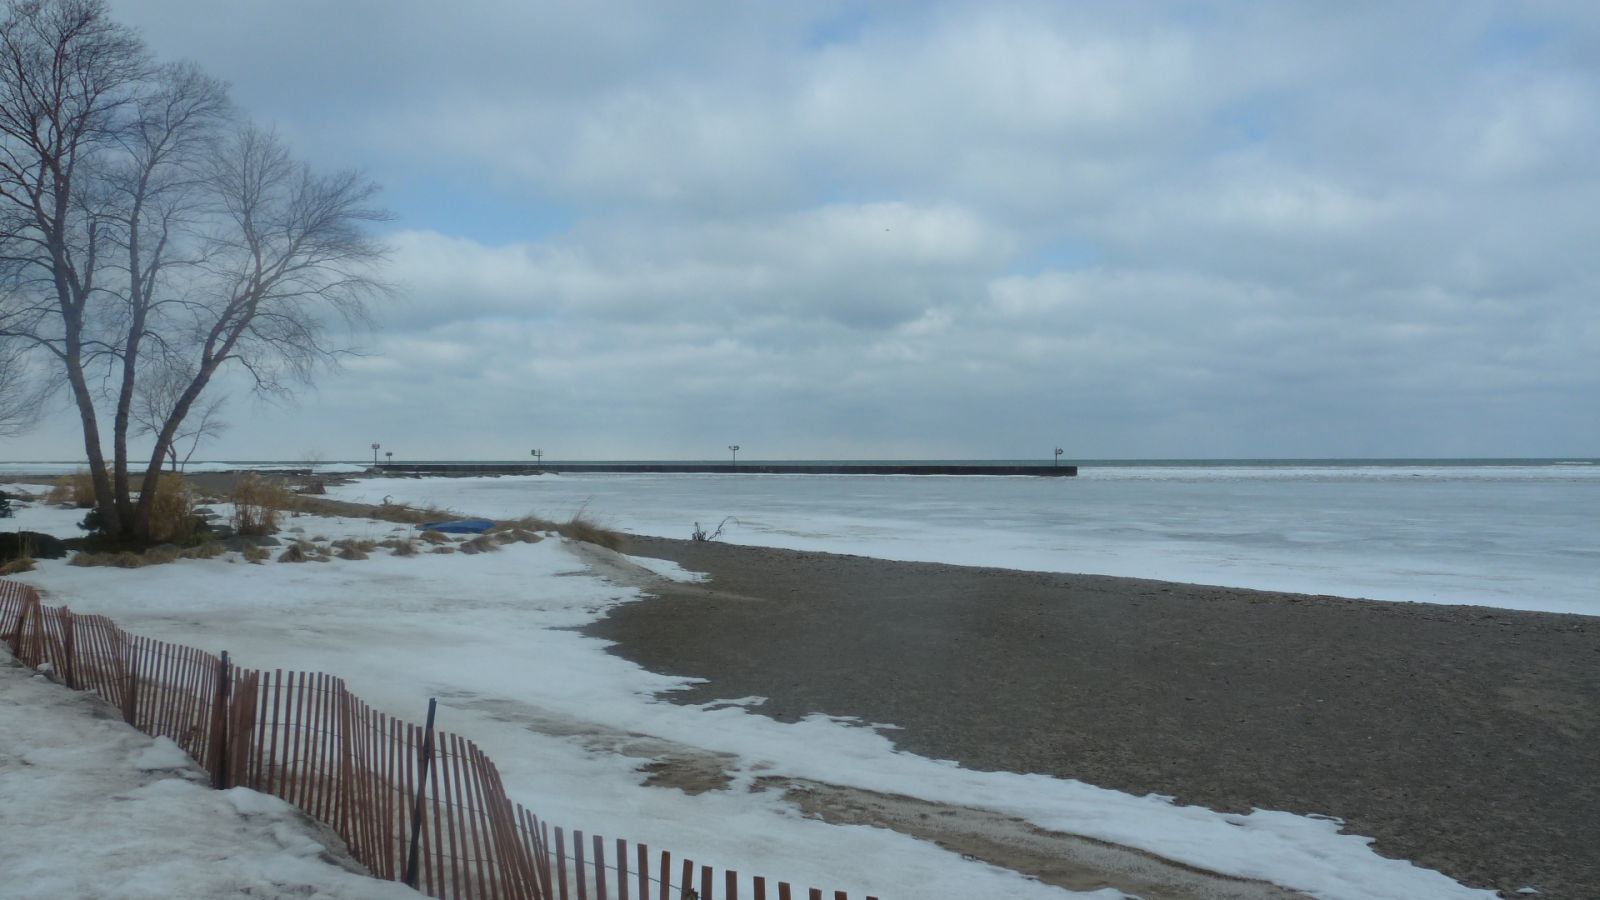 |
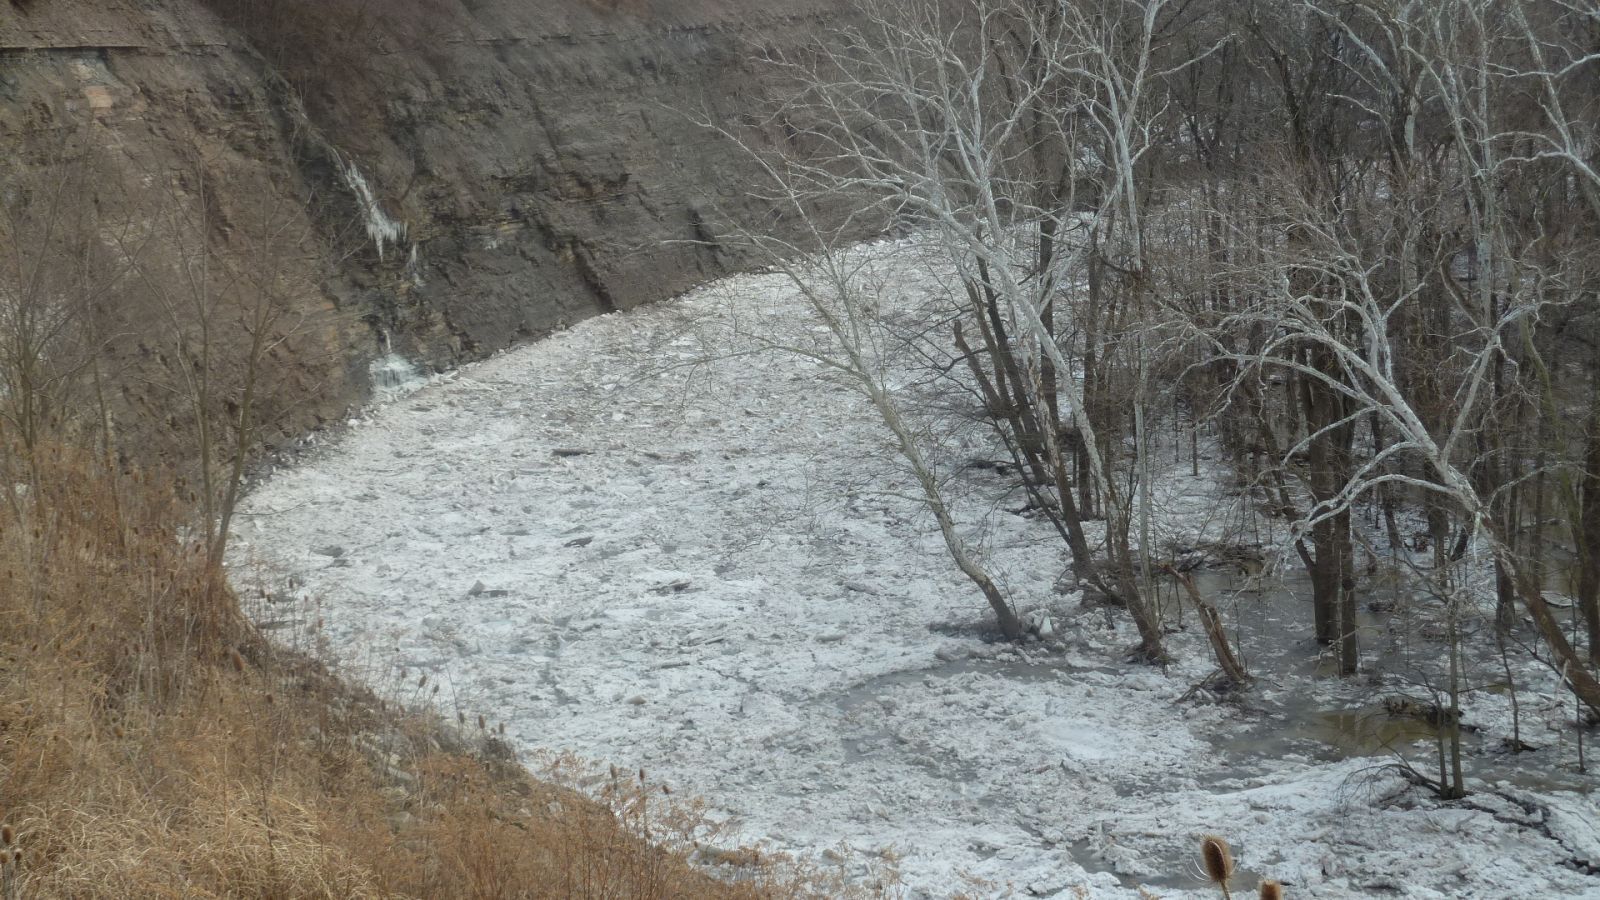
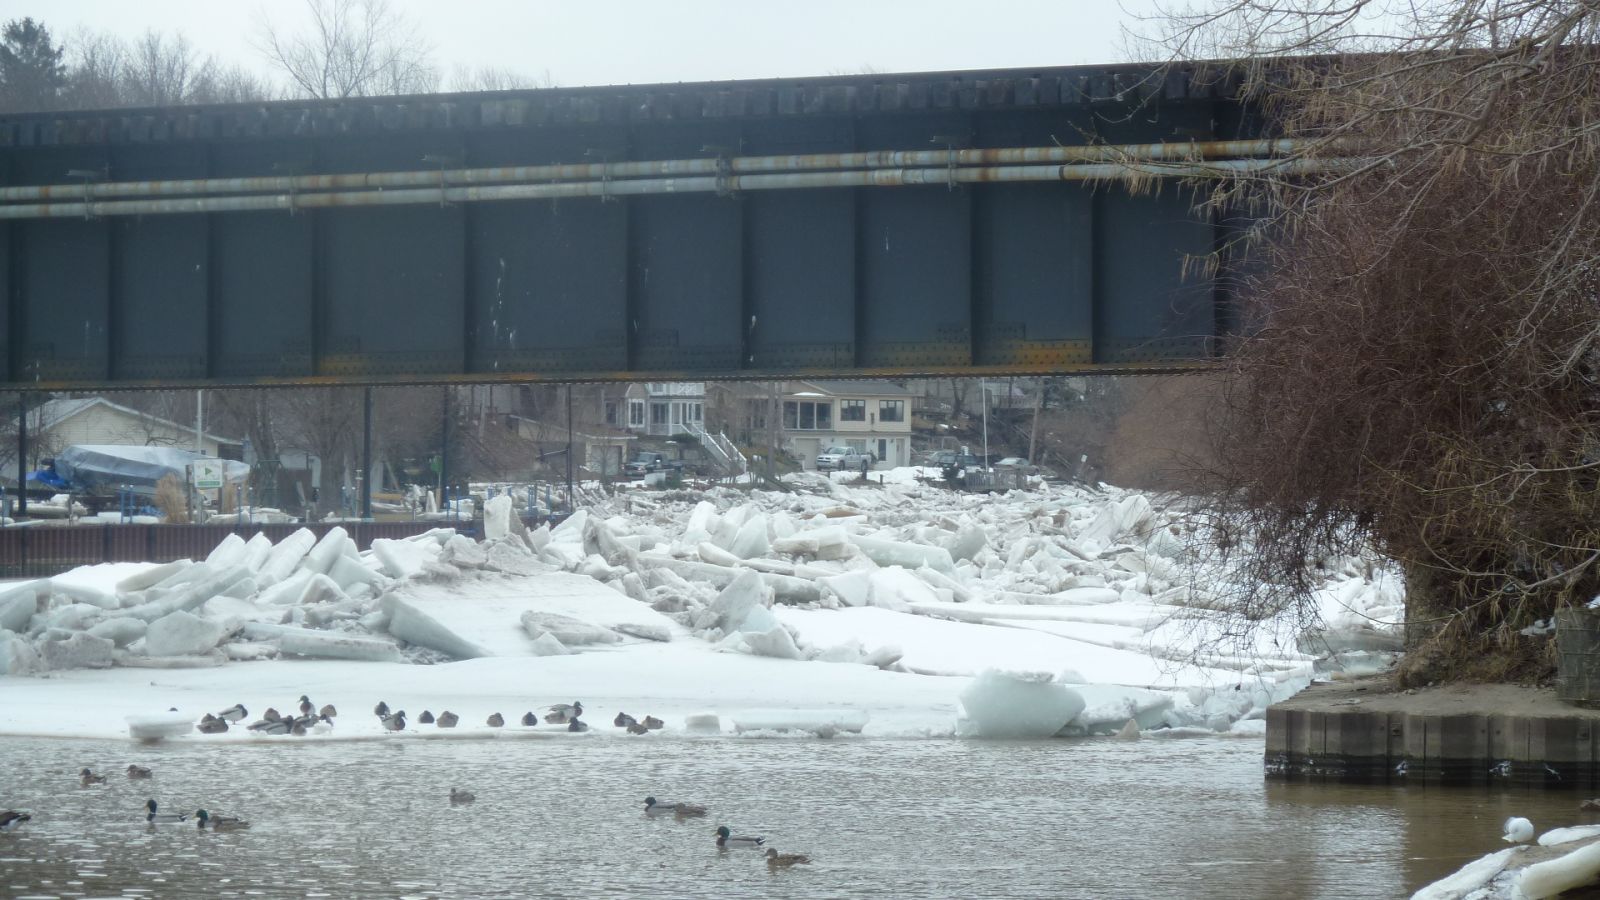
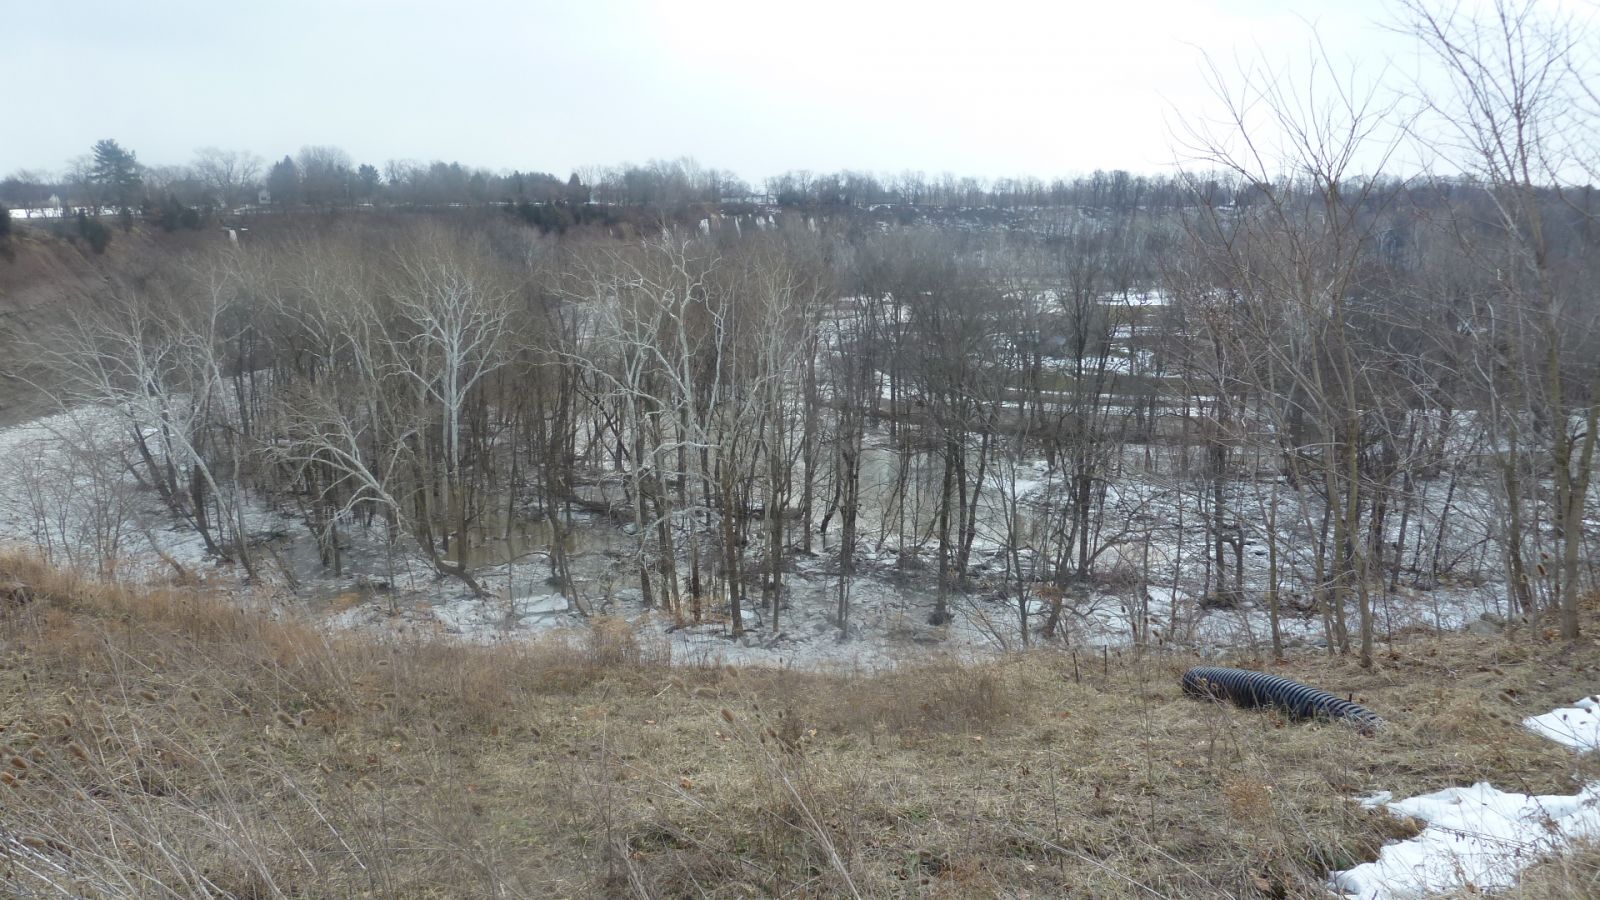
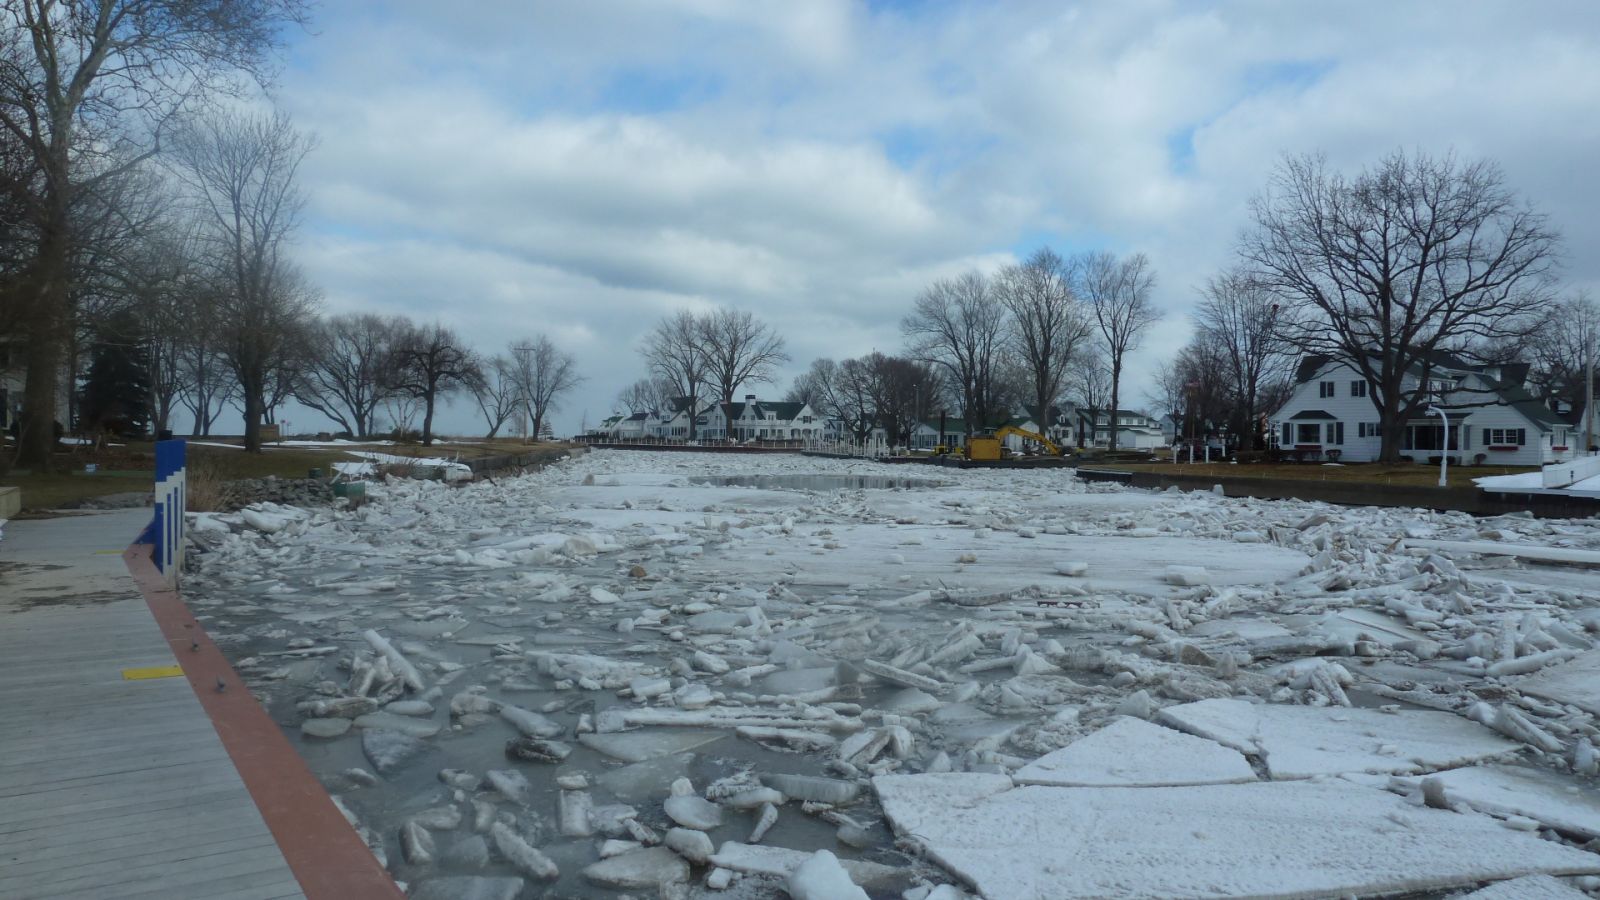
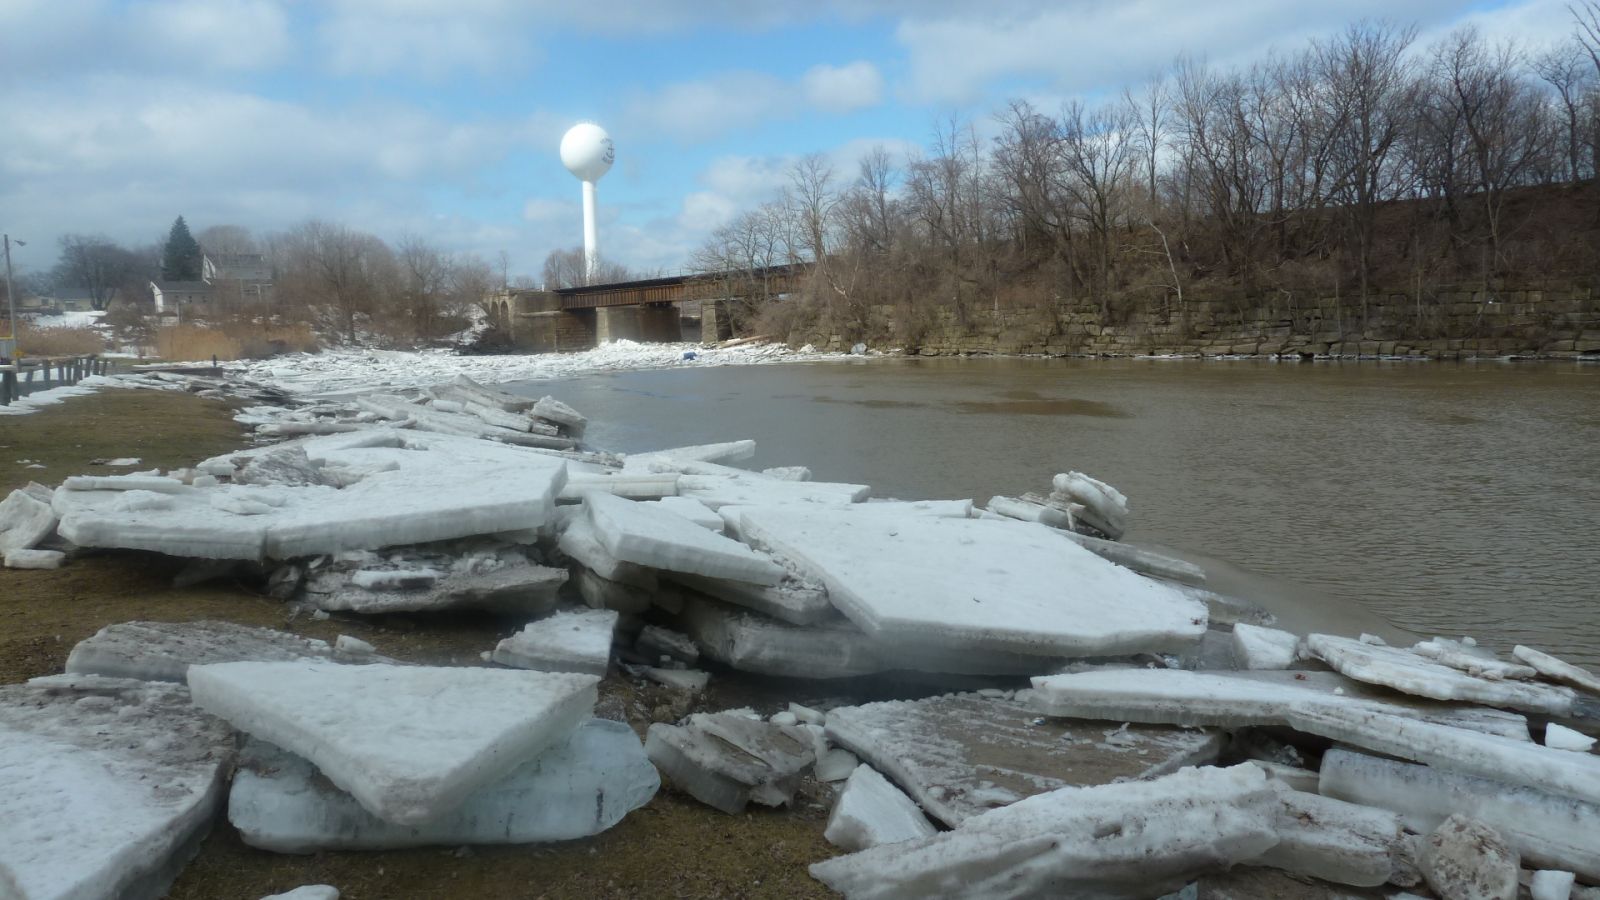
1. Upper left image shows ice collecting on the bend of the river and backing up. 2. Upper right image shows a bridge where the channel narrows causing ice to back up. 3. Lower left image is the mouth of the Vermilion River clogged by ice on Lake Erie. The lake ice prevents rivers from flushing out.
Photos Courtesy of National Weather Service Cleveland staff. |
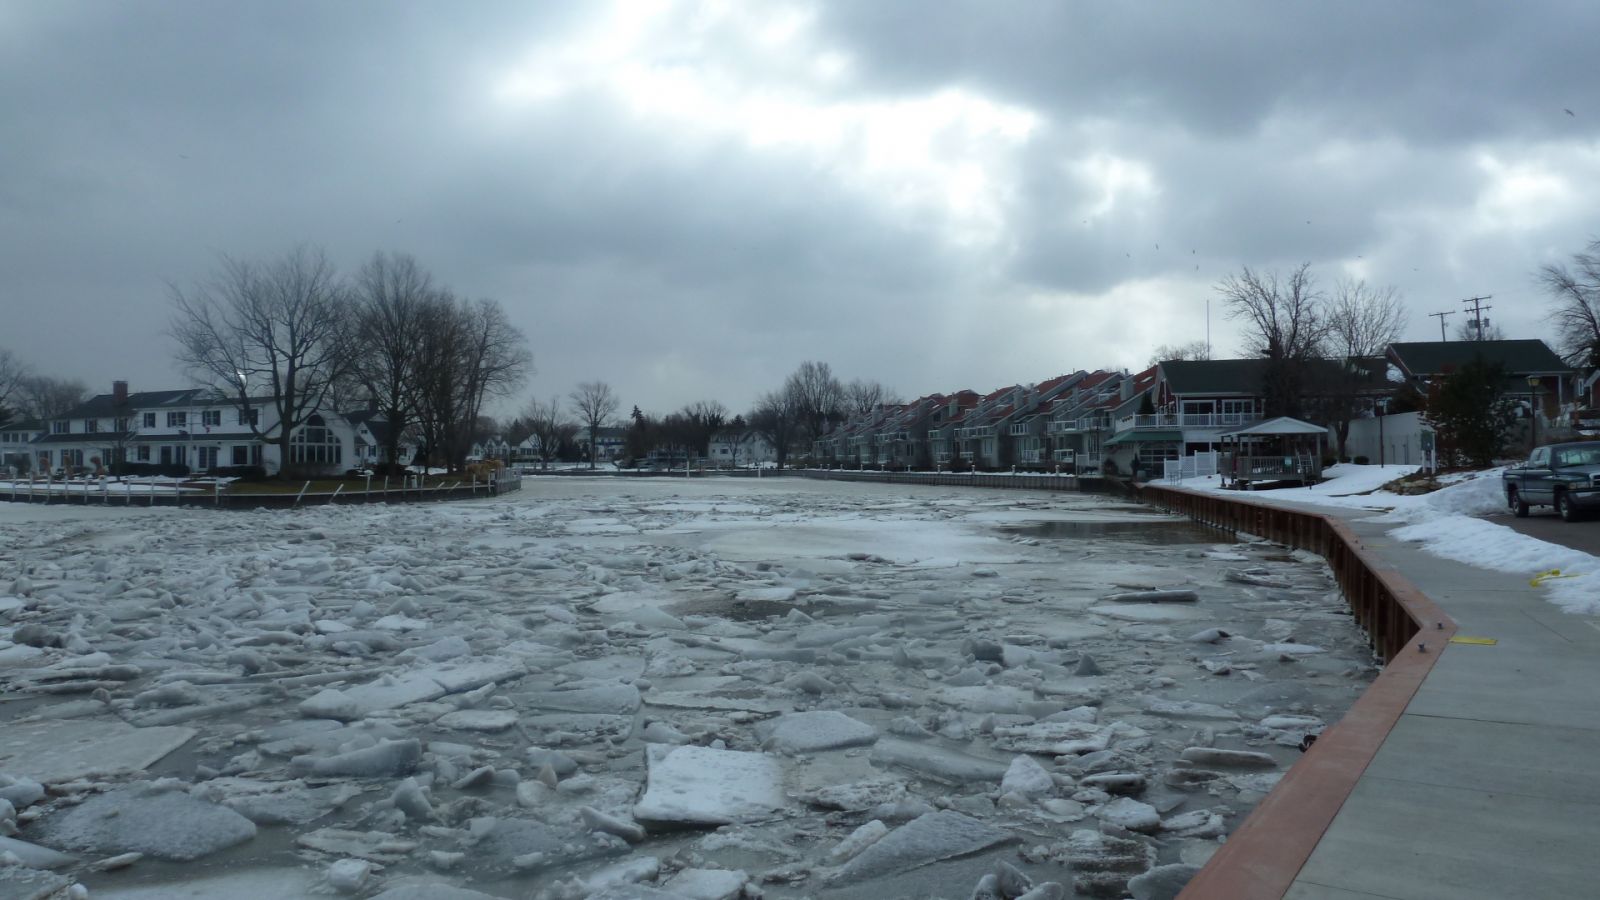
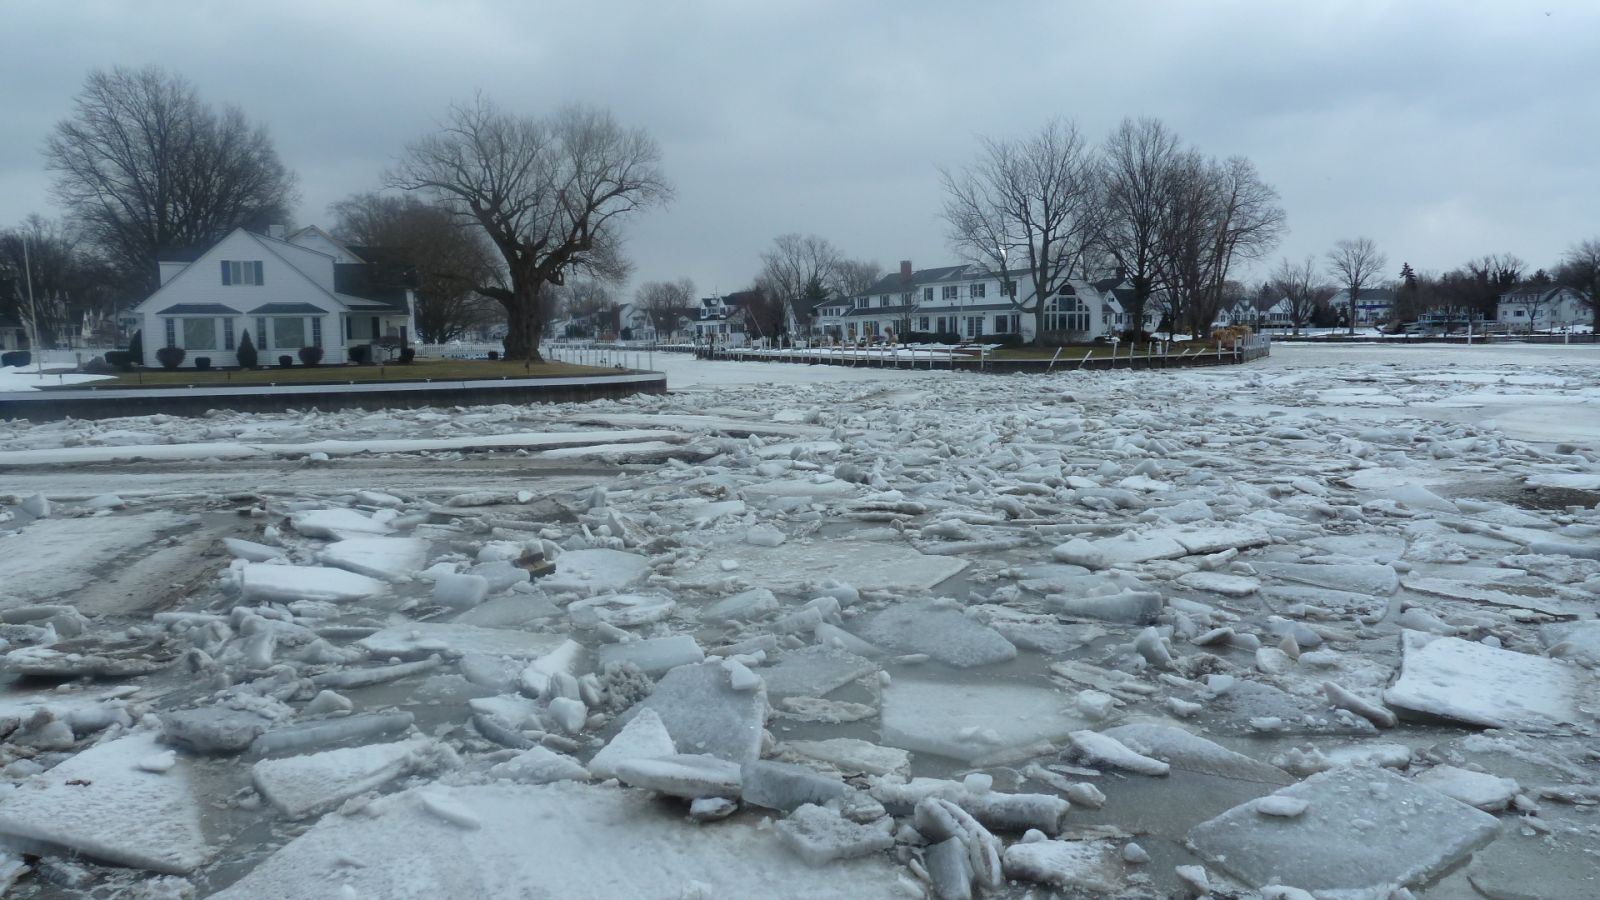
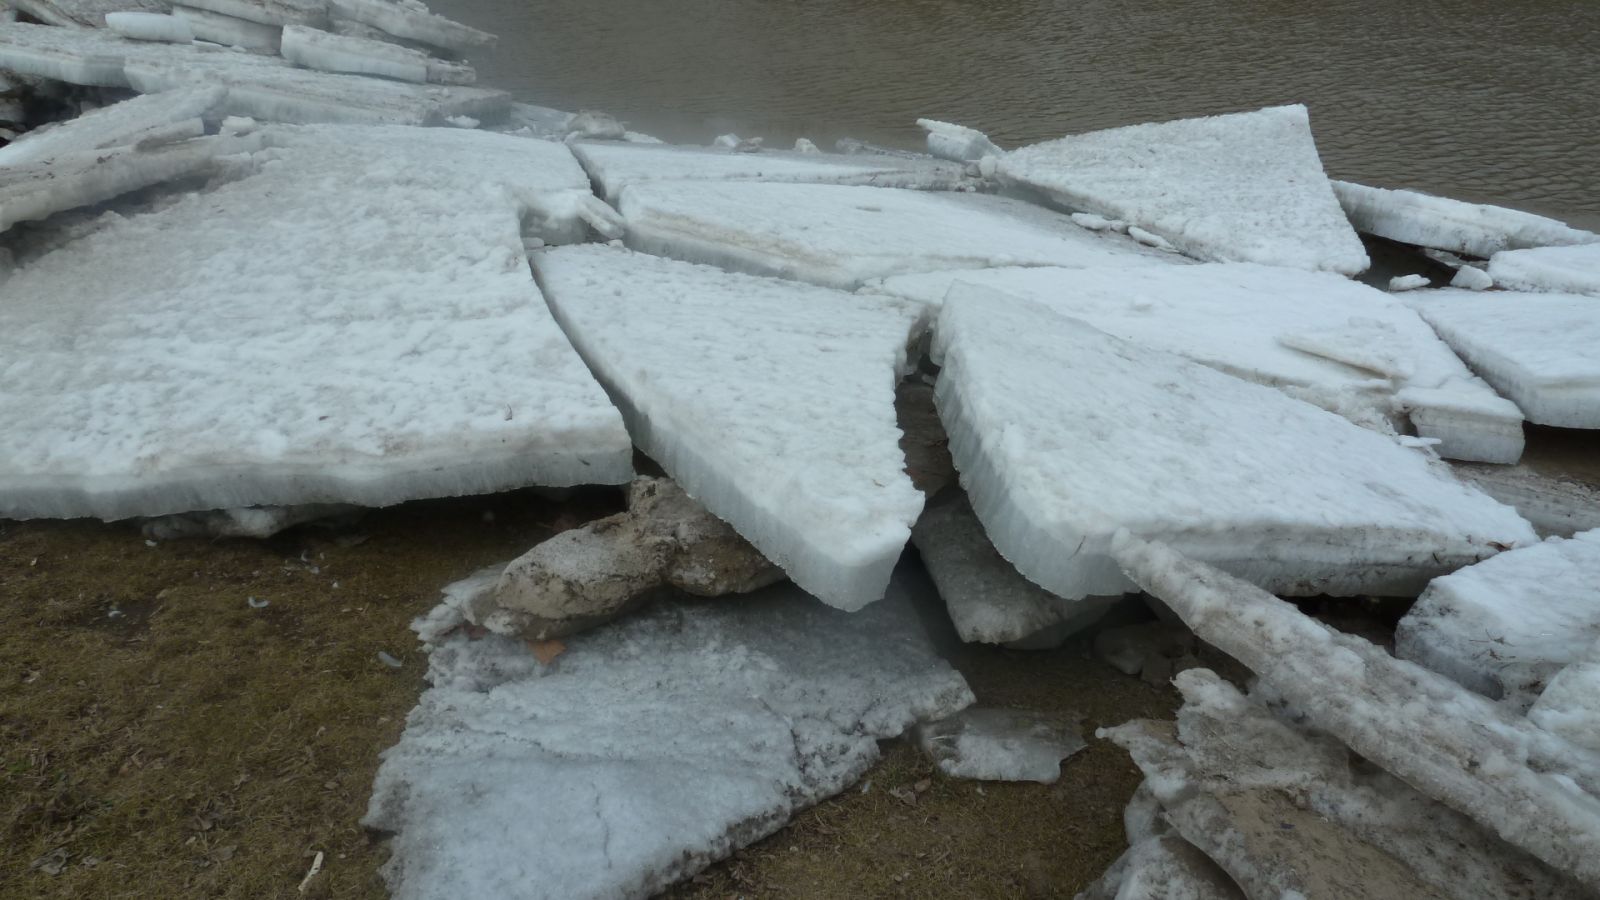
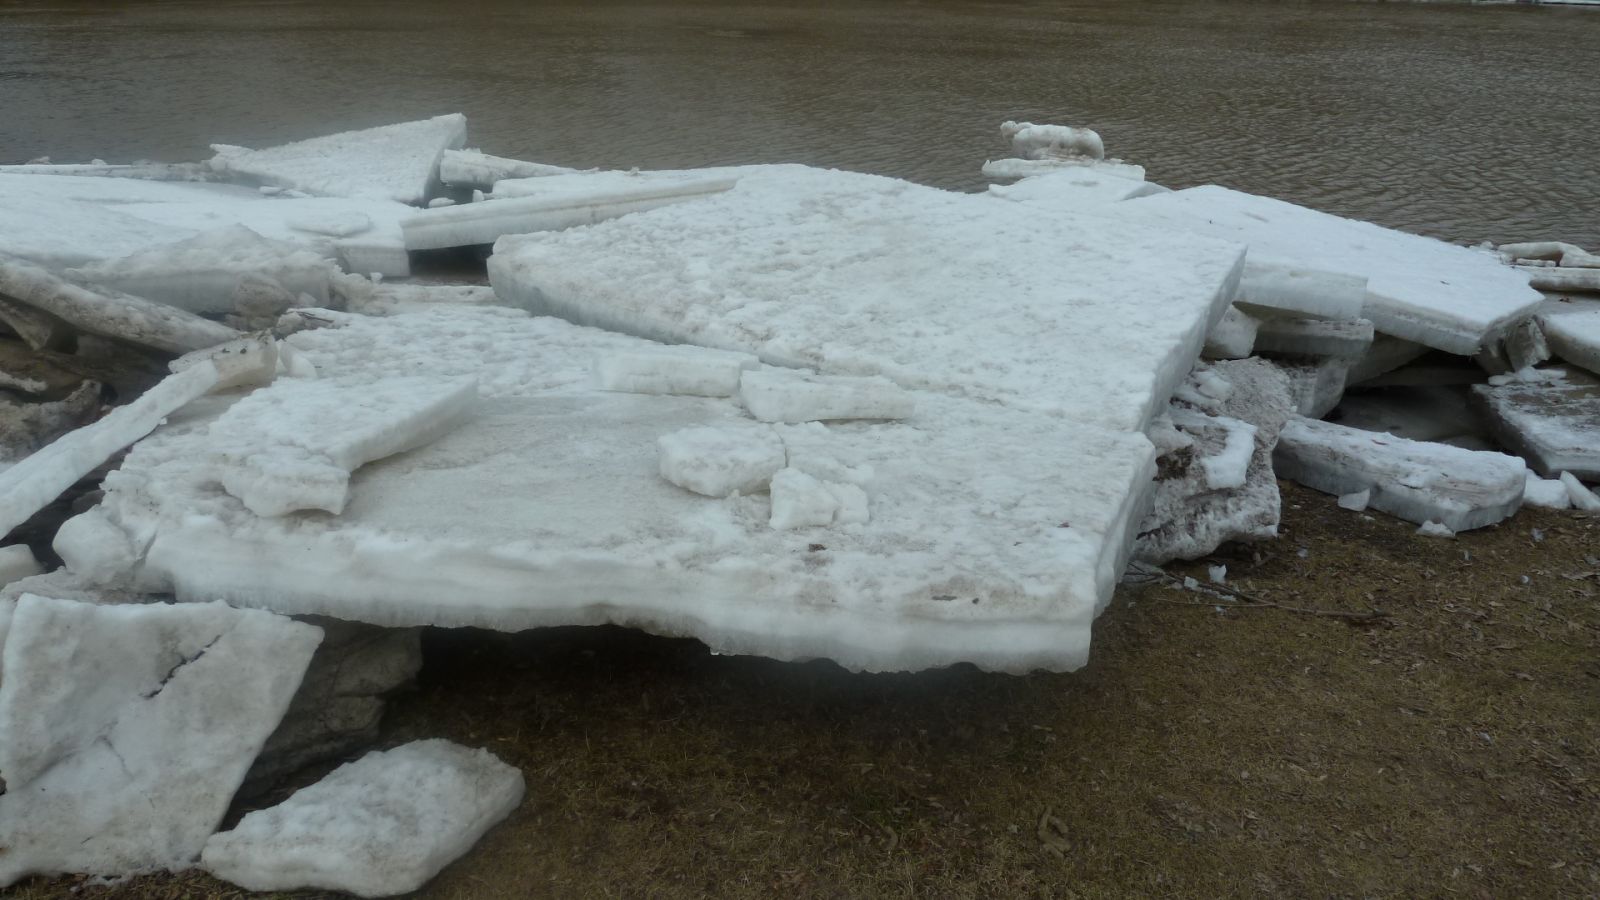
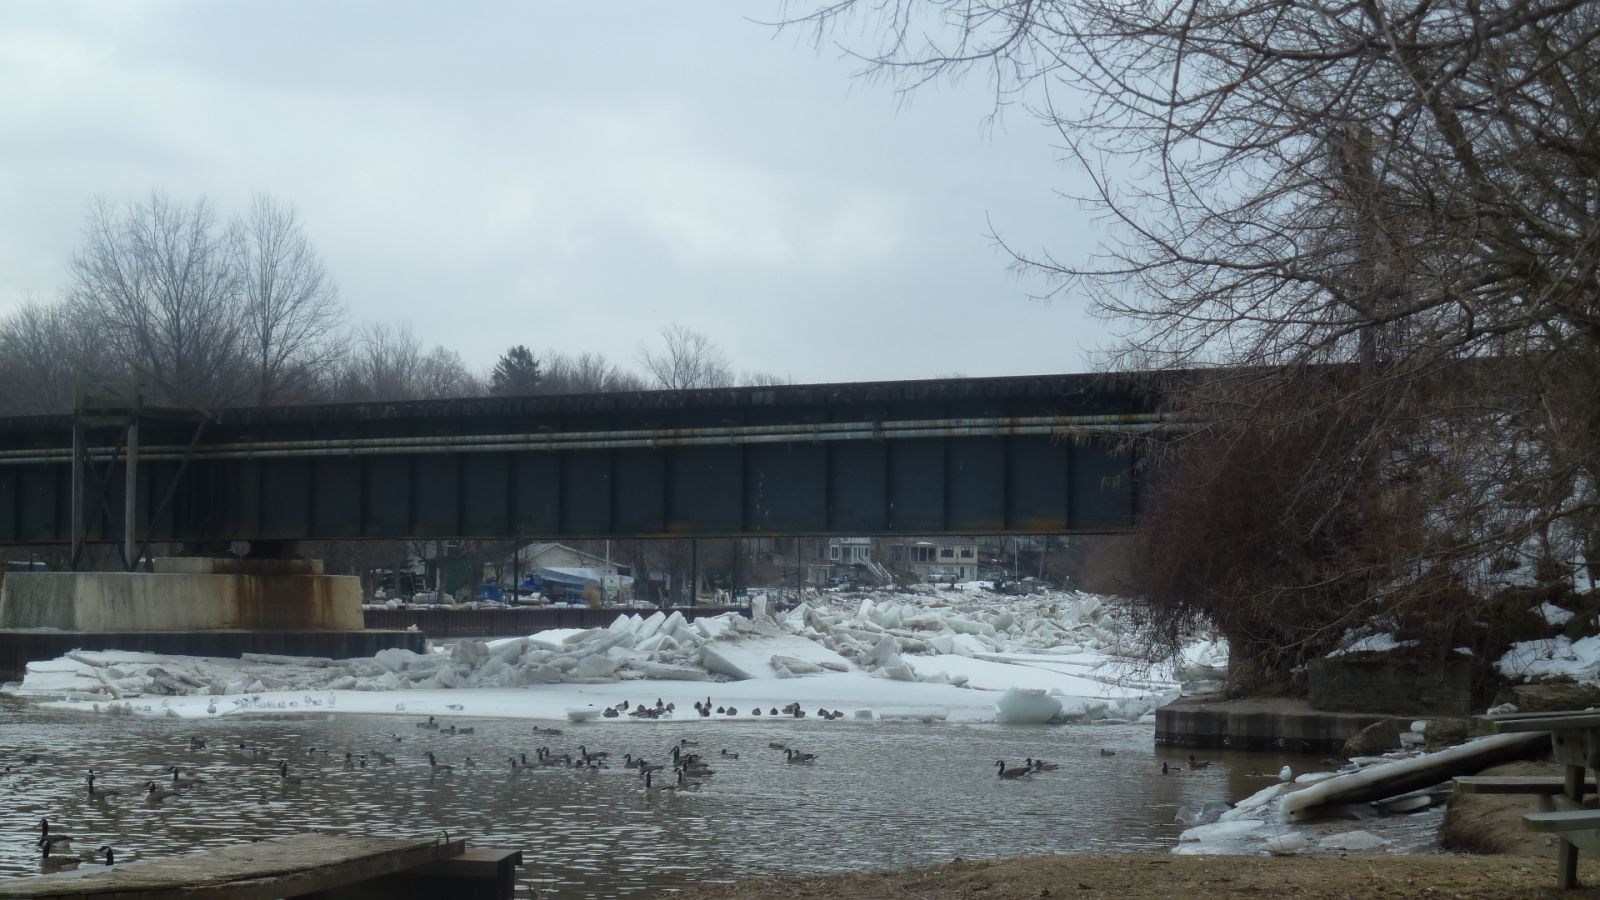
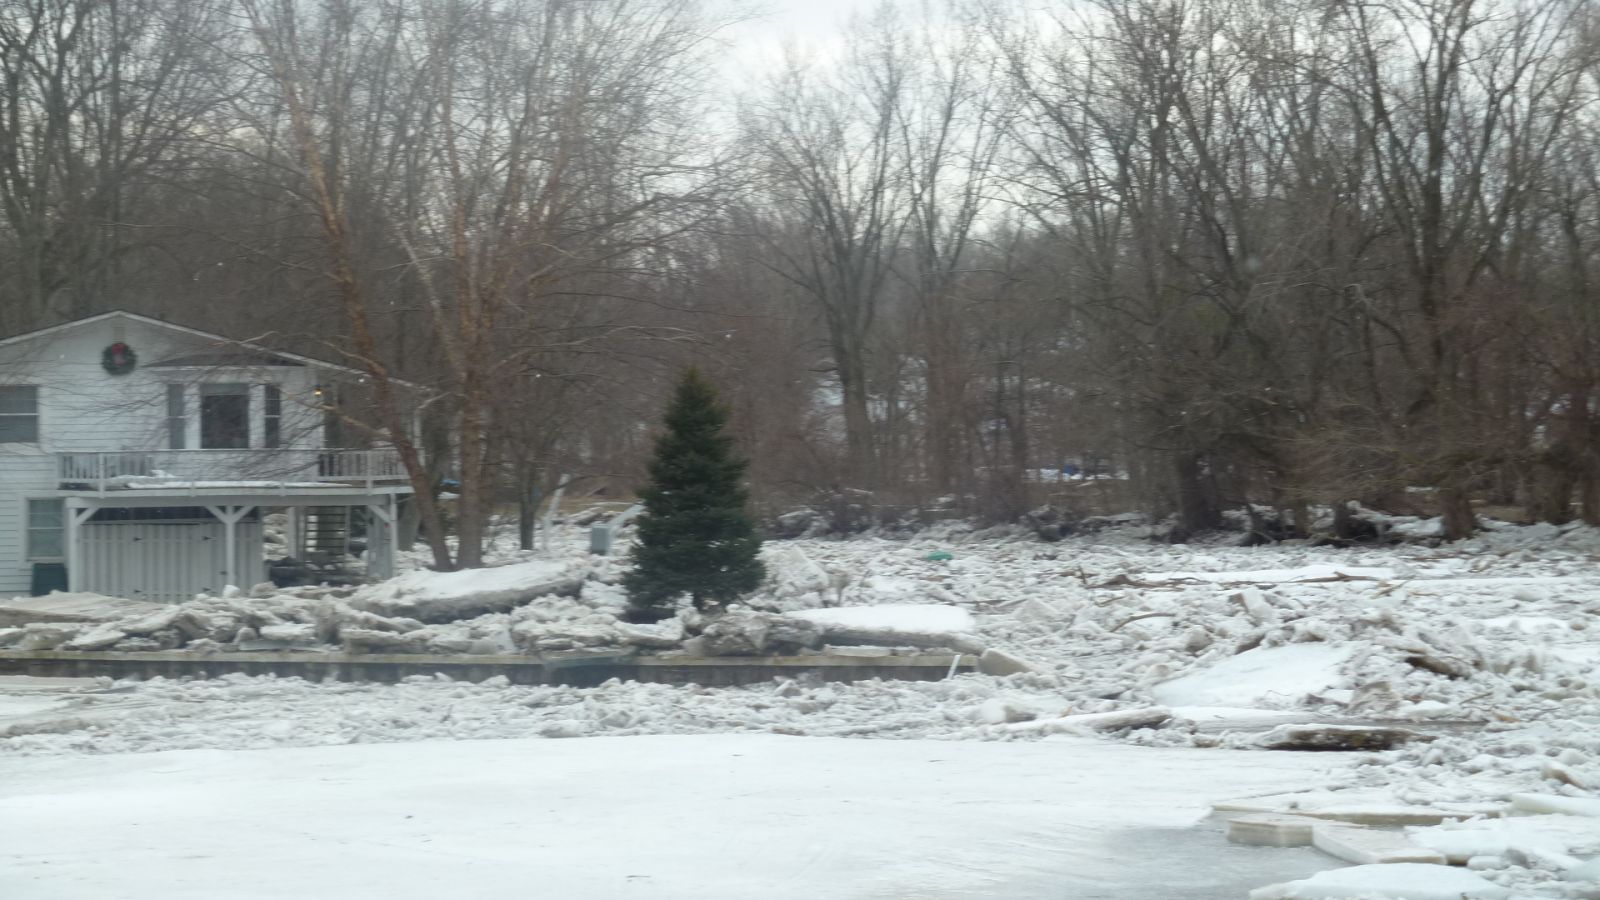
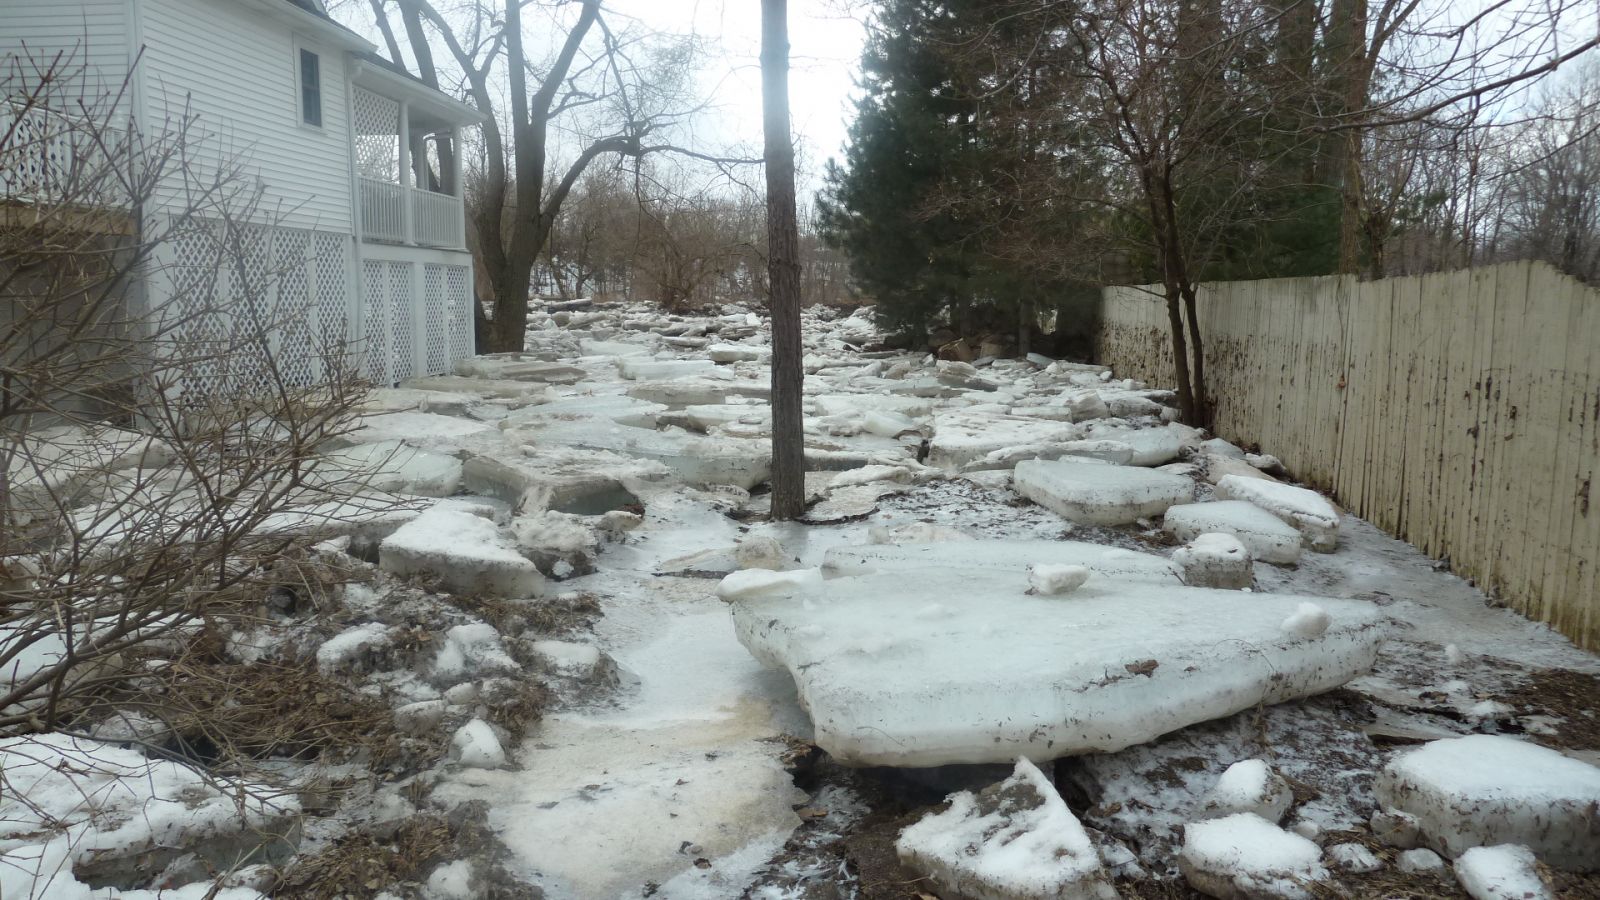
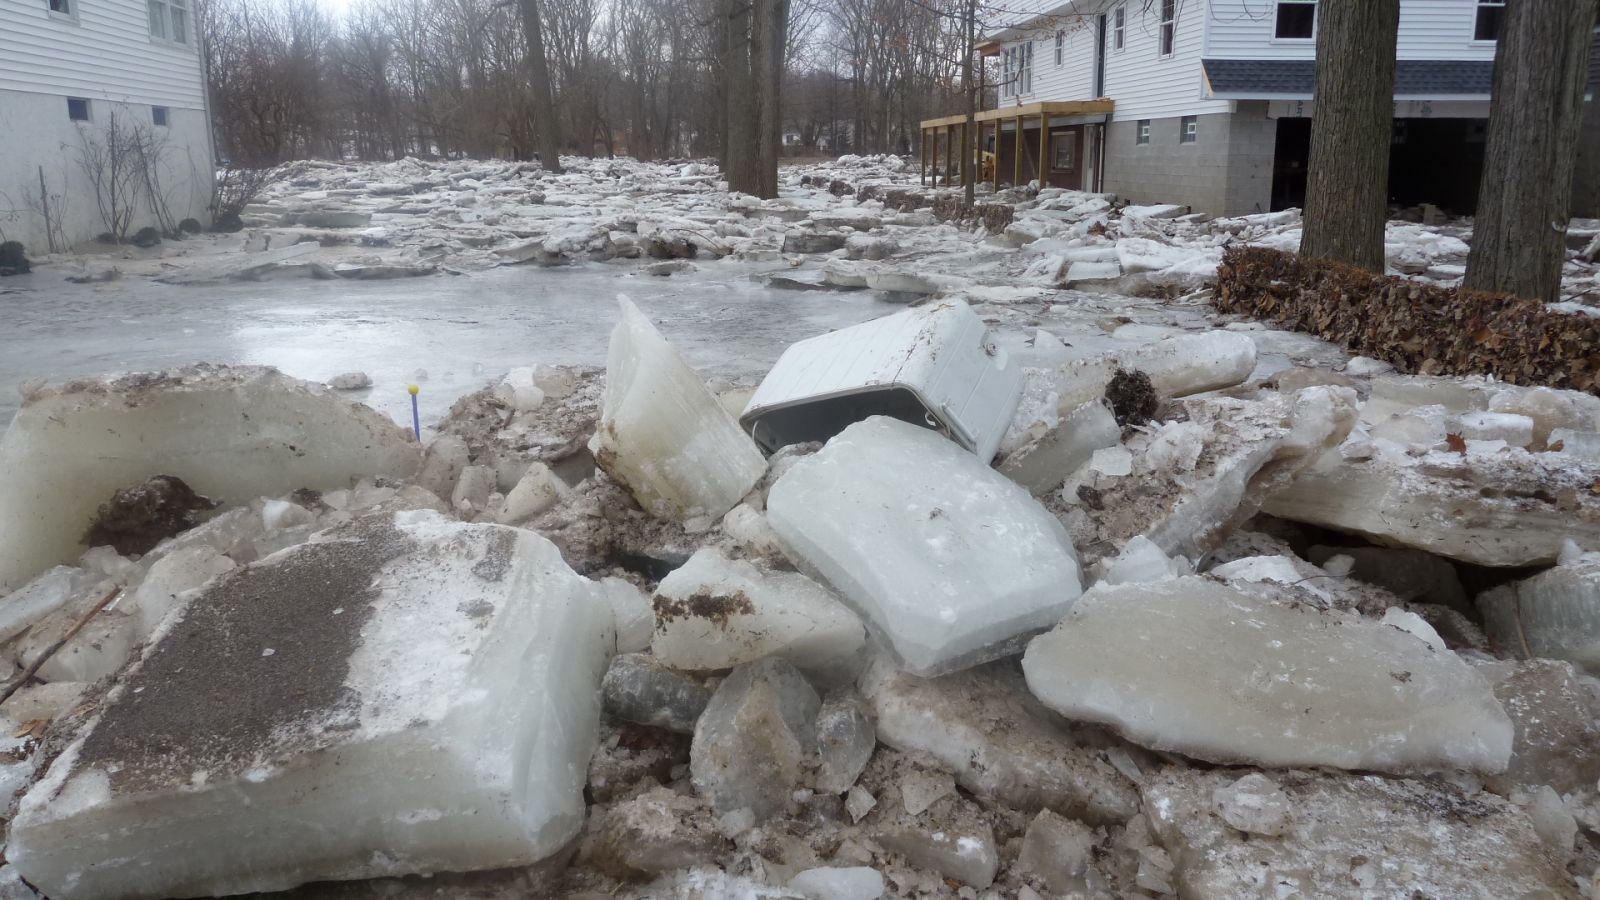
Below are some pictures from an ice survey of the Vermilion River on the Erie and Lorain County line. Notice the large thick pans of ice that get tumbled and eventually become interlocked within one another to form an ice jam. The thickness of the ice also contributes to the strength of the ice jams when they develop.
 |
 |
 |
 |
 |
 |
 |
 |
 |
 |
|
|
 |
 |
 |
 |
 |
 |
 |

