Notable Weather Events of 2011Annual Rainfall Total Exceed Records...
Annual precipitation records were broken at Cleveland, Toledo, and Youngstown. Mansfield, Akron-Canton, and Erie made it to their second wettest year on record. The above image depicts the departure from normal precipitation across the region. Most places came in 12 inches or more above normal. The National Weather Service has a volunteer Cooperative Weather Observer network. A number of our sites broke annual precipitation records as well. The tables below show the records for the official climate stations and a select number of COOP stations.
A Cold Start to the Year... February Snowpack Sets the Stage... A second powerful storm affected the area on February 20th and 21st. Freezing rain fell from Cleveland eastward and resulted in over 80,000 people losing power. A swath of heavy snow affected U.S. Highway 30 and Interstate 76 corridors during the afternoon of the 21st. Up to 8 inches of snow fell in less than 6 hours resulting in many accidents. Conditions were so bad that Interstate 76 in Summit County had to be closed for several hours. On February 25th, 5-10 inches of heavy wet snow blanketed the area. Around an inch of liquid water was held in the snow pack, with locally up to two inches of water equivalent. During the early morning hours on February 28th, most of the snow had melted as temperatures soared into the 50s. Heavy rain and thunderstorms accompanied the warm-up. Rainfall averaged one and a half to two and a half inches in about 6 hours. The combination of saturated soil, rapid snow melt, and heavy rain swelled streams and creeks, and for some, to near record levels in just a few hours. This turned out to be our worst flooding of the year in terms of area covered and severity. Over $50 million in flood related loses were reported in northern Ohio alone.
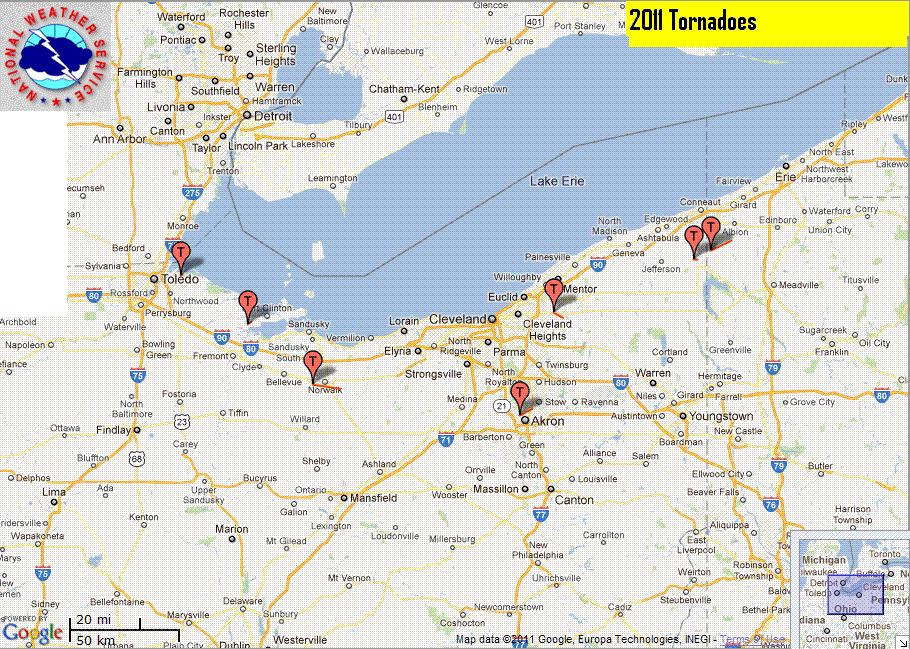
Wet conditions continued for the rest of the spring months of March, April, and May. Cleveland, Mansfield, Youngstown, and Erie, PA all broke their previous seasonal records for the wettest spring. By the end of May, much of the region was 6 to 11 inches above normal for precipitation. Severe Storms Brought Winds, Hail, and Tornadoes... May was the busiest month of the year for severe weather. A total of 147 severe thunderstorms and four tornadoes occurred on just seven days of the month. May 25th was the busiest day of the year with at least 69 severe thunderstorms and two tornadoes confirmed. Large hail caused damage throughout northern Ohio on the 25th. Hail the size of baseballs was reported in both Hancock and Sandusky counties. An EF1 tornado touched down southwest of Monroeville in Huron county. This tornado remained on the ground for nearly eight miles and damaged a dozen homes. The second tornado of the day was an EF0 that caused a four mile long intermittent damage path near Farilawn in Summit county. Two more tornadoes were reported on May 26th, including the only of the year in northwestern Pennsylvania. An EF1 tornado touched down west of Srpingboro in Crawford county during the late afternoon. This tornado continued on the ground for over six miles and damaged around ten homes and buildings. The second tornado on the 26th occurred in nearby Ashtabula county.
The weather quieted down in June and July with no large severe weather outbreaks. In Ashtabula county on June 7th, a thunderstorm downburst produced wind gusts in excess of 70 mph and knocked down dozens of trees and caused damage at a park in Geneva. Hail the size of eggs was also reported in Lorain county on the 7th. In July, a strong thunderstorm produced downburst wind gusts in excess of 70 mph causing damage to several buildings in Wood county.
Larger outbreaks occurred on August 1st, 18th, and 25th. Large hail was reported throughout northern Ohio on the 1st. Hail the size of baseballs was reported near Upper Sandusky in Wyandot county. Golf ball or larger sized hail was also reported in Lake, Portage, Sandusky, and Medina counties. Hundreds of vehicles were damaged by the hail. More hail fell on the 18th. Lucas county was the hardest hit that day with many reports of golf ball to hen egg sized hail. The last tornado of the year occurred on August 25th in Geauga county. An EF1 tornado touched down near Chesterland and left a nearly three mile long damage path. Also on the 25th, a downburst with 75 mph wind gusts caused a path of damage near Elyria in Lorain county. Summer Thunderstorms and Variable Rainfall Totals... A corridor of heavy rainfall from storms that repeatedly trained over the same area produced overnight flooding on July 19th along a corridor from Cleveland to Akron-Canton. Over 3 inches of rain fell in just a few short hours. Cleveland finished July with nearly twice as much rainfall as normal. Contrast that to Erie which ended up with its 3rd driest July on record with only 0.74 inches of rainfall. July Turns Hot...
Annual Rainfall Records Broken During Fall and Early Winter... At the Close of 2011... Monthly Records... Annual/Yearly Records... Memorable Weather Events... The publication, StormData, can be found with the National Climatic Data Center. 2010-2011 Season Snowfall...
It was a cold and snowy winter. A strong La Nina sent many storm systems across the Great Lakes and Ohio Valley. A blocking pattern in Eastern Canada sent cold air southward. The winter started slow, there was very little snow in November. Starting in early December the cold and snow was consistent. Several large lake effect snows hit in early December. Meadville, Pennsylvania was digging out from nearly 3 feet of snow by December 6th and other sections of northwest Pennsylvania had over 4 feet in just a few days. An intense band of lake effect snow developed over downtown Cleveland on the 8th, just in time for evening rush hour. Additional significant lake effect snows occurred just a few days later and gusty northwest winds made the snow even worse. By mid December, the secondary snowbelt from near Medina and Akron to Youngstown as well as the primary snowbelt east of Cleveland and across northwest Pennsylvania were blanketed by deep snow. Christmas was white but the weather broke for New Years. We had highs near 60F on December 31st. Despite the warm days at the end of the month, December was one of the colder on record. Temperatures averaged 5 to 6 degrees below normal! The snow was generally not as heavy in January and February but it snowed frequently. The Youngstown-Warren Airport reported snow on 29 of the 31 days in January. Youngstown set an all time seasonal snowfall record with 118.7 inches and the new record came in February - with weeks of snow to go! January remained cold with temperatures 3 to 4 degrees below normal. The cold relented a bit in February and it warmed all the way back to near normal. Unlike the past two springs, we were not treated to an early warm up. It snowed at times right into April. When the snow stopped, it kept raining and raining (and raining). Several rainfall records were set in the spring of 2011. Worldwide Climate Anomalies and Events... Additional Notes... |
||||||||||||||||||||||||||||||||||||||||||||||||||||||||||||||||||||||||||||||||||||||||||||||||||||||||||