October 19, 2011Annual Rainfall Record Broken |
|---|
Cleveland Wettest in 141 years
|
|
Highest Daily Precipitation (inches) for 1/1/11 - 10/19/11
For the annual records and latest countdown at other locations around the area visit our Countdown to the Record page. Youngstown may also be threatening their record by the end of the year. |
||||||||||||||||||||||||||
|
The smooth red line indicates normal precipitation. The green line is the accumulation for the previously wettest year on record. That year was 1990. The tan line is the accumulation for the driest year on record which was 1963. The heavy dark blue line is the precipitation accumulation for 2011. This graph shows that 2011 surpassed the normal amount of rain for a year in August and on Oct 19th, surpassed the wettest year on record. This year has been steadily climbing ever since the heavy rainfall and flooding that resulted back on February 28th. February 28th was the 4th wettest day this year (as of 10/19/11), but the rainfall combined with rapid snowmelt led to widespread flooding. One of the other notable leaps on the graph can be attributed to training thunderstorms that were confined to the Cleveland to Canton corridor. Cleveland recorded 3.19 inches of rain within just a few hours during the early morning hours of July 19th. July 19th ended the day with 3.54 inches and this has been 2011's wettest day (again, as of 10/19/11). Another leap occurred on August 14th when Cleveland received 3.51 inches of lake-enhanced rain. Finally, on October 19th, Cleveland had 2.13 inches of rain and we broke the previous annual record. Records for Cleveland date back to 1871. |
|||||||||||||||||||||||||||
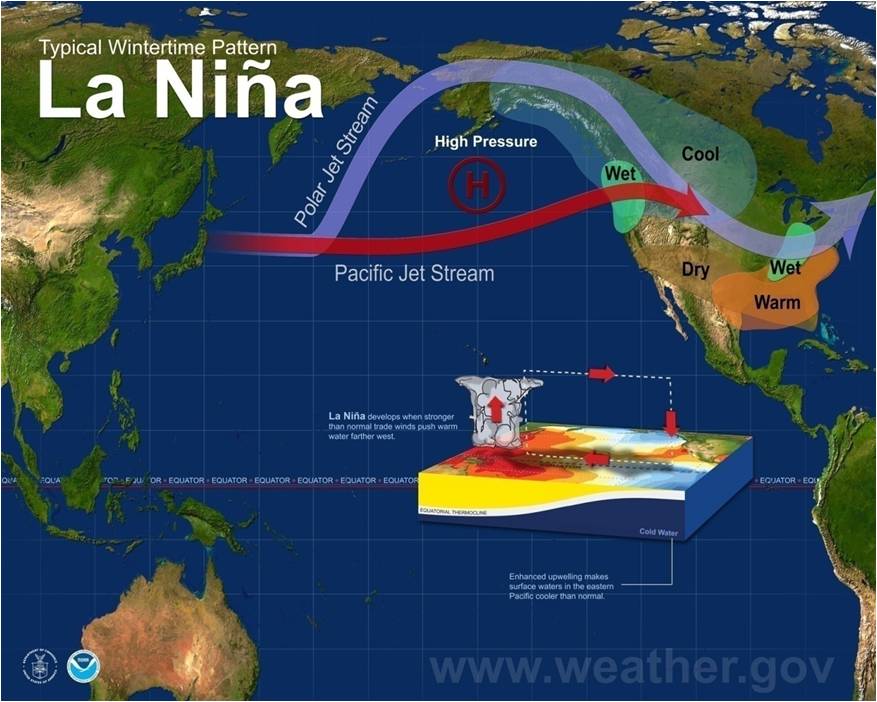
Why So Wet?With two full months yet to go, 2011 has already made the record books as one of or the wettest year on record. Why has 2011 been so wet? The primary cause of this active season can be traced to the Pacific Ocean, more specifically the La Nina episode. La Nina is a cooling of the eastern equatorial Pacific. During La Nina, wetter than normal conditions tend to be observed over the Great Lakes, especially during the winter and spring months. This is because a La Nina weather patterns favors a trough developing near the Great Lakes, which favors more storminess and subsequent precipitation. This pattern also favors drying and warm conditions in the south, which corresponds to the drought conditions observed in Texas this year.
During the summer months temperatures were above normal, and so was the humidity. Dew points were observed in the 70s for several days this summer, which supported heavy to torrential rainfall. Lake Erie observed water temperatures several degrees above normal this summer, reaching the upper 70s to lower 80s. As a result, the lakeshore counties observed a number of lake enhanced rain events.
The La Nina conditions are expected to strengthen during the winter and spring of 2012, which means chances are high that Ohio will observe above normal precipitation well into next year.
|
|||||||||||||||||||||||||||
The Number of Days Each Month with Greater Than a Trace Amount of Precipitation at Cleveland
|
|||||||||||||||||||||||||||
| Jan | Feb | Mar | Apr | May | Jun | Jul | Aug | Sep | Oct | Nov | Dec | |
|---|---|---|---|---|---|---|---|---|---|---|---|---|
| 2011 | 18 | 11 | 14 | 17 | 20 | 10 | 9 | 11 | 18 | 10 (so far) | - | - |
 |
 |

Green indicates an above normal chance of precipitation, and brown indicates a below normal chance. Across the Ohio Valley it is expected that we'd be more likely to have above normal precipitation from December through April than near or below normal precipitation.