|
|
A team of National Weather Service Meteorologists performed an extensive survey of the tornado path in northeast Wood and western Ottawa counties. It was determined that a tornado with an intensity of EF4 with winds of approximately 170-175 MPH moved through the area.
The tornado first touched down near I-80 and Oregon Rd. (east of Perrysburg) at 11:20 PM EDT, moved across the south side of Moline, near Metcalf Airport, across the northwest side of Millbury, into Ottawa county following Trowbridge Rd., and finally lifting at 11:35 PM EDT just west of Clay Center. |
|
The map below shows the path of the tornado. Click on the map to open an interactive page that will allow you to view a description and survey pictures at each of the place markers.
|

|
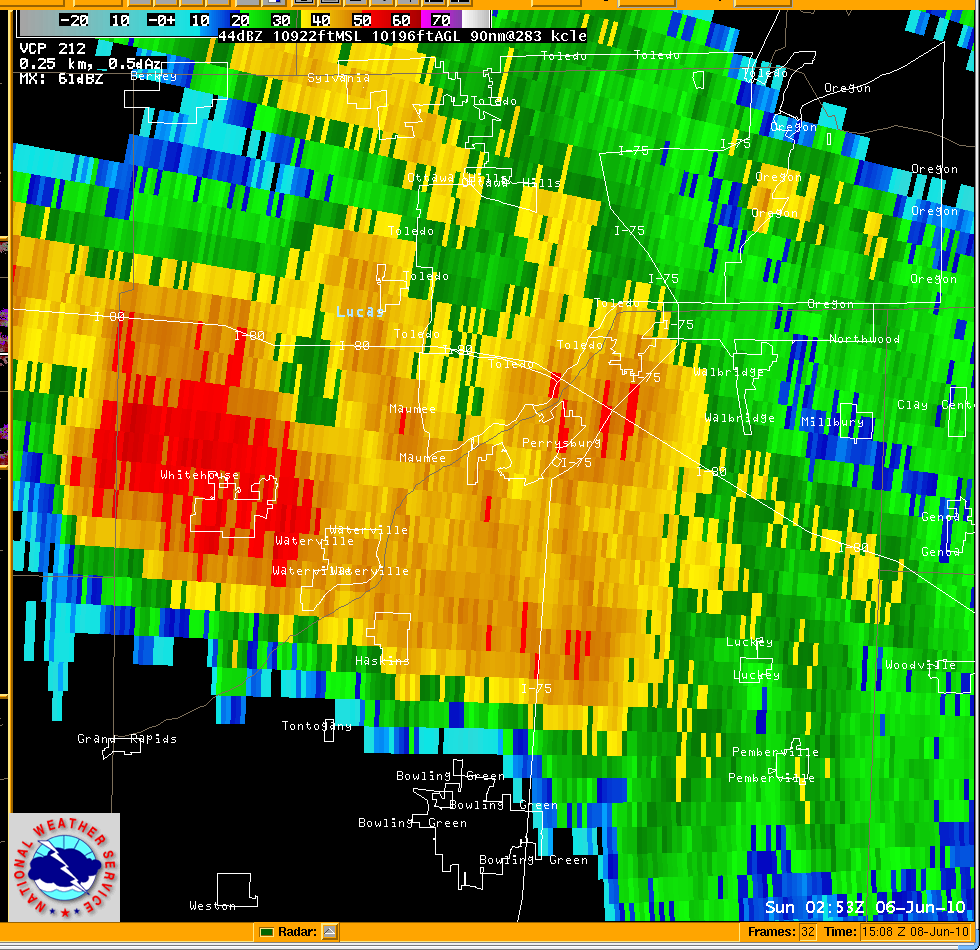
The morning of Saturday June 5th began with a stationary boundary located across the southern great lakes. Additional outflow boundaries from early morning convection and the lake breeze were also located across northern Ohio. These various boundaries contributed to the afternoon spin up of tornadoes across the Central Highlands into eastern Ohio. As low pressure moved eastward along the stationary boundary Saturday evening it strengthened significantly as it moved onto Lake Erie. Moist and unstable air south of the stationary boundary and ahead of an advancing cold front set the stage for supercell thunderstorms to develop across northwest Ohio before midnight. As the cold front moved overhead it brought a second round of strong to severe thunderstorms after midnight. |


| Time: 0253Z / 1053 PM EDT | |
 |
 |
| Time: 0258Z / 1058 PM EDT | |
 |
 |
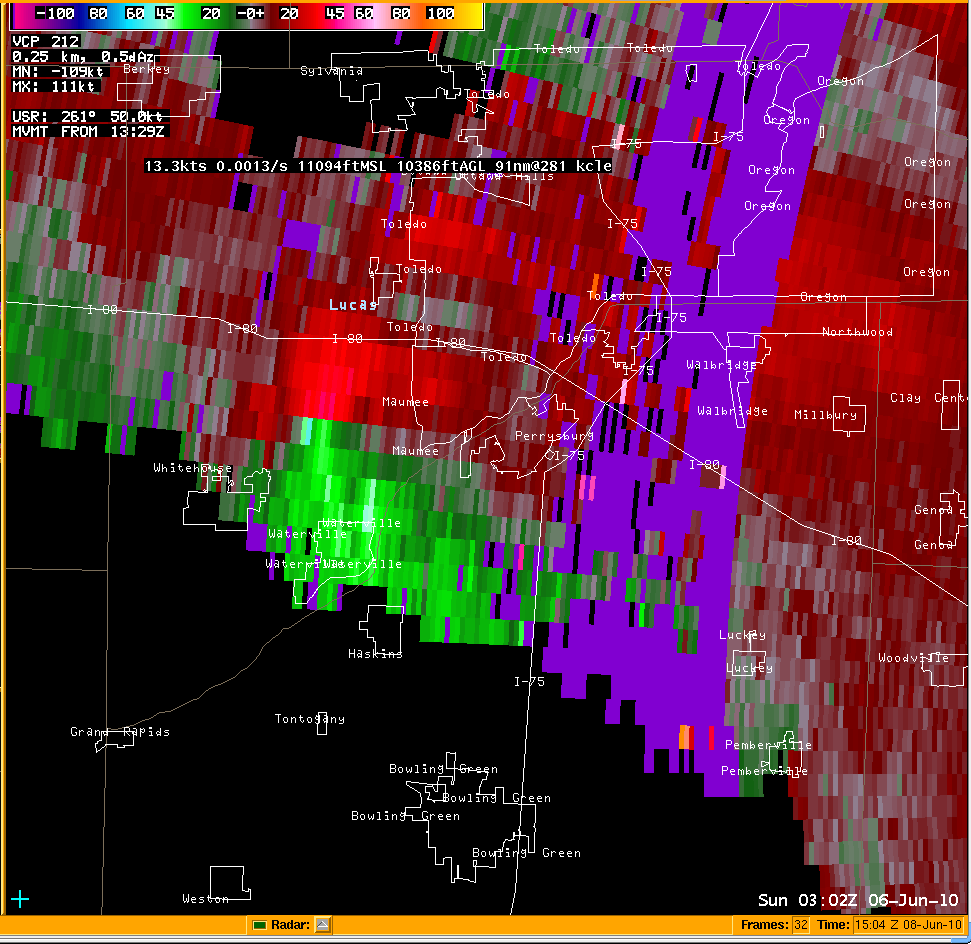
| Time: 0302Z / 1102 PM EDT | |
 |
 |
| Time: 0307Z / 1107 PM EDT | |
 |
 |
| Time: 0311Z / 1111 PM EDT | |
 |
 |
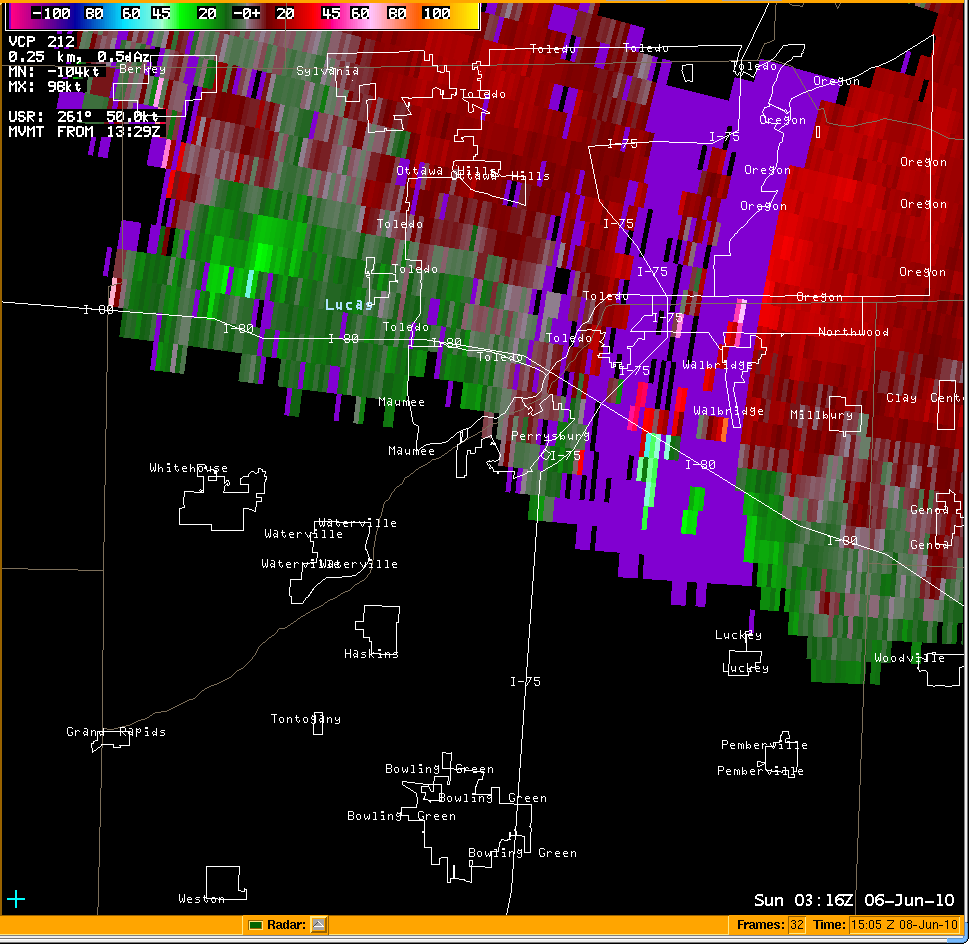
| Time: 0316Z / 1116 PM EDT | |
 |
 |
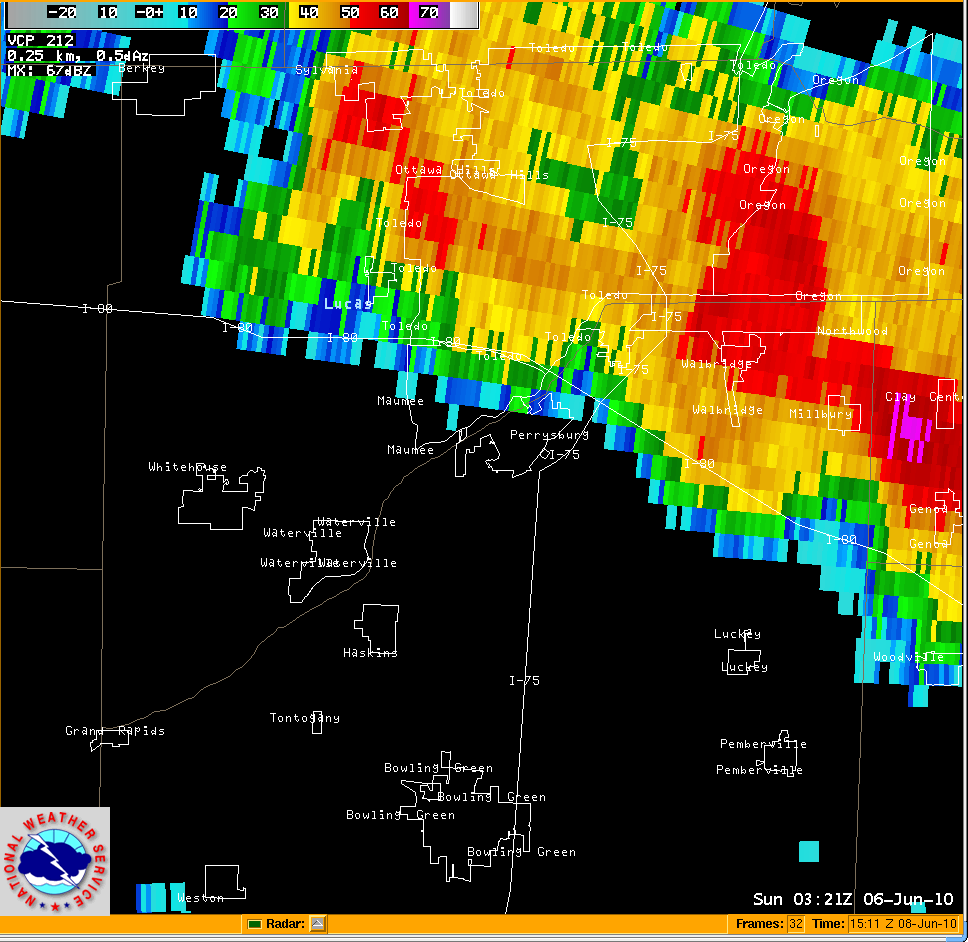
| Time: 0321Z / 1121 PM EDT | |
 |
 |
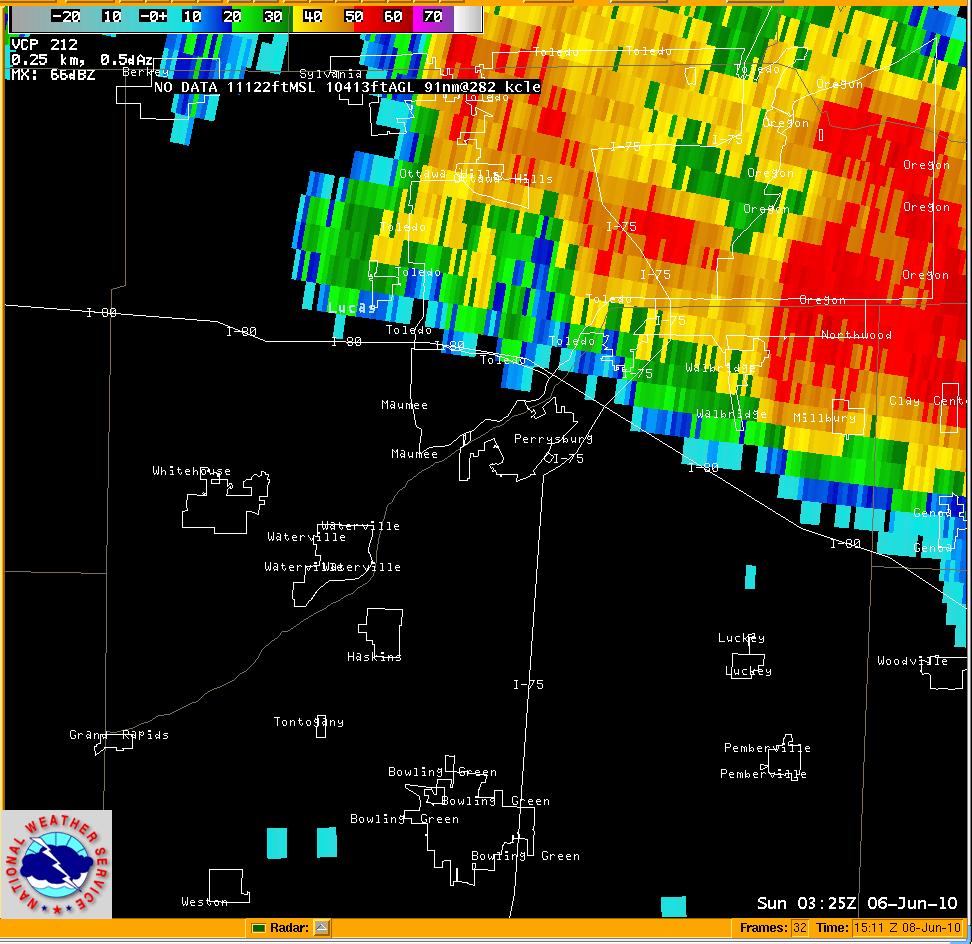
| Time: 0325Z / 1125 PM EDT | |
 |
 |
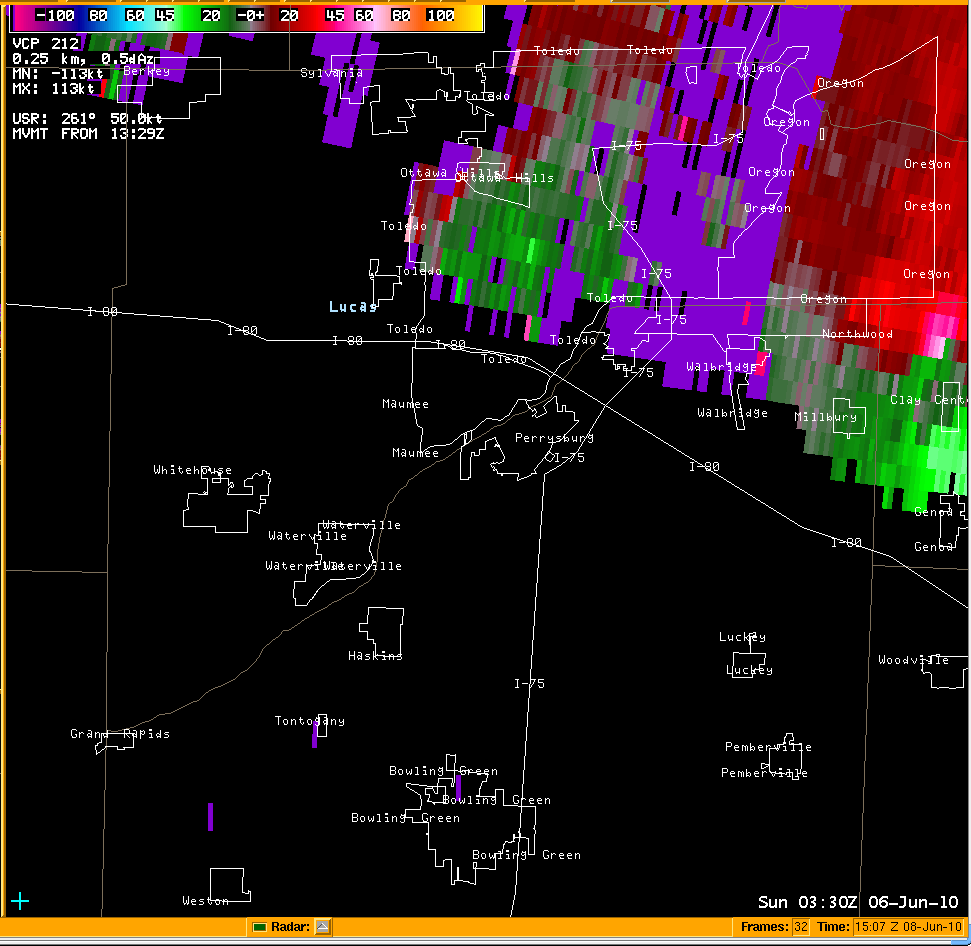
| Time: 0330Z/ 1130 PM EDT | |
 |
 |
|
SRM: Storm Relative Velocity Map Storm relative images are useful to look for small circulations (called mesocyclones) in thunderstorms. Often, these small scale circulations are areas where tornadoes may form and are typically indicated by strong inbound wind located beside strong outbound wind relative to the radar. The motion of the storms are "subtracted" from the overall flow of the winds. As storms move, their own motion can mask circulations within themselves. This motion is removed to make the view of the wind relative to the storm. In effect, what is seen is the wind's motion as if the storm were stationary. Red indicates wind moving away from the CLE radar and the green color indicates motion toward the radar. Learn More Here |
|
Click Here to see the other tornadoes that occurred on June 5-6, 2010.

