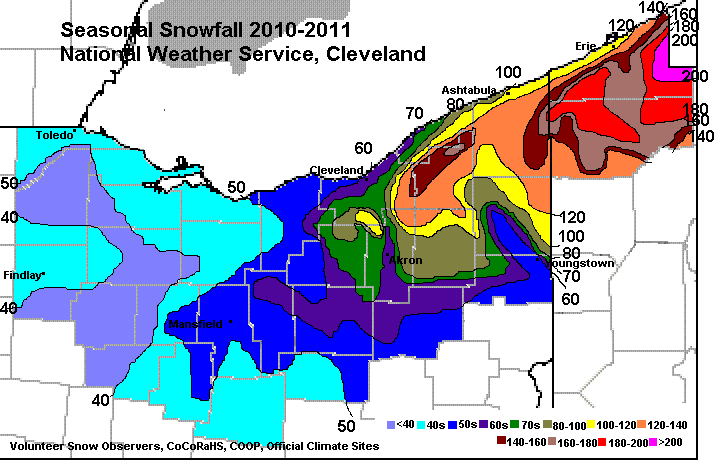
Winter 2010-2011.
It was a cold and snowy winter. A strong La Nina sent many storm systems across the Great Lakes and Ohio Valley. A blocking pattern in Eastern Canada sent cold air southward.
The winter started slow, there was very little snow in November. Starting in early December the cold and snow was consistent. Several large lake effect snows hit in early December. Meadville, Pennsylvania was digging out from nearly 3 feet of snow by December 6th and other sections of northwest Pennsylvania had over 4 feet in just a few days. An intense band of lake effect snow developed over downtown Cleveland on the 8th, just in time for evening rush hour.
Additional significant lake effect snows occurred just a few days later and gusty northwest winds made the snow even worse. By mid December, the secondary snowbelt from near Medina and Akron to Youngstown as well as the primary snowbelt east of Cleveland and across northwest Pennsylvania were blanketed by deep snow. Christmas was white but the weather broke for New Years. We had highs near 60F on December 31st. Despite the warm days at the end of the month, December was one of the colder on record. Temperatures averaged 5 to 6 degrees below normal!
The snow was generally not as heavy in January and February but it snowed frequently. The Youngstown-Warren Airport reported snow on 29 of the 31 days in January. Youngstown set an all time seasonal snowfall record with 118.7 inches and the new record came in February - with weeks of snow to go! January remained cold with temperatures 3 to 4 degrees below normal. The cold relented a bit in February and it warmed all the way back to near normal.
Unlike the past two springs, we were not treated to an early warm up. It snowed at times right into April. When the snow stopped, it kept raining and raining (and raining). Several rainfall records were set in the spring of 2011.
| 2010-11 | Oct 10 | Nov 10 | Dec 10 | Jan 11 | Feb 11 | Mar 11 | Apr 11 | May 11 | Total 2010-11 |
| Toledo | 0.0 | T | 6.0 | 13.3 | 25.2 | 4.7 | T | 0.0 | 49.2 |
| Mansfield | 0.0 | T | 10.5 | 17.8 | 25.3 | 5.5 | T | 0.0 | 59.1 |
| Cleveland | 0.0 | T | 12.7 | 21.5 | 23.3 | 11.8 | T | T | 69.3 |
| Akron-Canton | 0.0 | 0.3 | 19.5 | 18.9 | 18.4 | 8.2 | T | 0.0 | 65.3 |
| Youngstown | 0.0 | T | 53.1 | 30.0 | 20.6 | 14.4 | 0.6 | T | 118.7 |
| Erie PA | 0.0 | 1.4 | 17.6 | 35.9 | 35.7 | 17.6 | 2.0 | 0.0 | 110.2 |

