Severe thunderstorms and flash flooding risks increase across the center of the nation today. Meanwhile, ongoing thunderstorms and flash flooding will linger along the Gulf Coast states through the evening. The Great Basin and Intermountain West, warm temperatures and dry fuels with dry lightning may enhance fire weather potential. In addition, across interior Alaska, Red Flag Warning are posted. Read More >
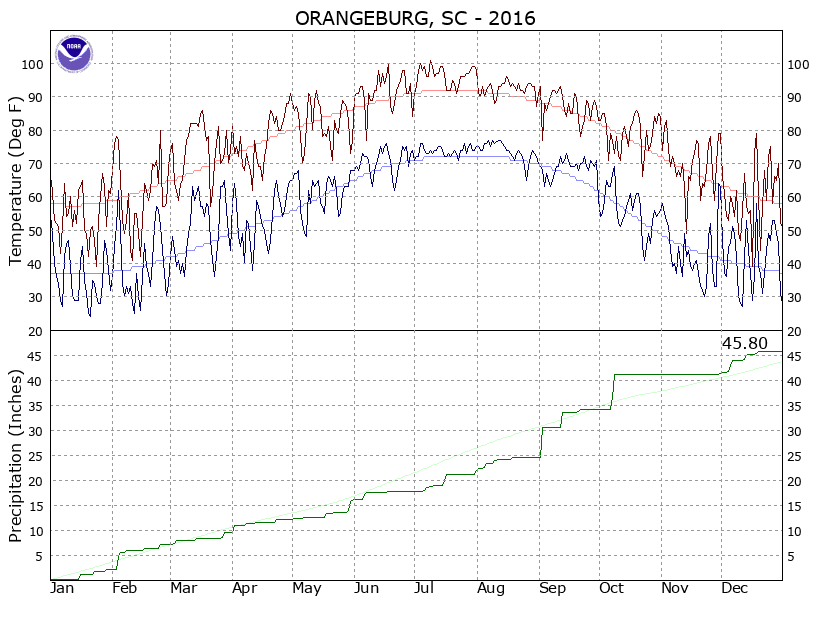
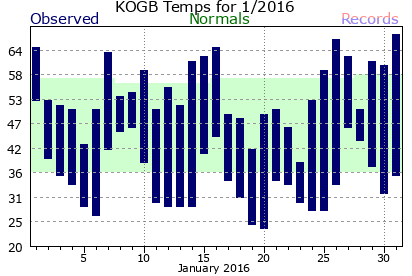
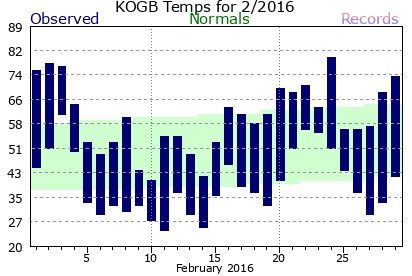
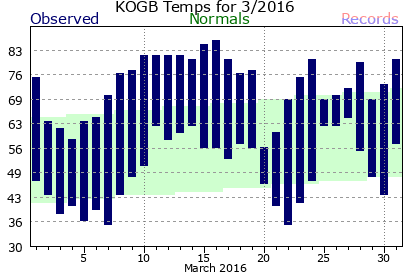
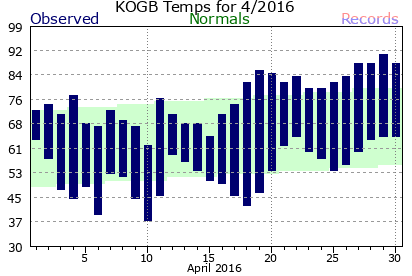
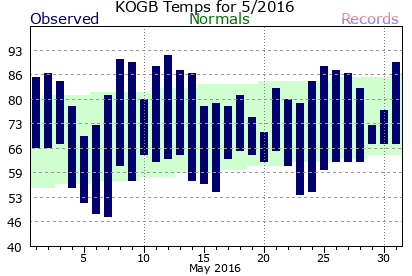
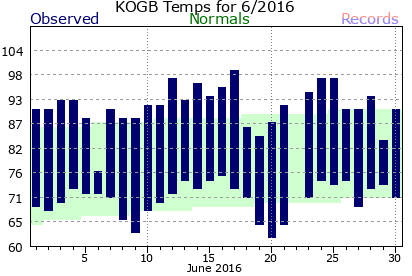
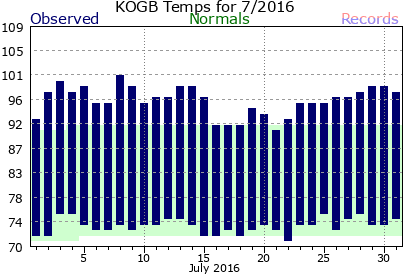
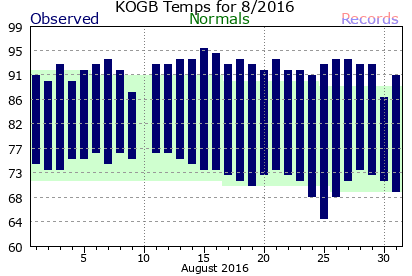
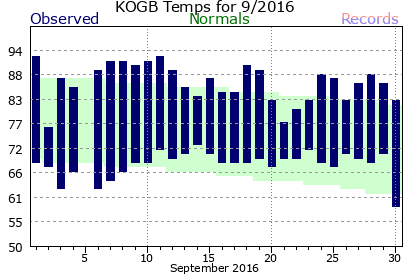
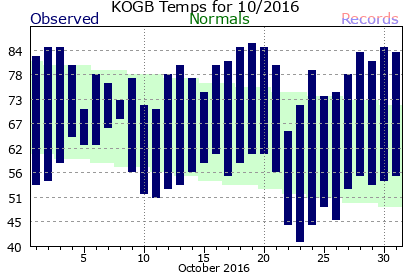
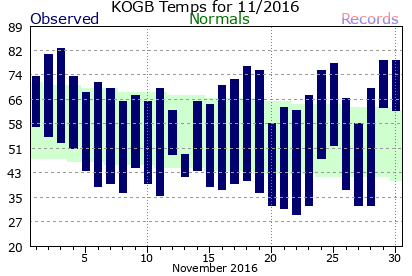
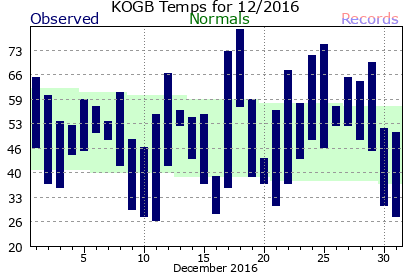
2016 Orangeburg Climate PlotsClimate data on this page is PRELIMINARY (unofficial). CERTIFIED (official) climate data is available from the National Climatic Data Center (NCDC).
|