
A heat wave over the Southwest will intensify late week, peaking and expanding into the Intermountain West and northern High Plains this weekend. Severe thunderstorms and heavy rain are expected over portions of the Plains and Mississippi Valley tonight, which will shift to parts of the Upper Midwest and mid-Mississippi Valley Friday. Monsoonal showers and flooding persist in the Desert Southwest. Read More >
About the frost depth observations and plots
***Frost Depth data is unofficial and is for informational purposes only***
About the data:
-Frost depth observations are taken using NWS/HAHN frost gauge. More information on this gauge can be found on pages 4 and 5 of: https://www.crh.noaa.gov/Image/mkx/pdf/newsletter/Summer_2013_Vol5_Iss1.pdf
-These plots will be updated every few days through the winter months. For more up to date observations, see:
-Some locations report a few days per week, while others daily
-The snow is not cleared away around the frost gauges, aside from digging down to the frost gauge in the deeper snow. The snow does add insulation in times of colder weather, so uninsulated surfaces may have a deeper frost level, in times of very cold weather.
About the plots:
-The plots contain 2 elements:
Depth: This element refers to the depth of frost penetration. Observations are denoted by small boxes. If the ground is completely thawed, this will be zero
Thaw: This element refers to the depth that the ground has thawed. Observations are denoted by a small “x”. If there is no frost, or the ground is frozen from the surface to the level of the frost depth, the thaw would be zero.
-Data plots for the same seasons use the same color for both frost depth and the depth of ground thawed.
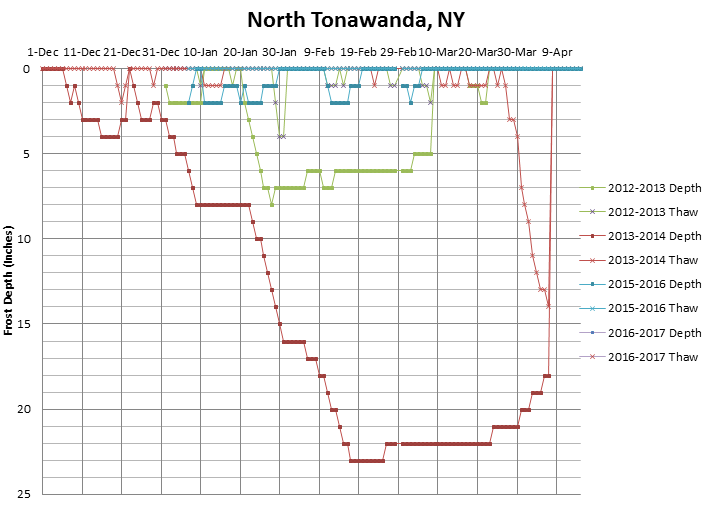
-An example, using the plot below: for the 2013-2014 season (red lines), around April 7th, the frost depth was 18 inches, but the ground had started thawing, so the thaw was 14 inches. Therefore the ground was only frozen between 14 inches and 18 inches below the surface. The next day, April 8th, the ground was completely thawed, and both the frost depth and the thaw went to zero, accounting for the vertical line.
-Another example, On Jan 30th of 2013 (2012-2013 season), the ground was completely thawed at North Tonawanda. On Jan 30th 2014, the ground was frozen from the surface to 15 inches, and on Jan 30th 2015, the ground was only frozen between 4 and 7 inches.
2. Depth
- This plot only contains the frost depth, it does not indicate any thaw that may be present from the surface to the frozen layer

