Excessive rainfall may produce locally considerable flash flooding over parts of the northwestern Gulf Coast, lower Mississippi River Valley, and Deep South through Thursday. Potential Tropical Cyclone One is forecast to become a tropical storm (Arthur) as it moves along or just off the northwestern Gulf coast through Wednesday. An outbreak of severe weather is forecast in the Midwest Wednesday. Read More >
|
NWS Buffalo New York Fire Weather Page
|
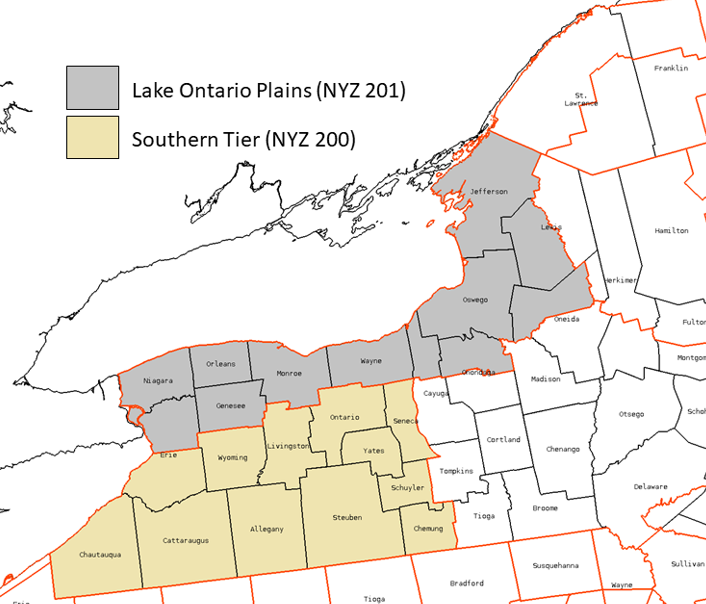
Fire Weather Forecast Zones
Questions/comments may be directed to our Fire Weather Program Leader
|
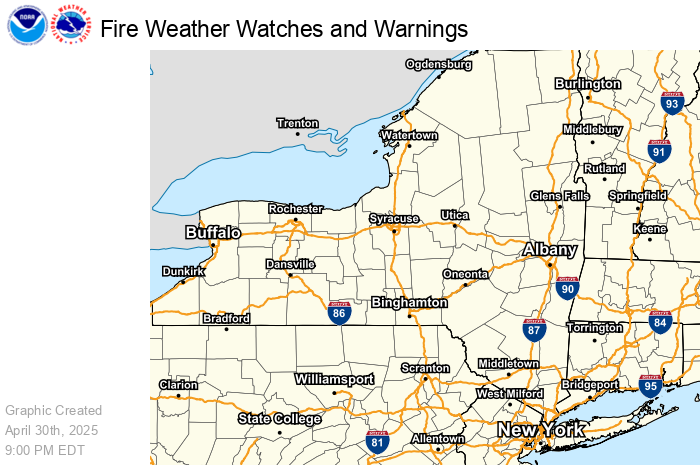
Red Flag Program Latest Fire Weather Watch / Red Flag Warning
 Fire Weather Watches and Red Flag Warnings are issued when the combination of dry fuels and weather conditions support extreme fire danger and/or fire behavior. These conditions alert land management agencies to the potential for widespread new ignitions or control problems with existing fires, both of which could pose a threat to life and property. A Red Flag event is the combination of critical meteorological fire weather conditions coinciding with significantly dry fuels. This combination can lead to the occurrence of large and dangerous wildfires. Since the potential for Red Flag conditions does not exist without receptive fuel conditions, knowledge of existing fuel conditions is essential.
|
Fire Weather Watch is issued 12 - 96 hours in advance of expected onset of red flag criteriaRed Flag Warning is issued when red flag criteria will occur in 48 hours or lessSpecial Weather Statement is issued when conditions support enhanced fire weather behavior, but at levels below Red Flag criteria. SPSs can also be issued to raise elevated fire awareness amongst the fire weather community and the general public. |
Forecast Graphics
 |
 |
|
 |
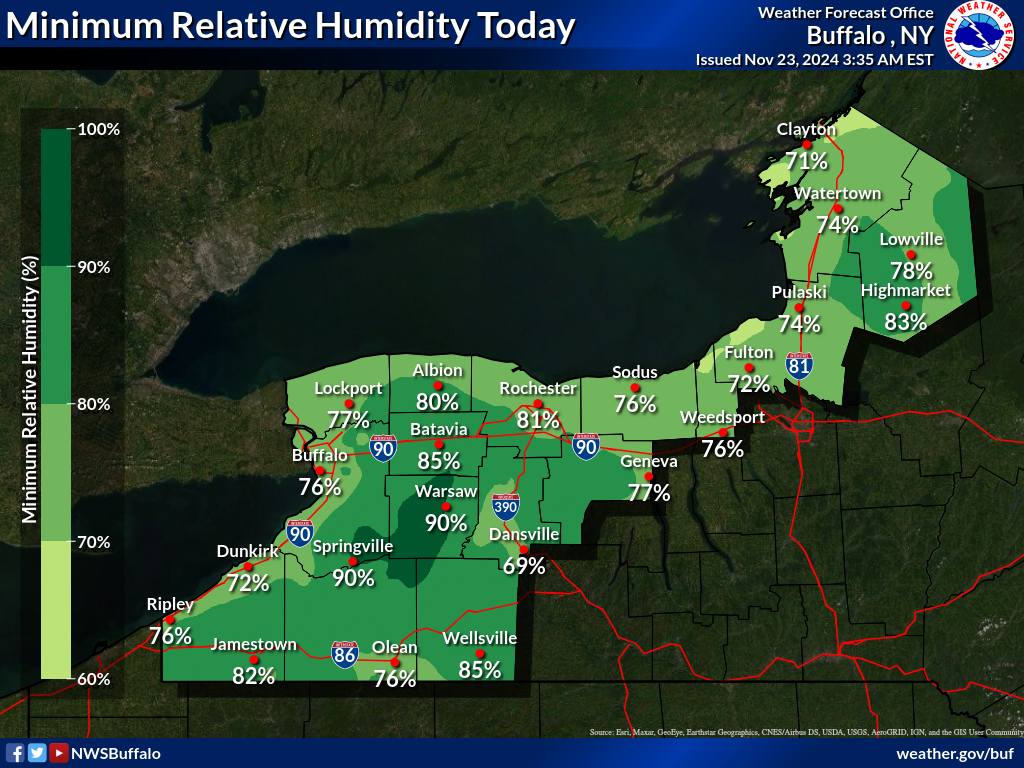
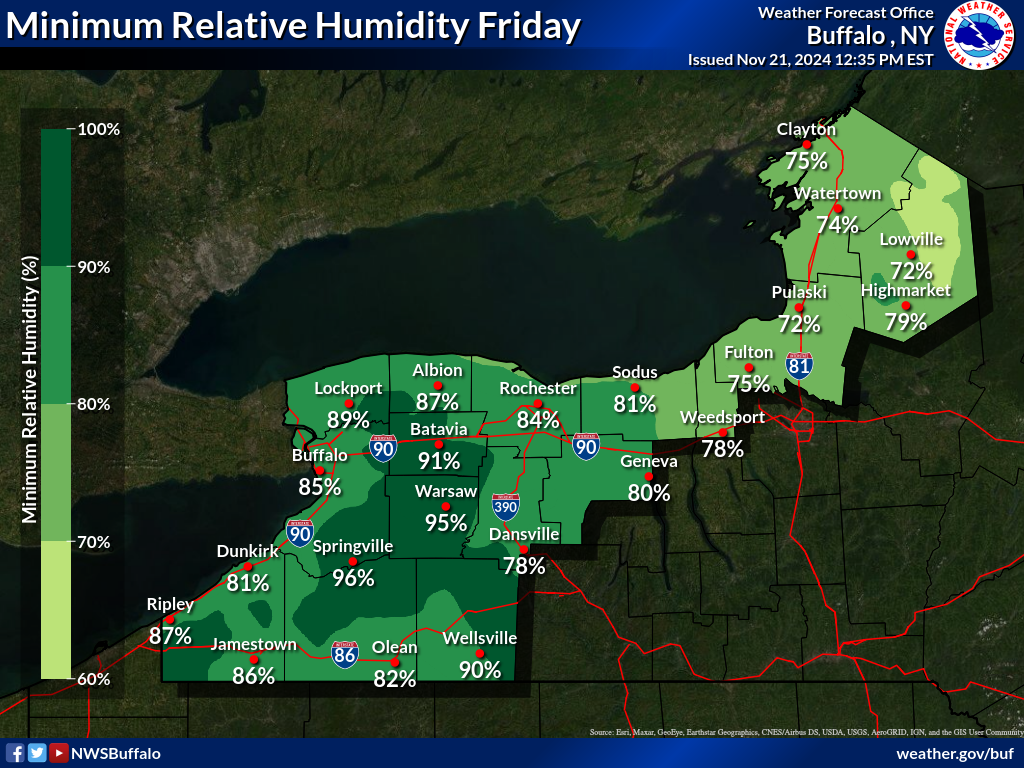
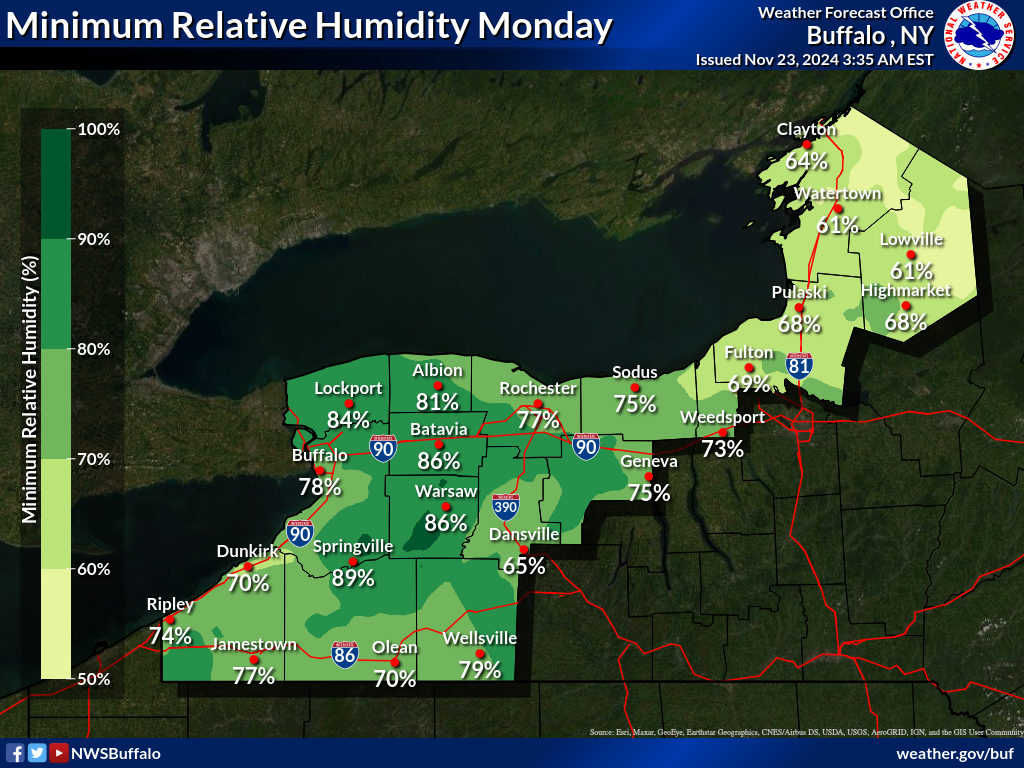
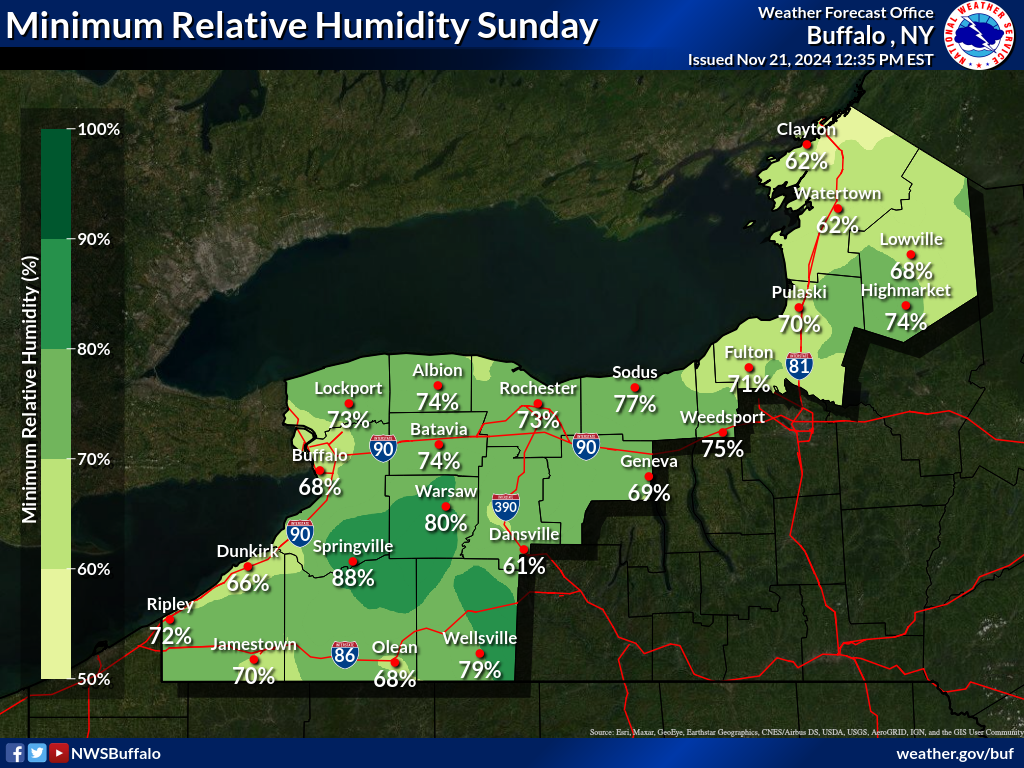
| Min RH Forecast Day 1 |
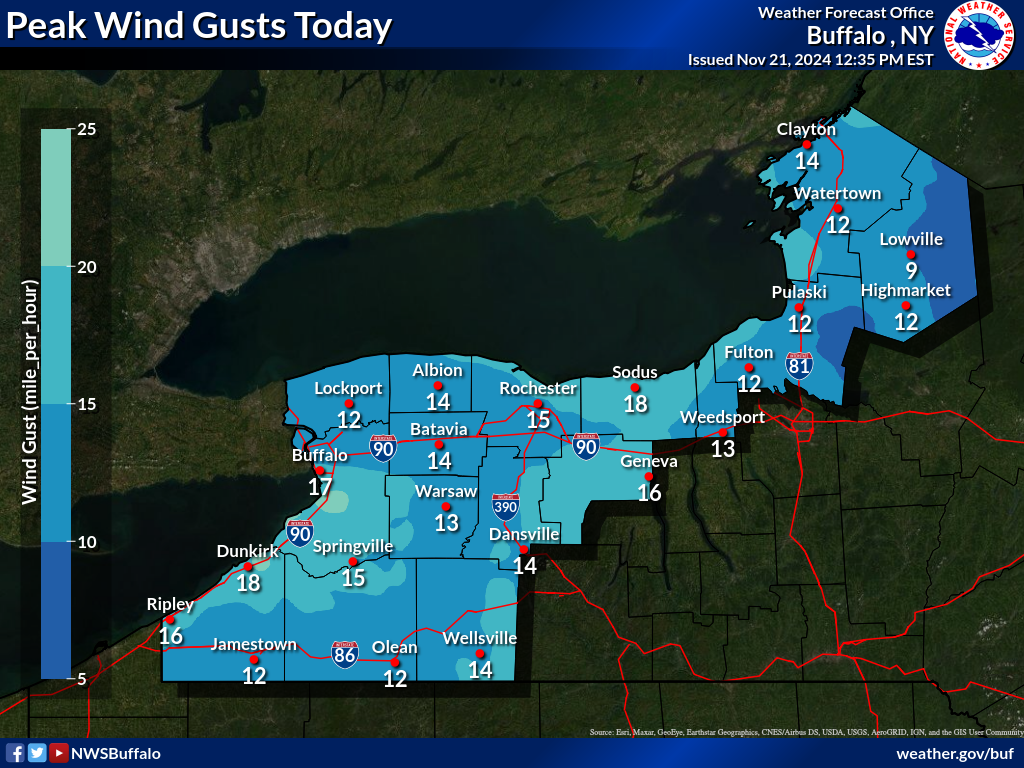
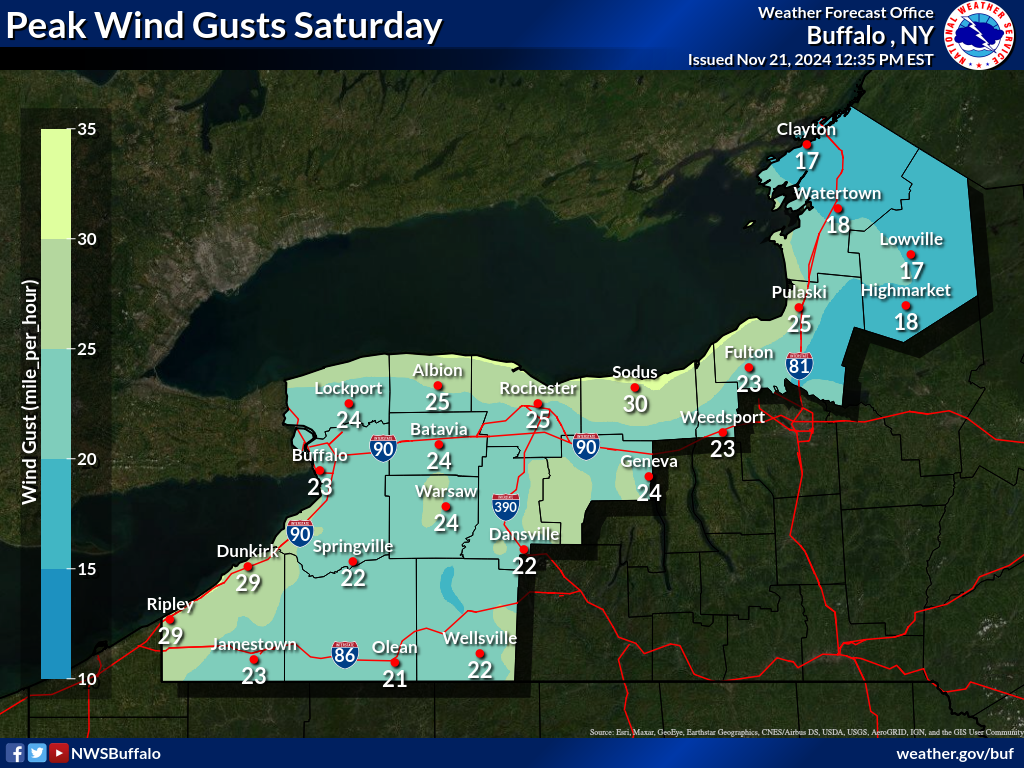
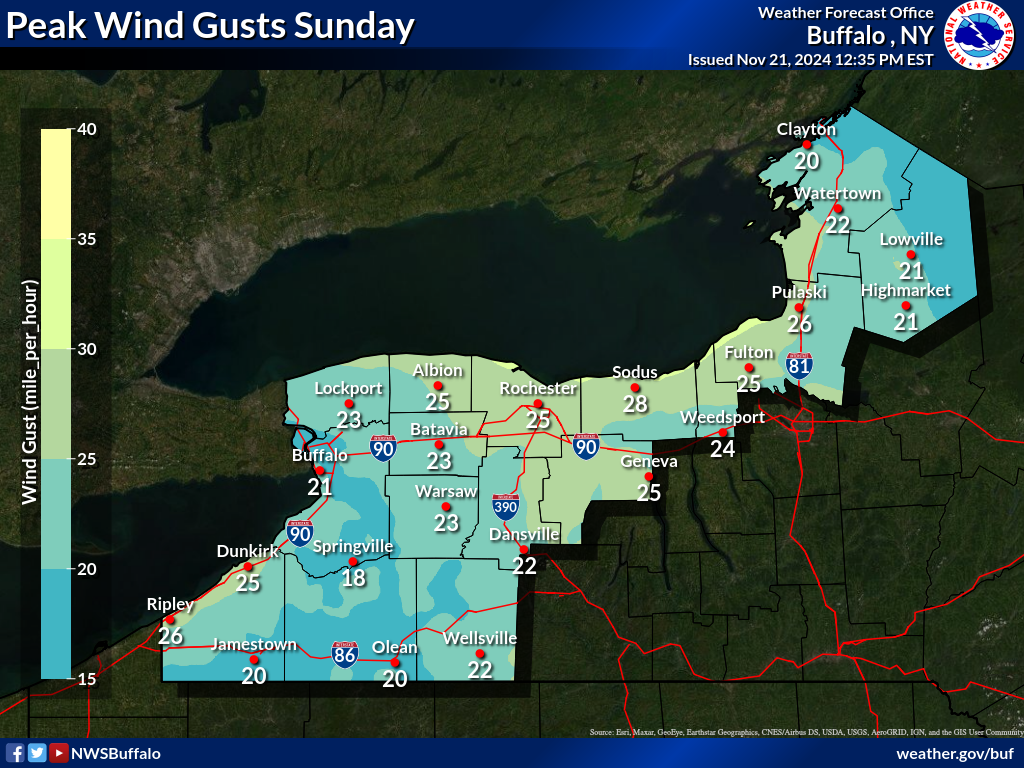
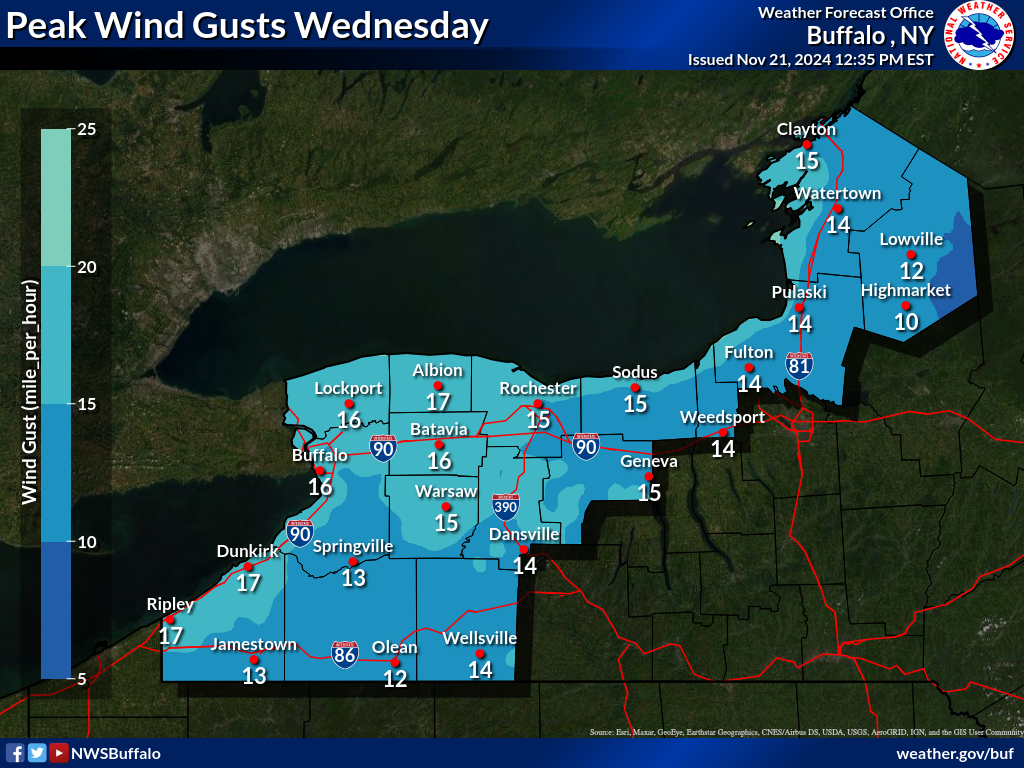
Max Gust Forecast Day 1 |
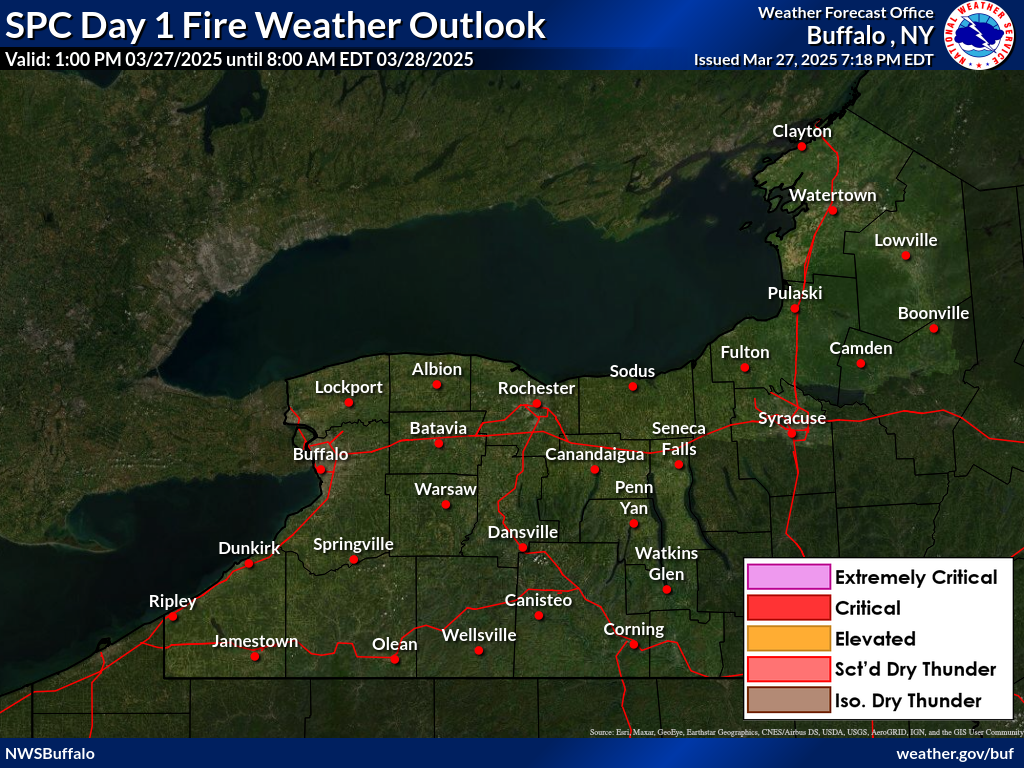
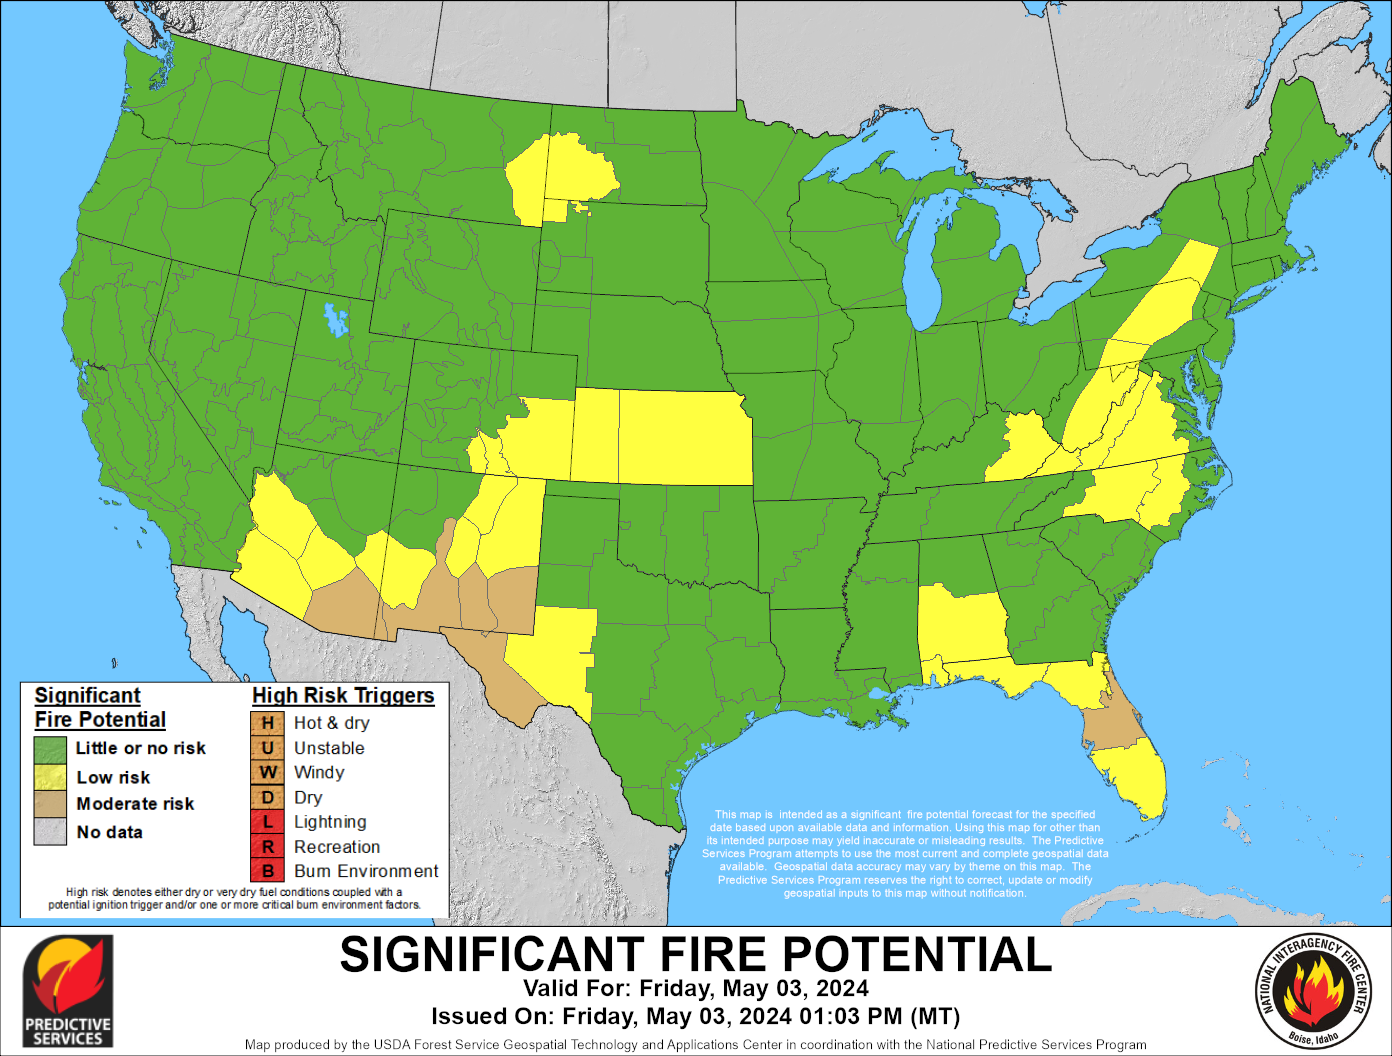
SPC Fire Weather Outlook Day 1 |
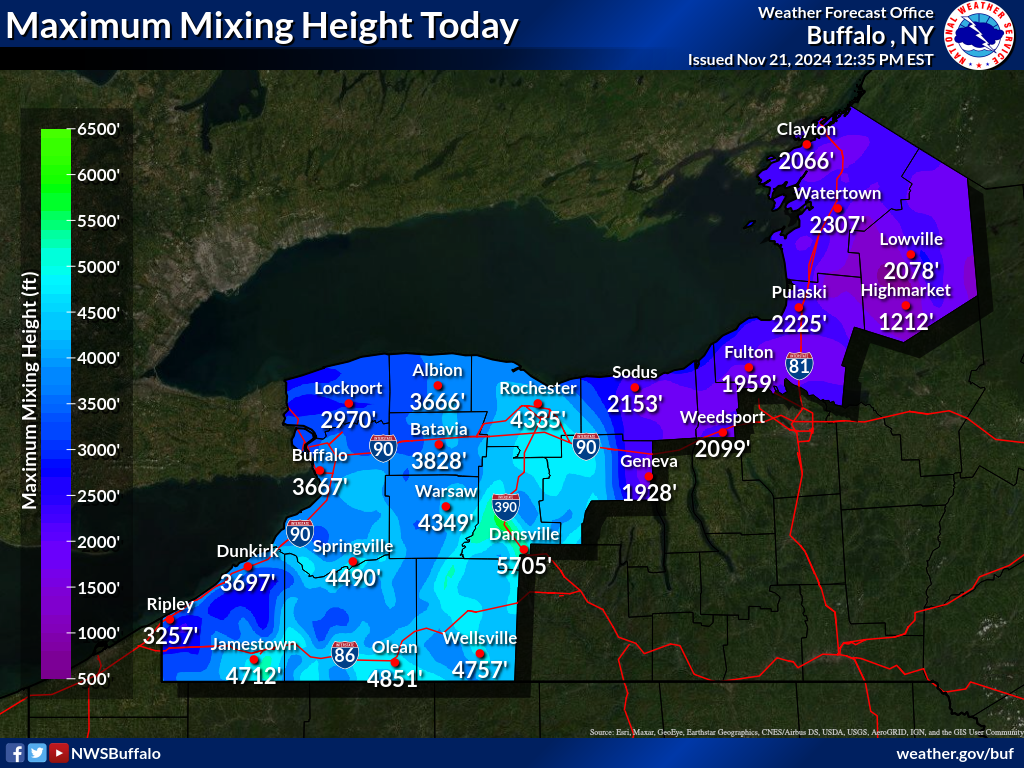
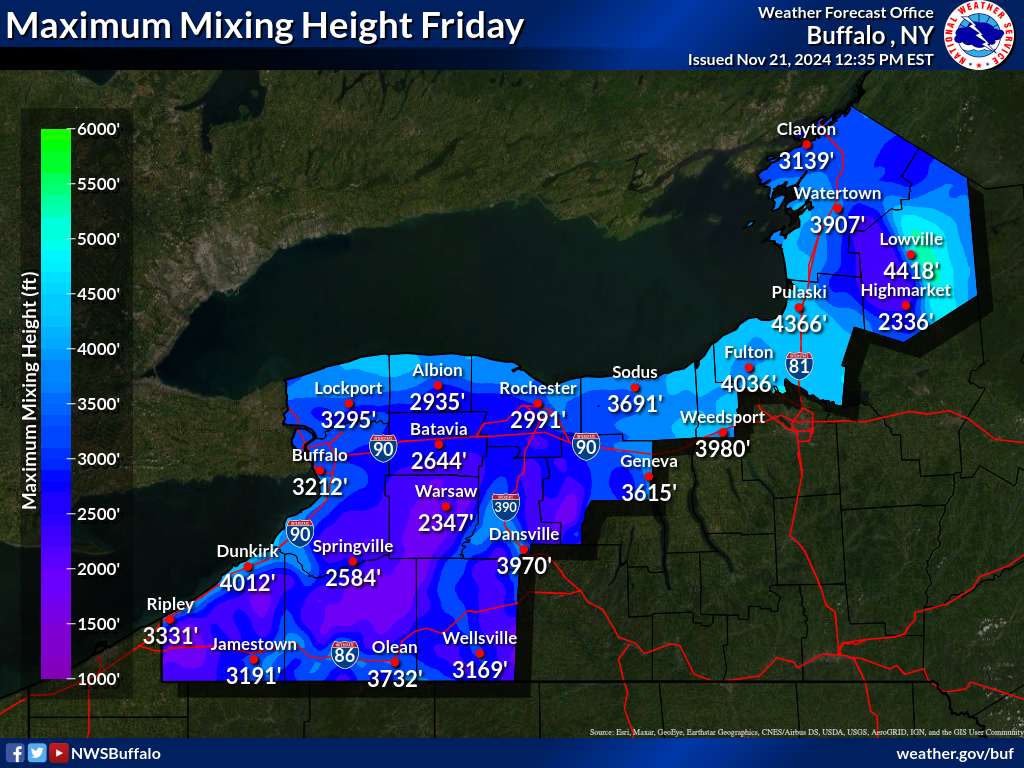
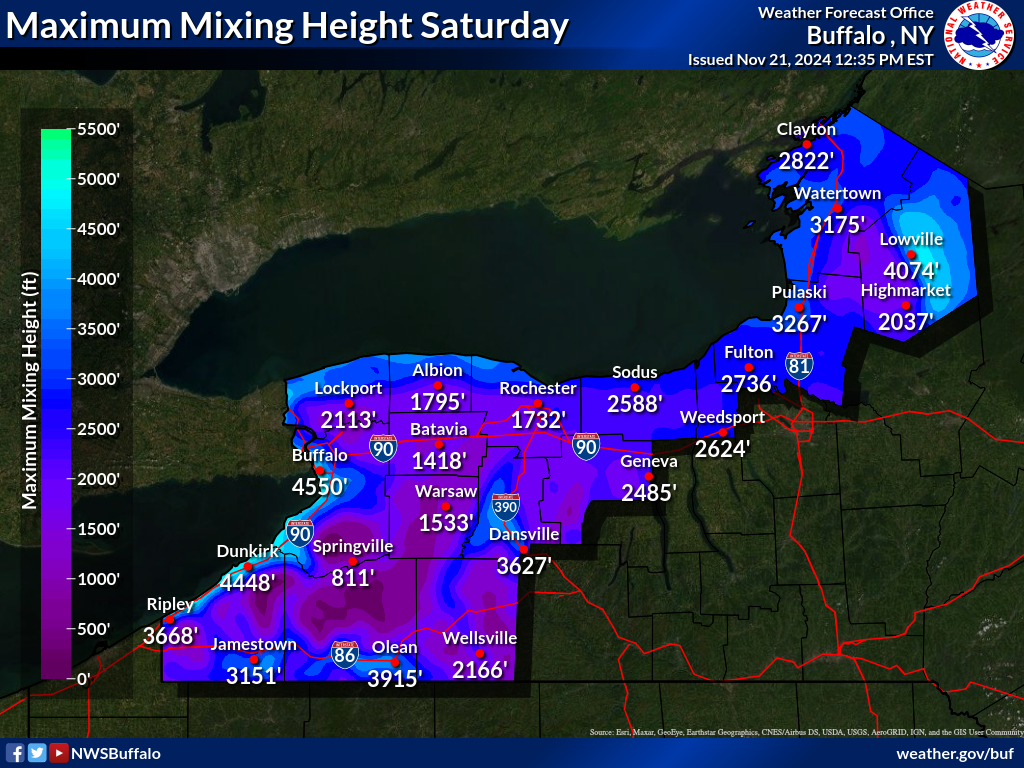
Max Mixing Hgt Forecast Day 1 |
 |
 |
|
 |
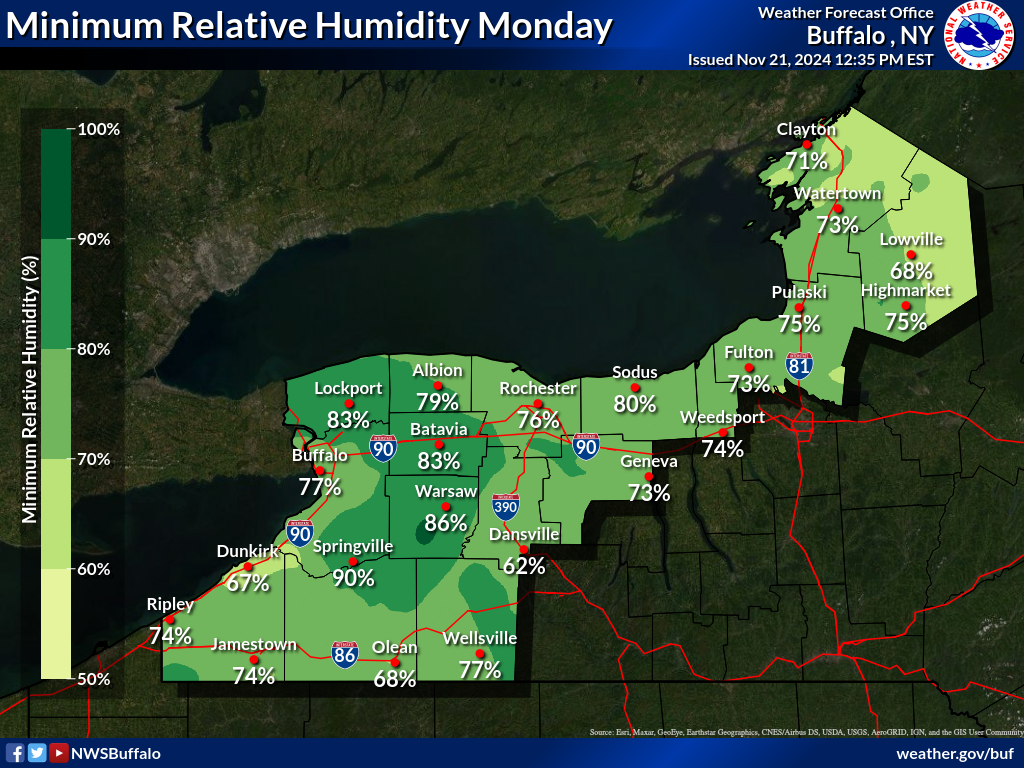
| Min RH Forecast Day 2 |
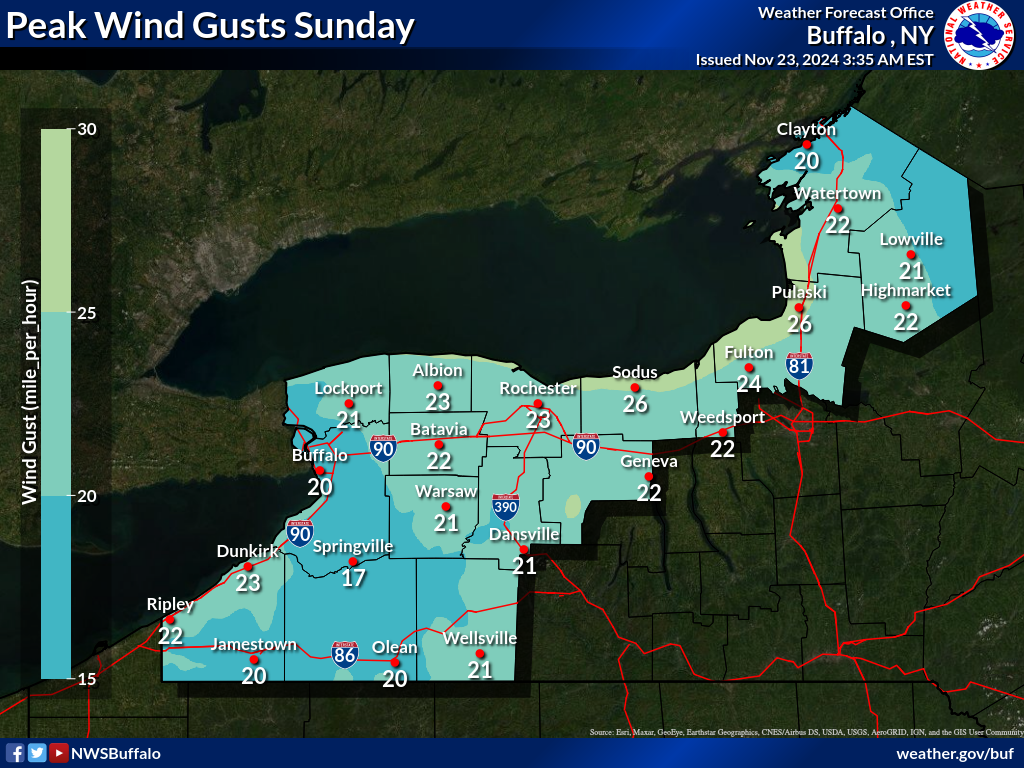
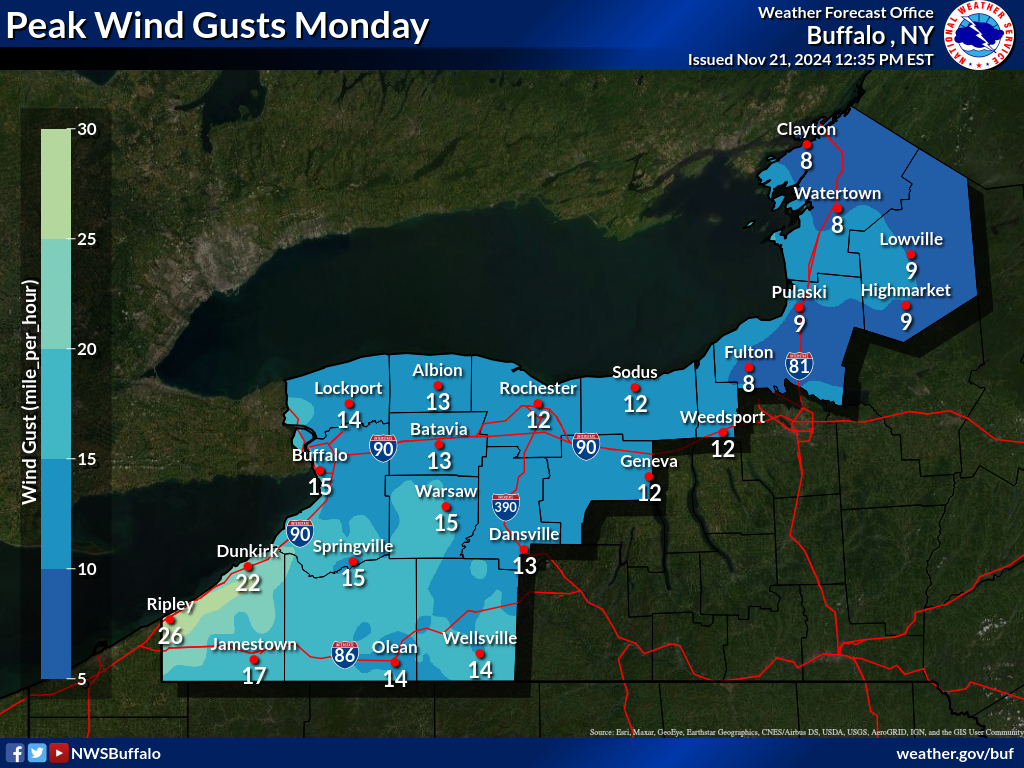
Max Gust Forecast Day 2 |
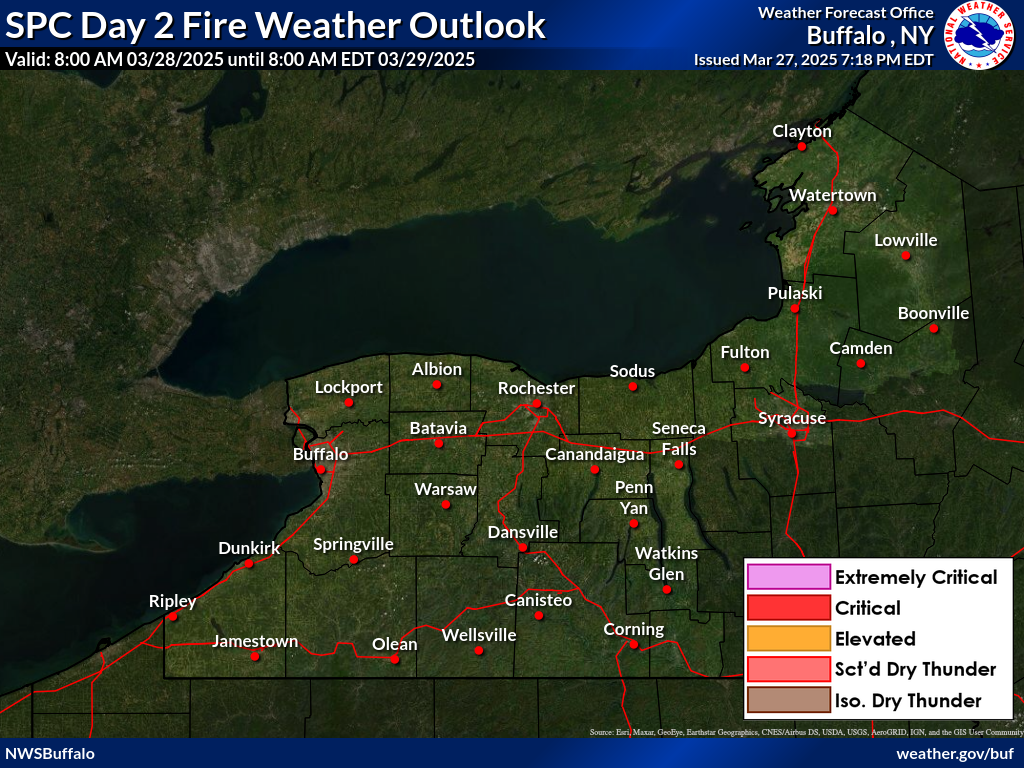
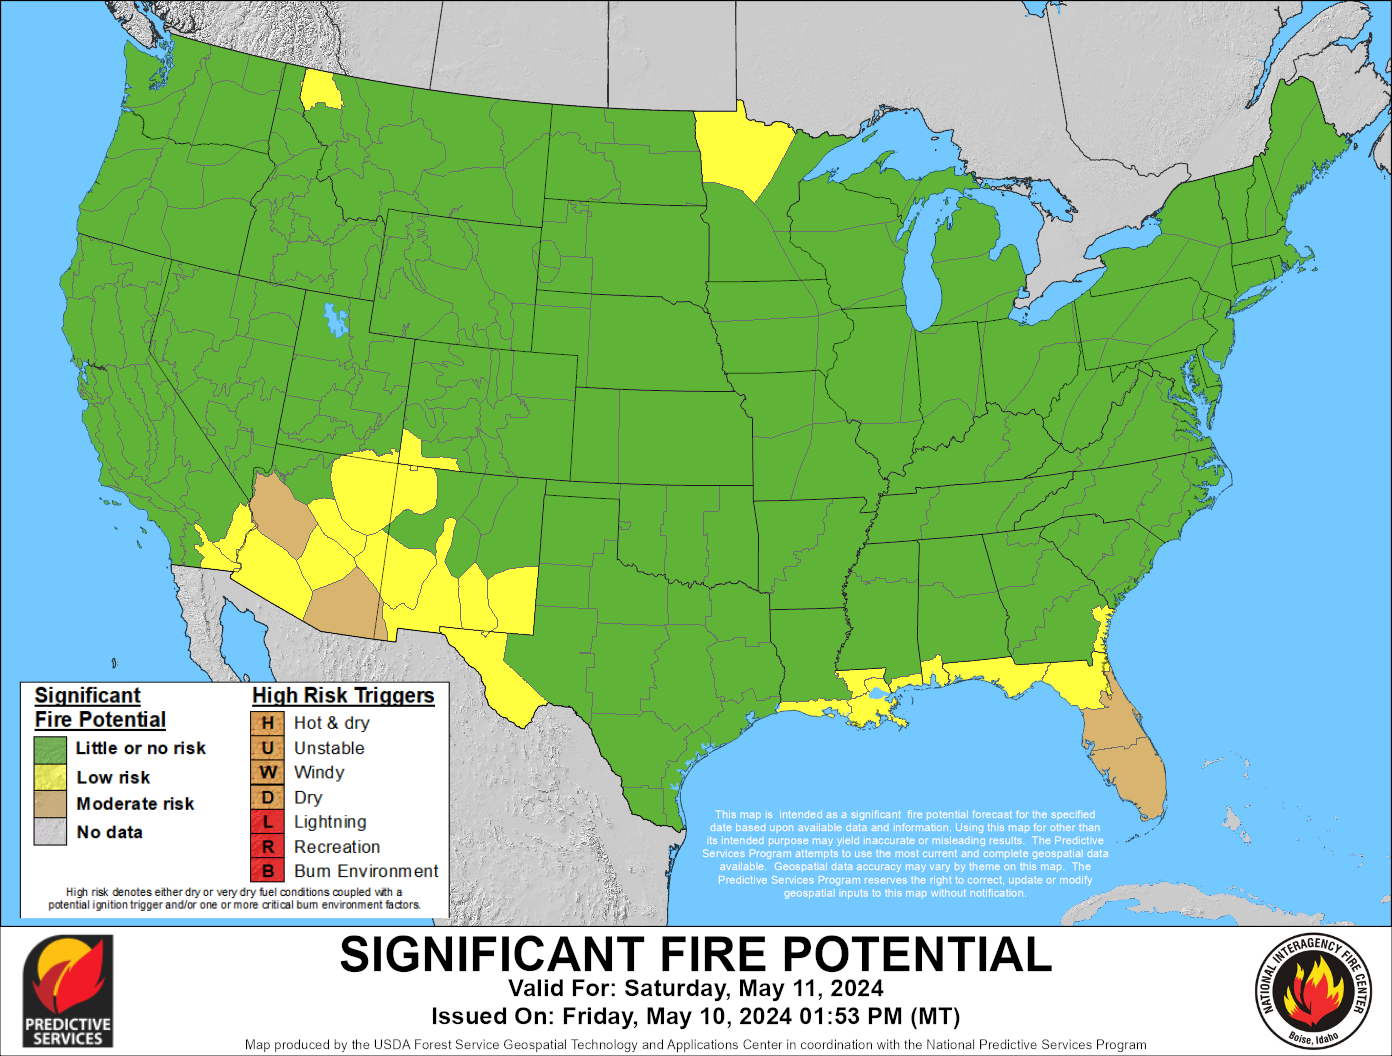
SPC Fire Weather Outlook Day 2 |
Max Mixing Hgt Forecast Day 2 |
 |
 |
 |
 |
| Min RH Forecast Day 3 |
Max Gust Forecast Day 3 |
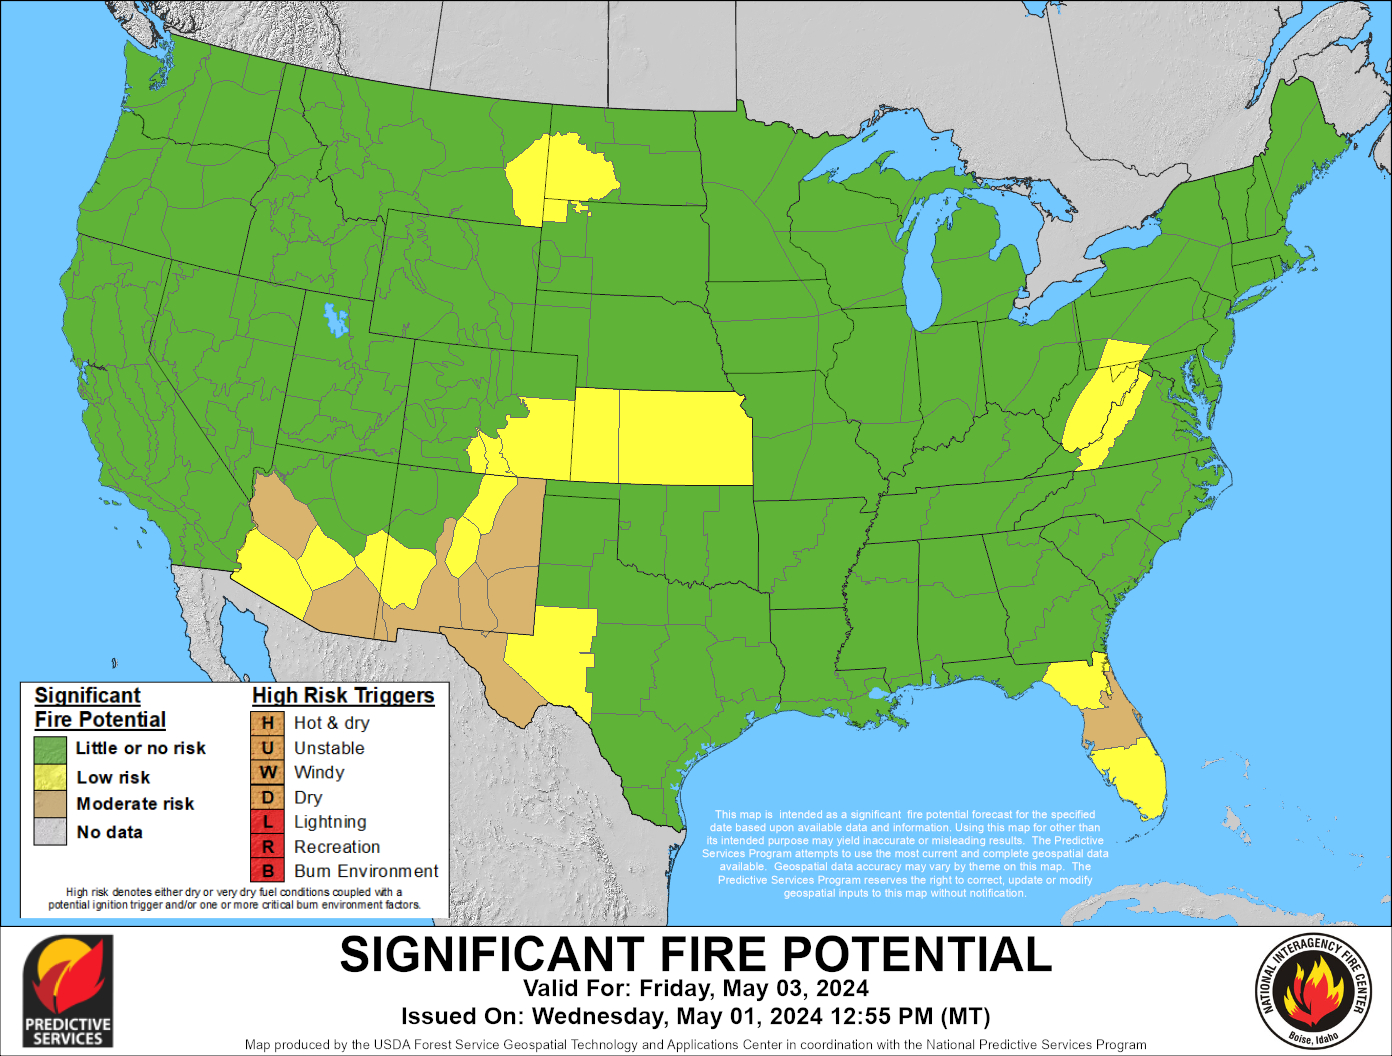
SPC Fire Weather Outlook Day 3 |
Max Mixing Hgt Forecast Day 3 |
 |
 |
 |
| Min RH Forecast Day 4 |
Max Gust Forecast Day 4 |
SPC Fire Weather Outlook Day 4 |
 |
 |
 |
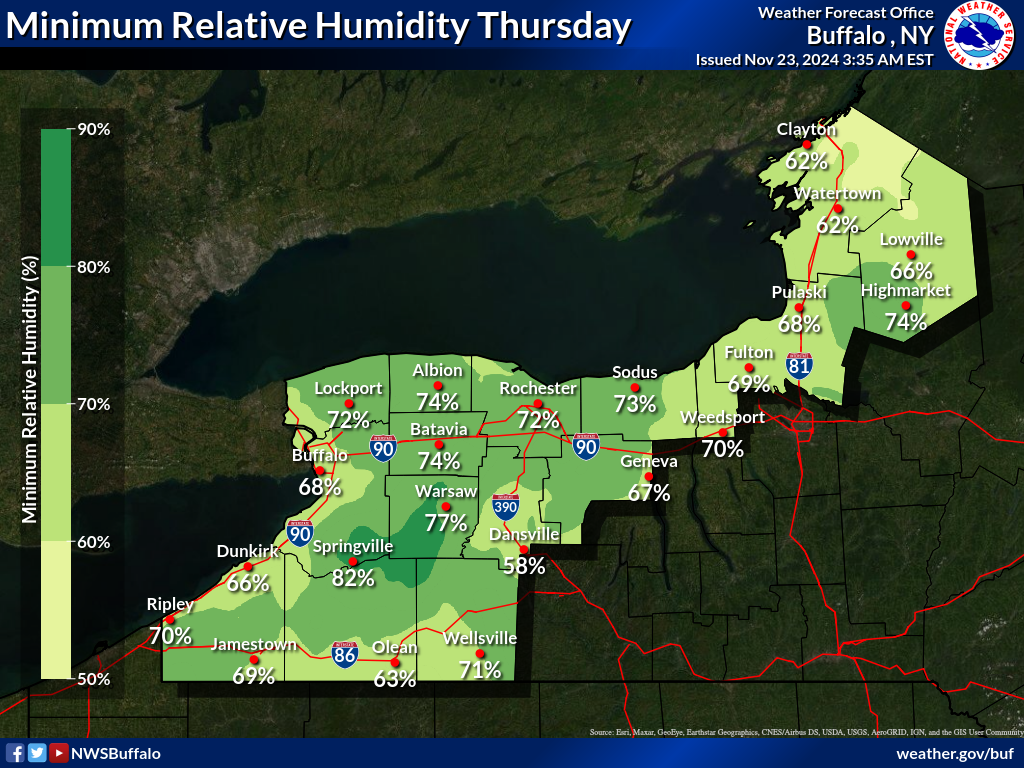
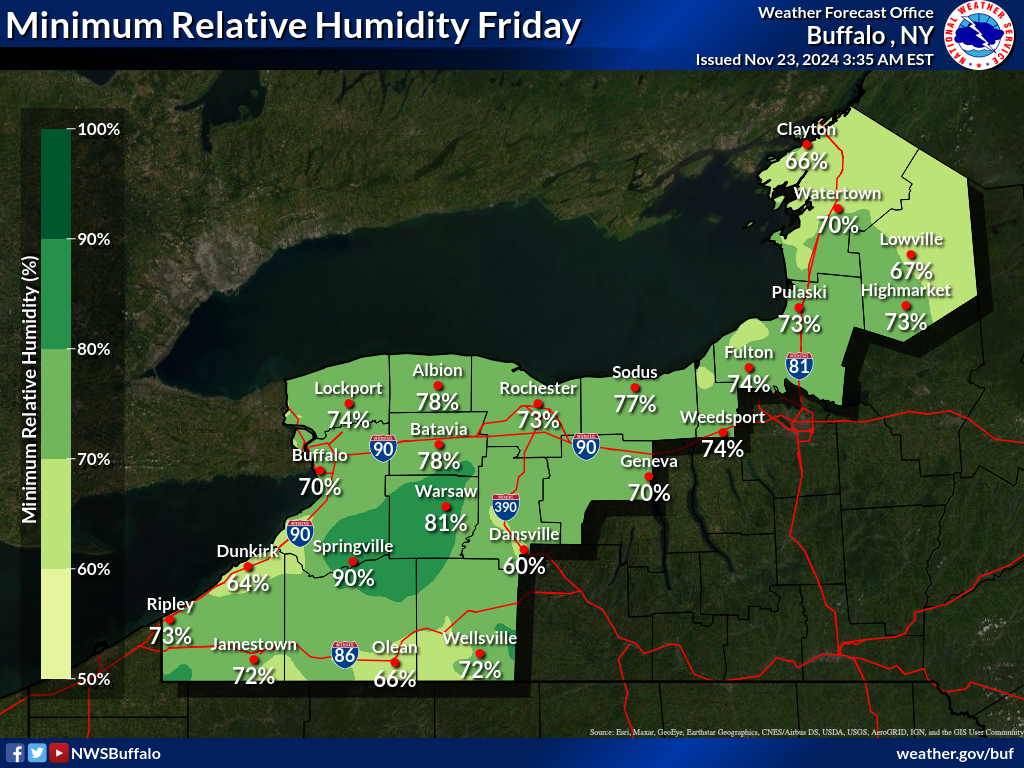
| Min RH Forecast Day 5 |
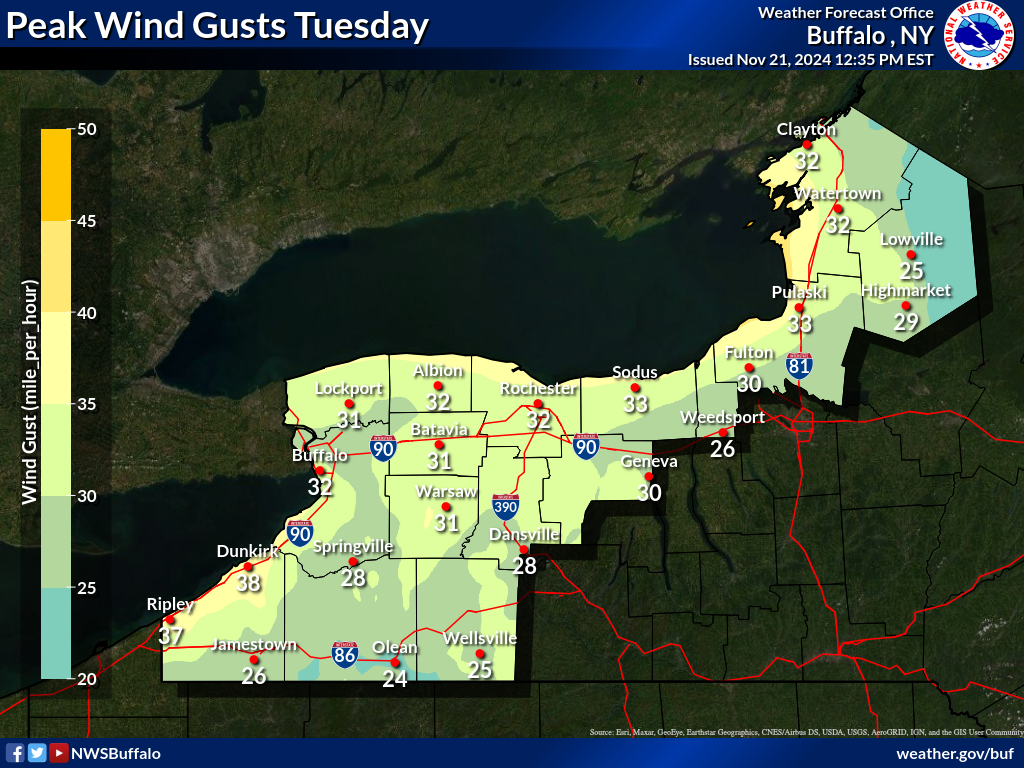
Max Gust Forecast Day 5 |
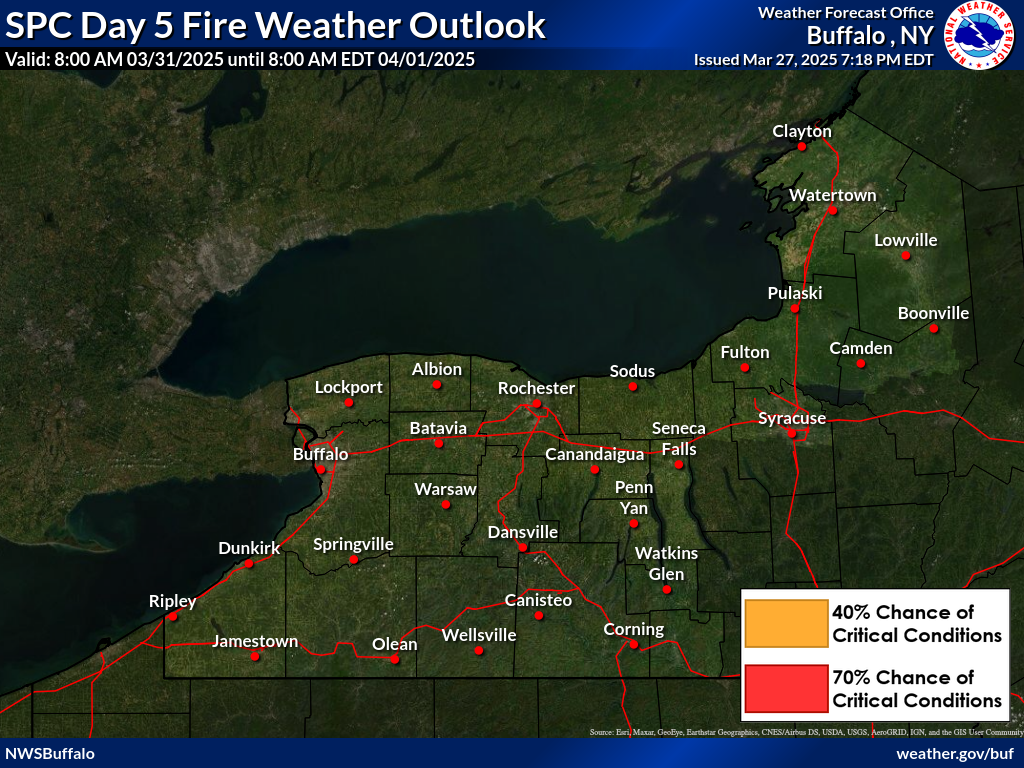
SPC Fire Weather Outlook Day 5 |
 |
 |
 |
| Min RH Forecast Day 6 |
Max Gust Forecast Day 6 |
SPC Fire Weather Outlook Day 6 |
 |
 |
 |
| Min RH Forecast Day 7 |
Max Gust Forecast Day 7 |
SPC Fire Weather Outlook Day 7 |
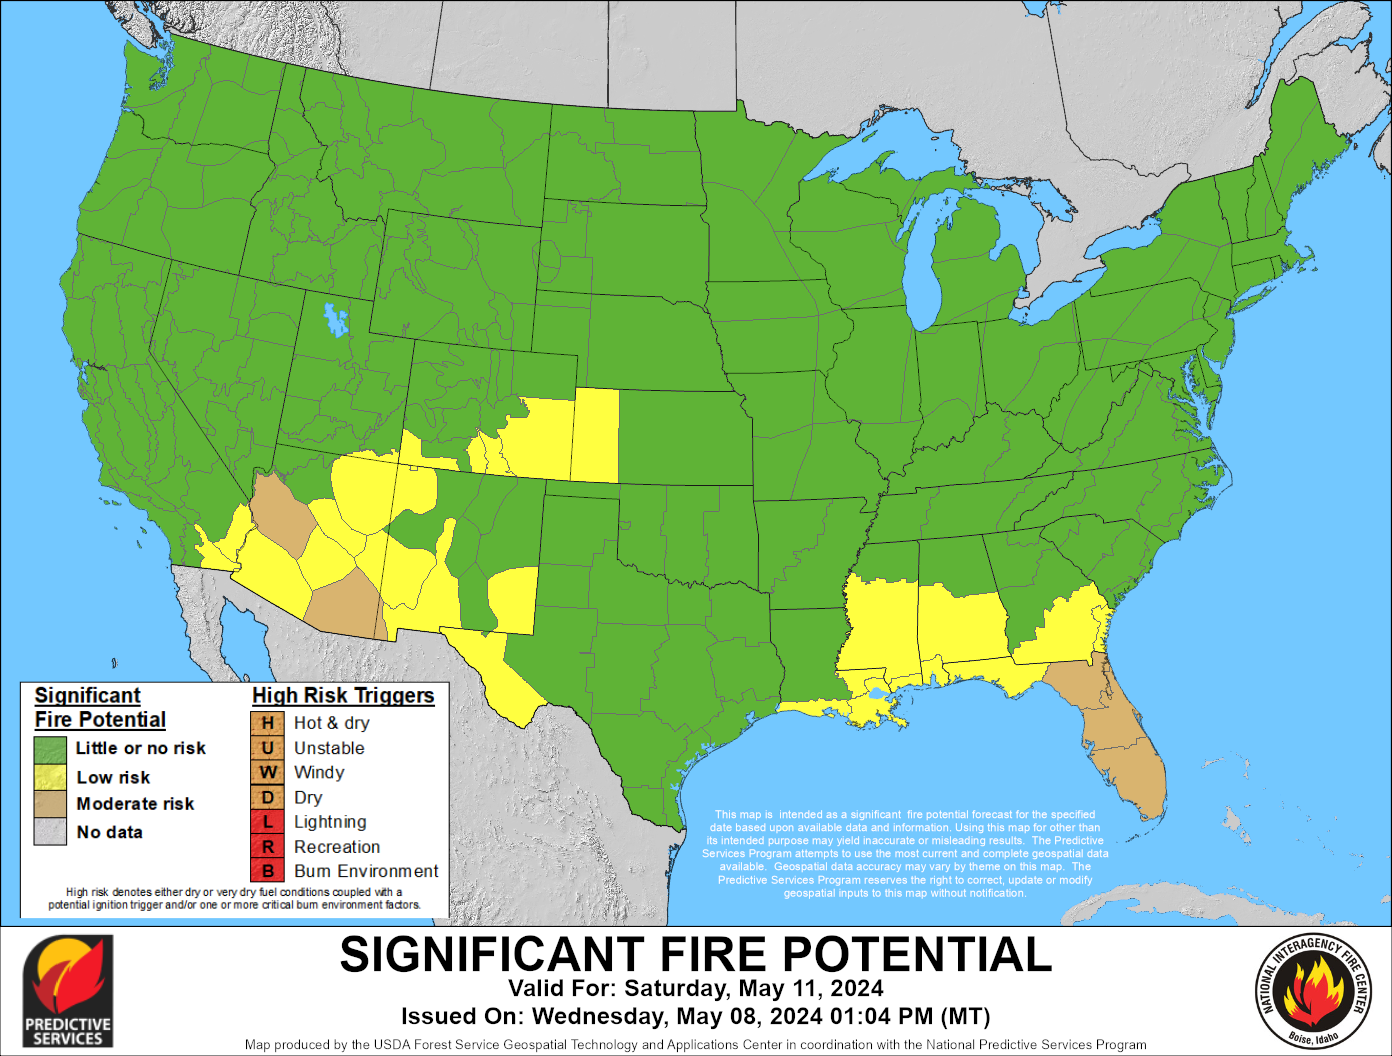
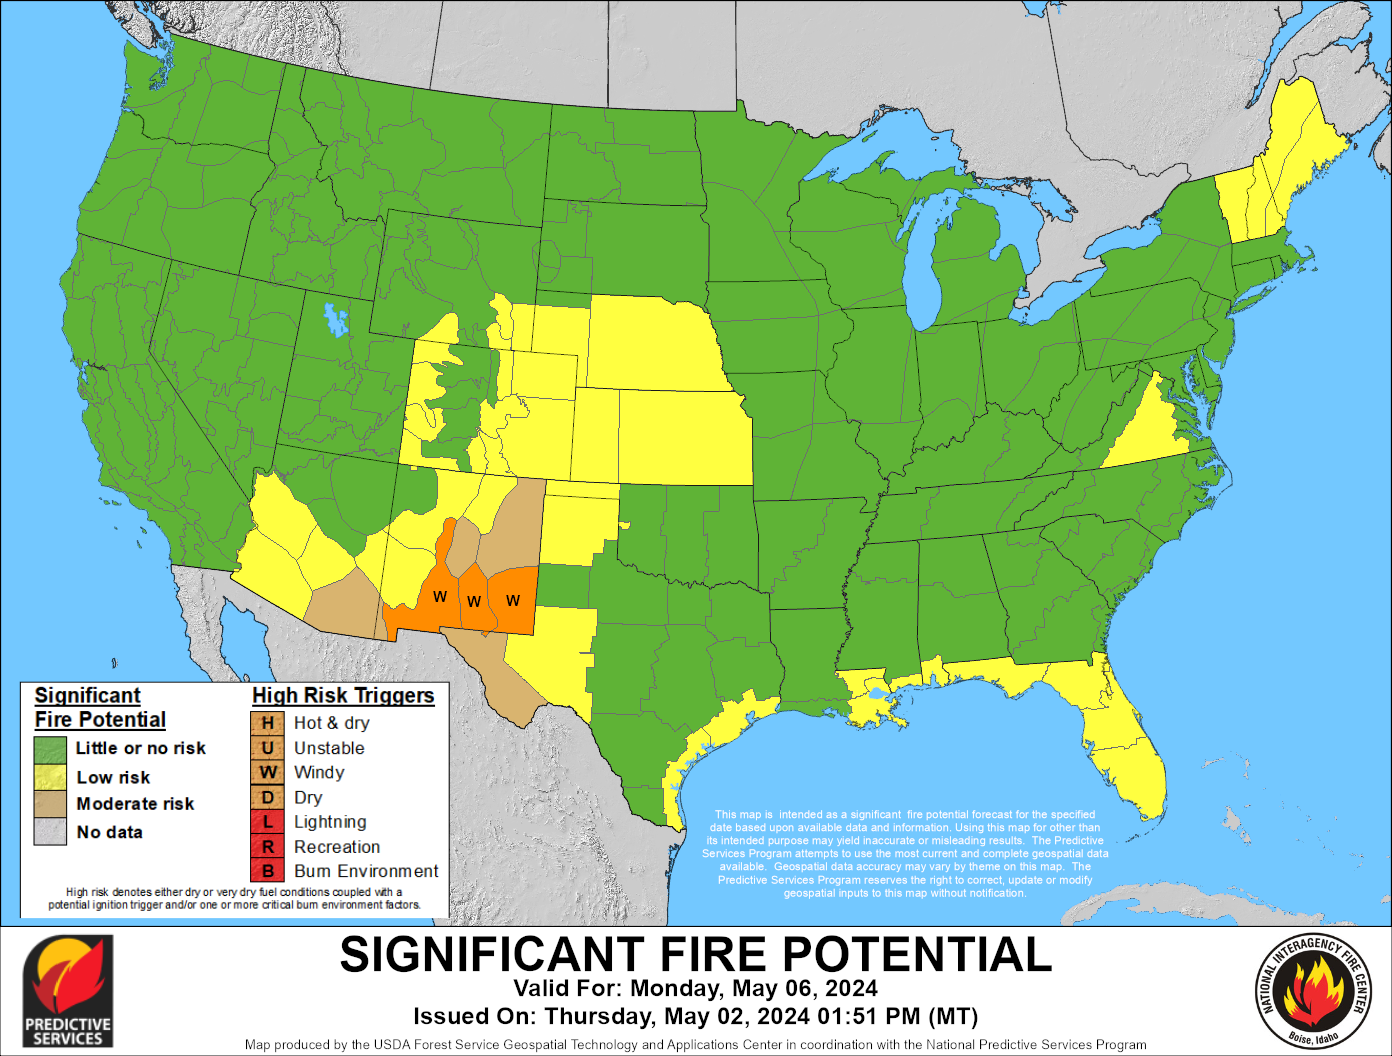
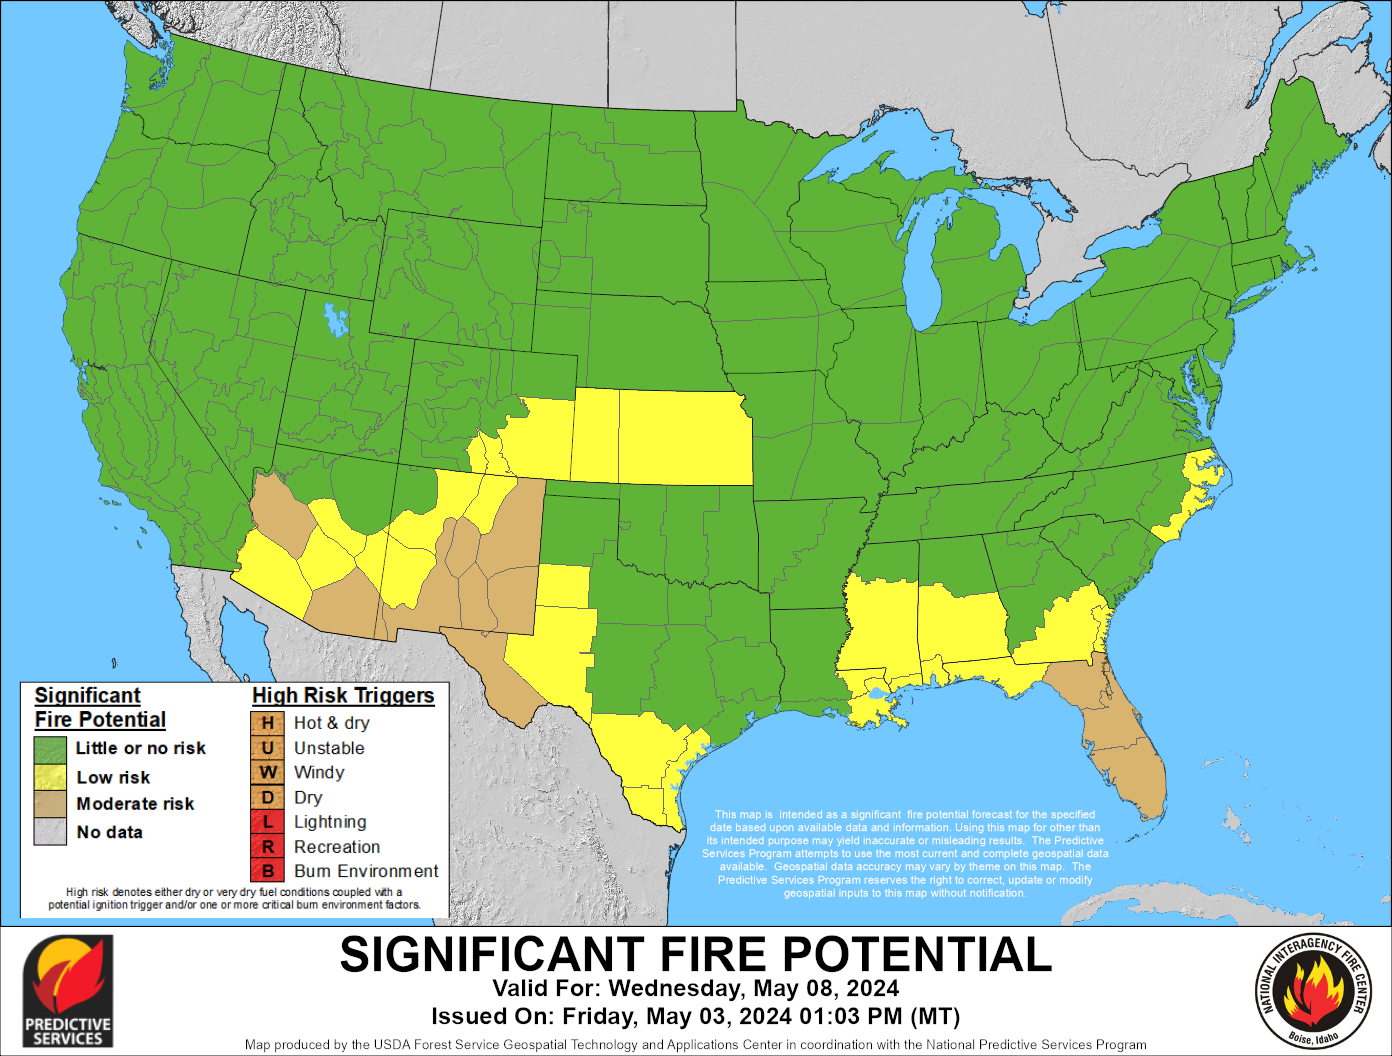
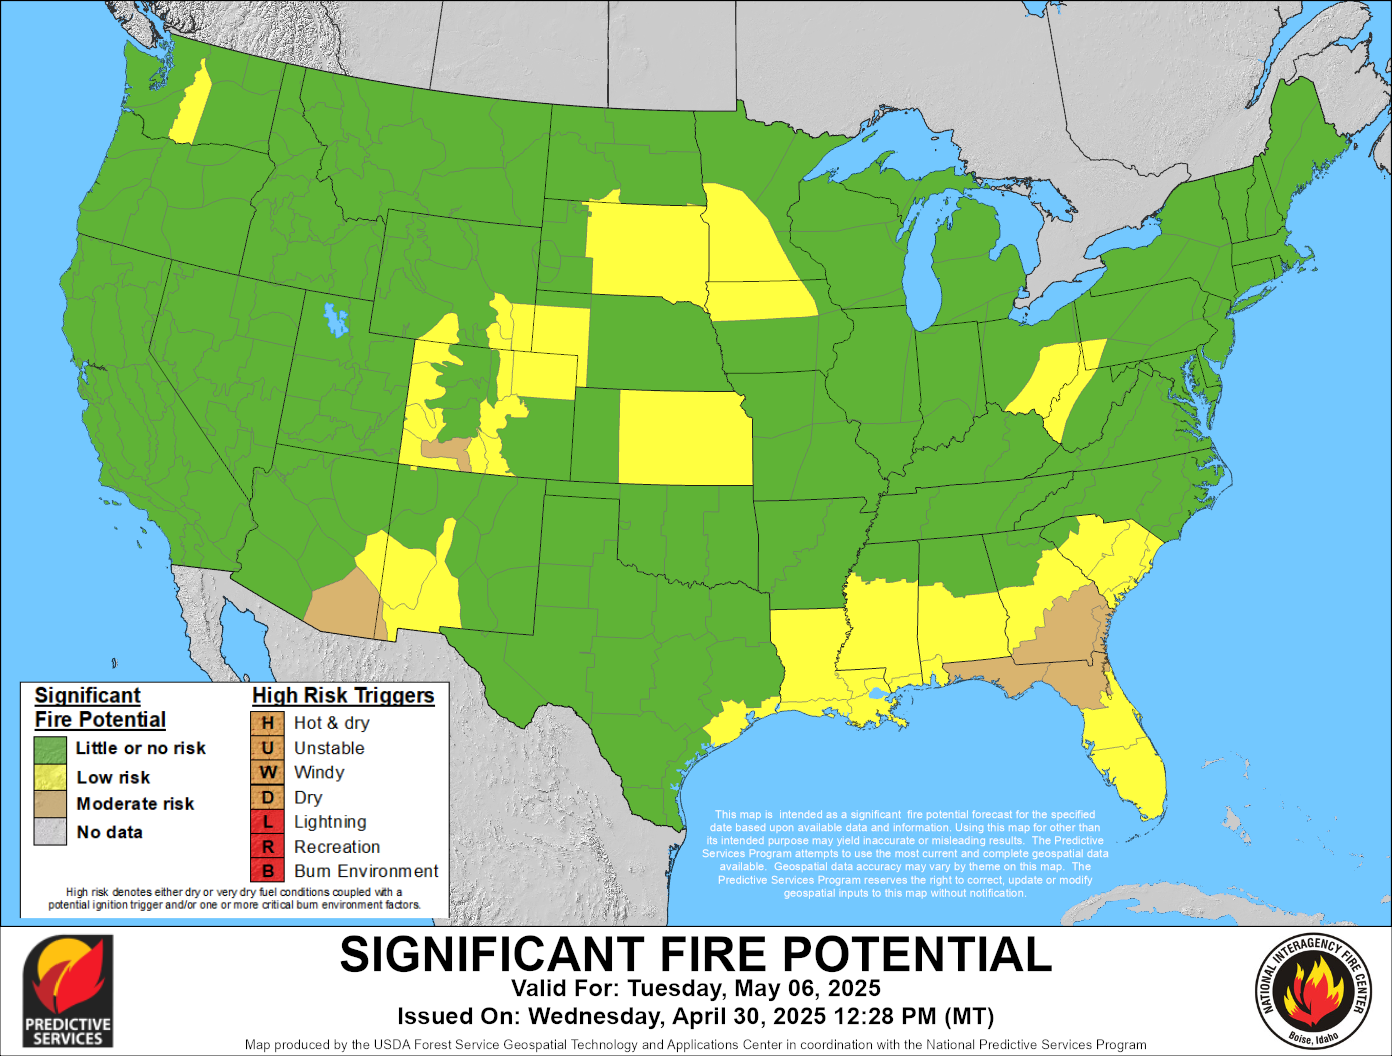
National 7-Day Significant Fire Potential
 |
 |
 |
| Day 1 Significant Fire Potential | Day 2 Significant Fire Potential | Day 3 Significant Fire Potential |
 |
 |
 |
 |
| Day 4 Significant Fire Potential | Day 5 Significant Fire Potential | Day 6 Significant Fire Potential | Day 7 Significant Fire Potential |
These products are updated each weekday, usually by mid-afternoon Mountain time.
Explanation of the 7-Day Significant Fire Potential
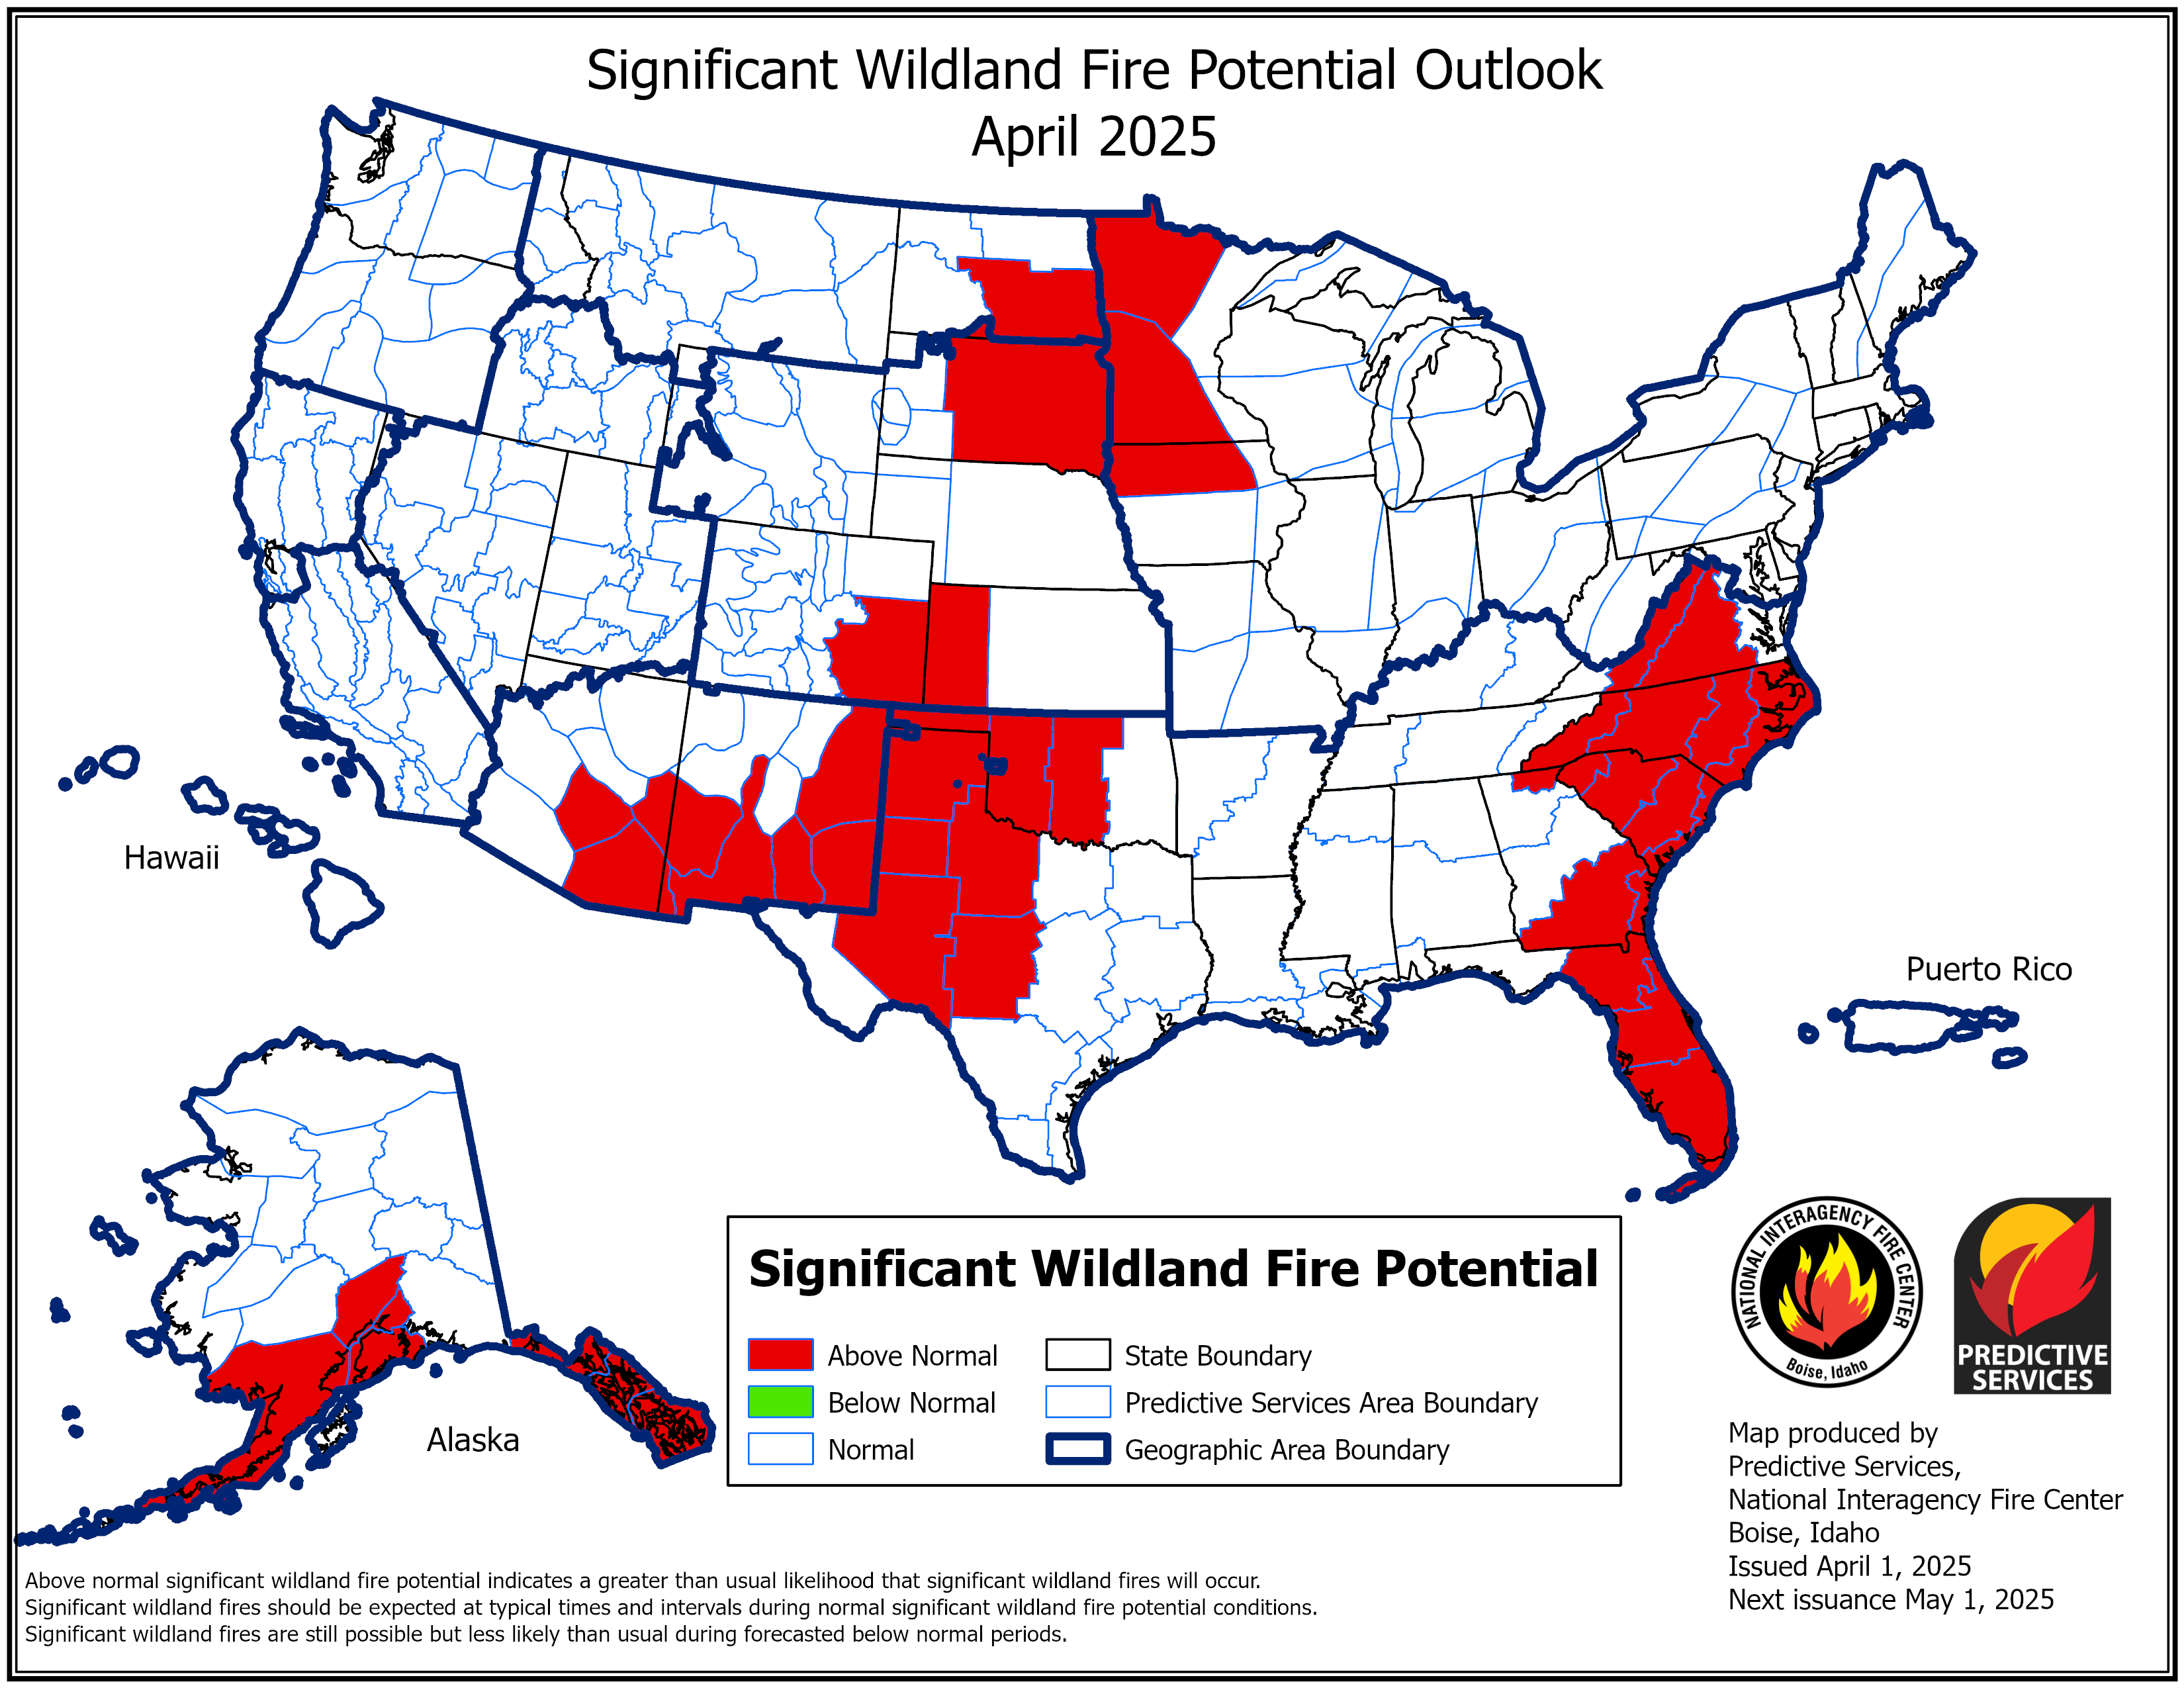
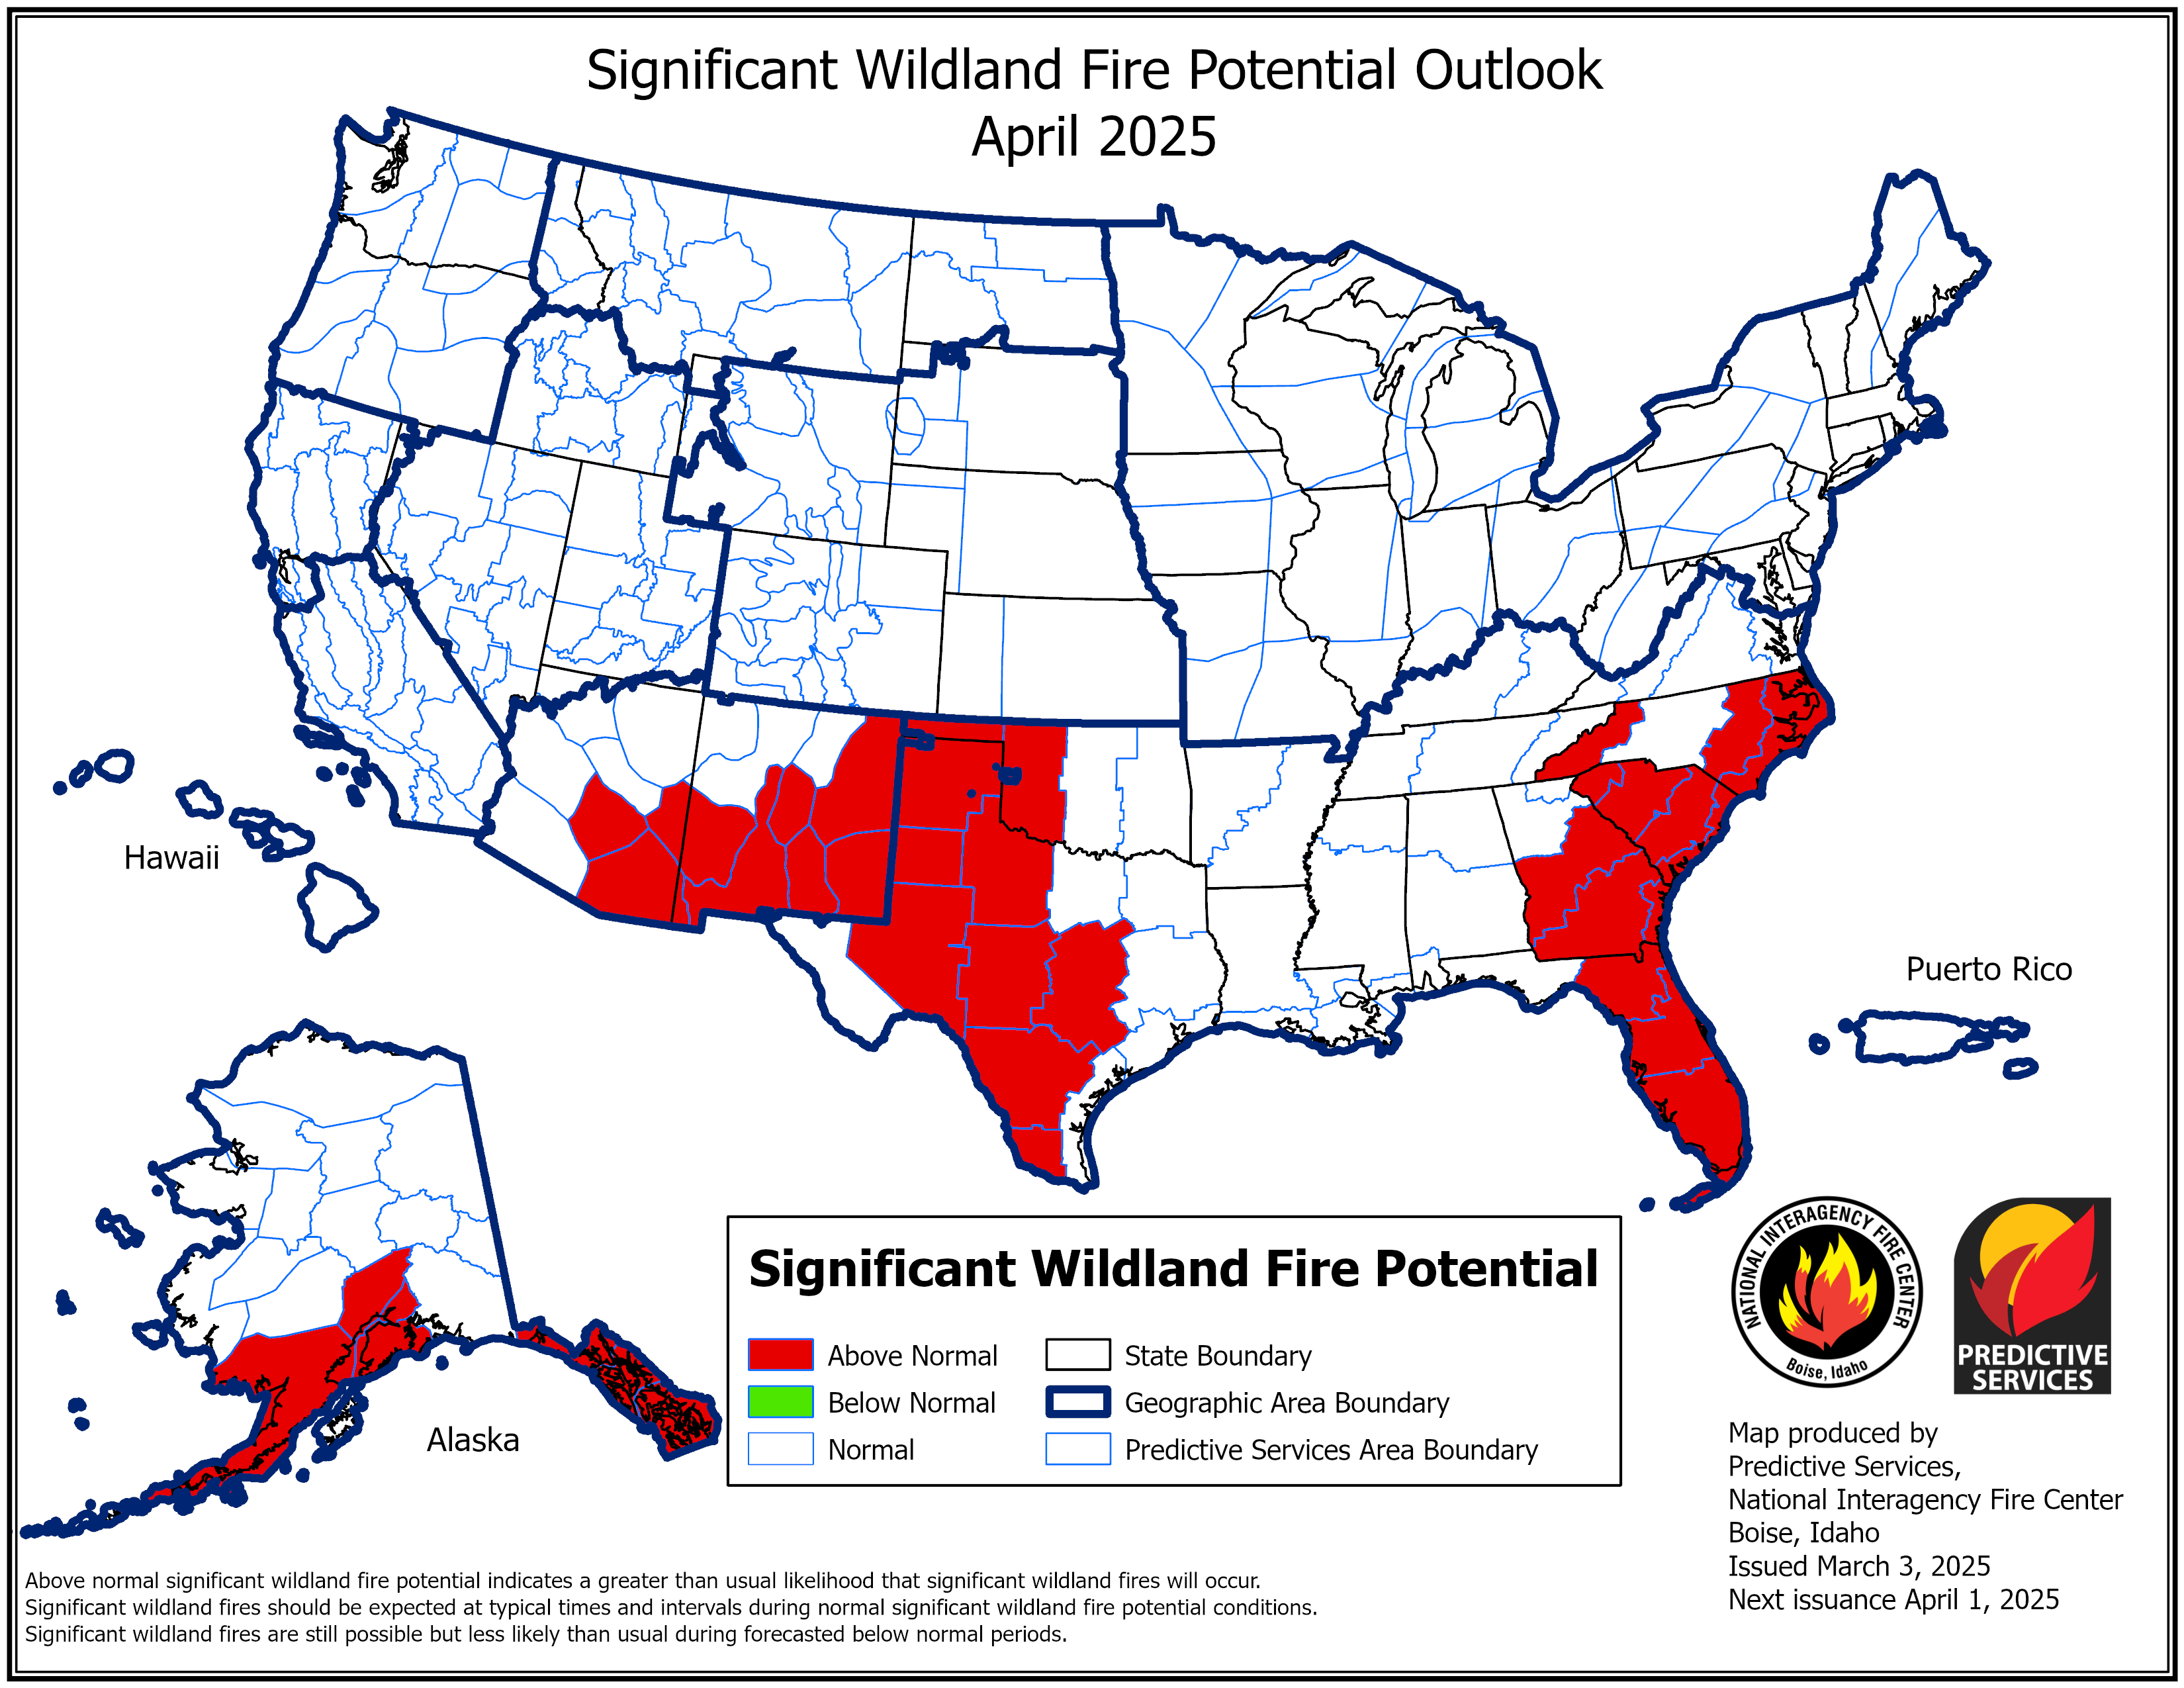
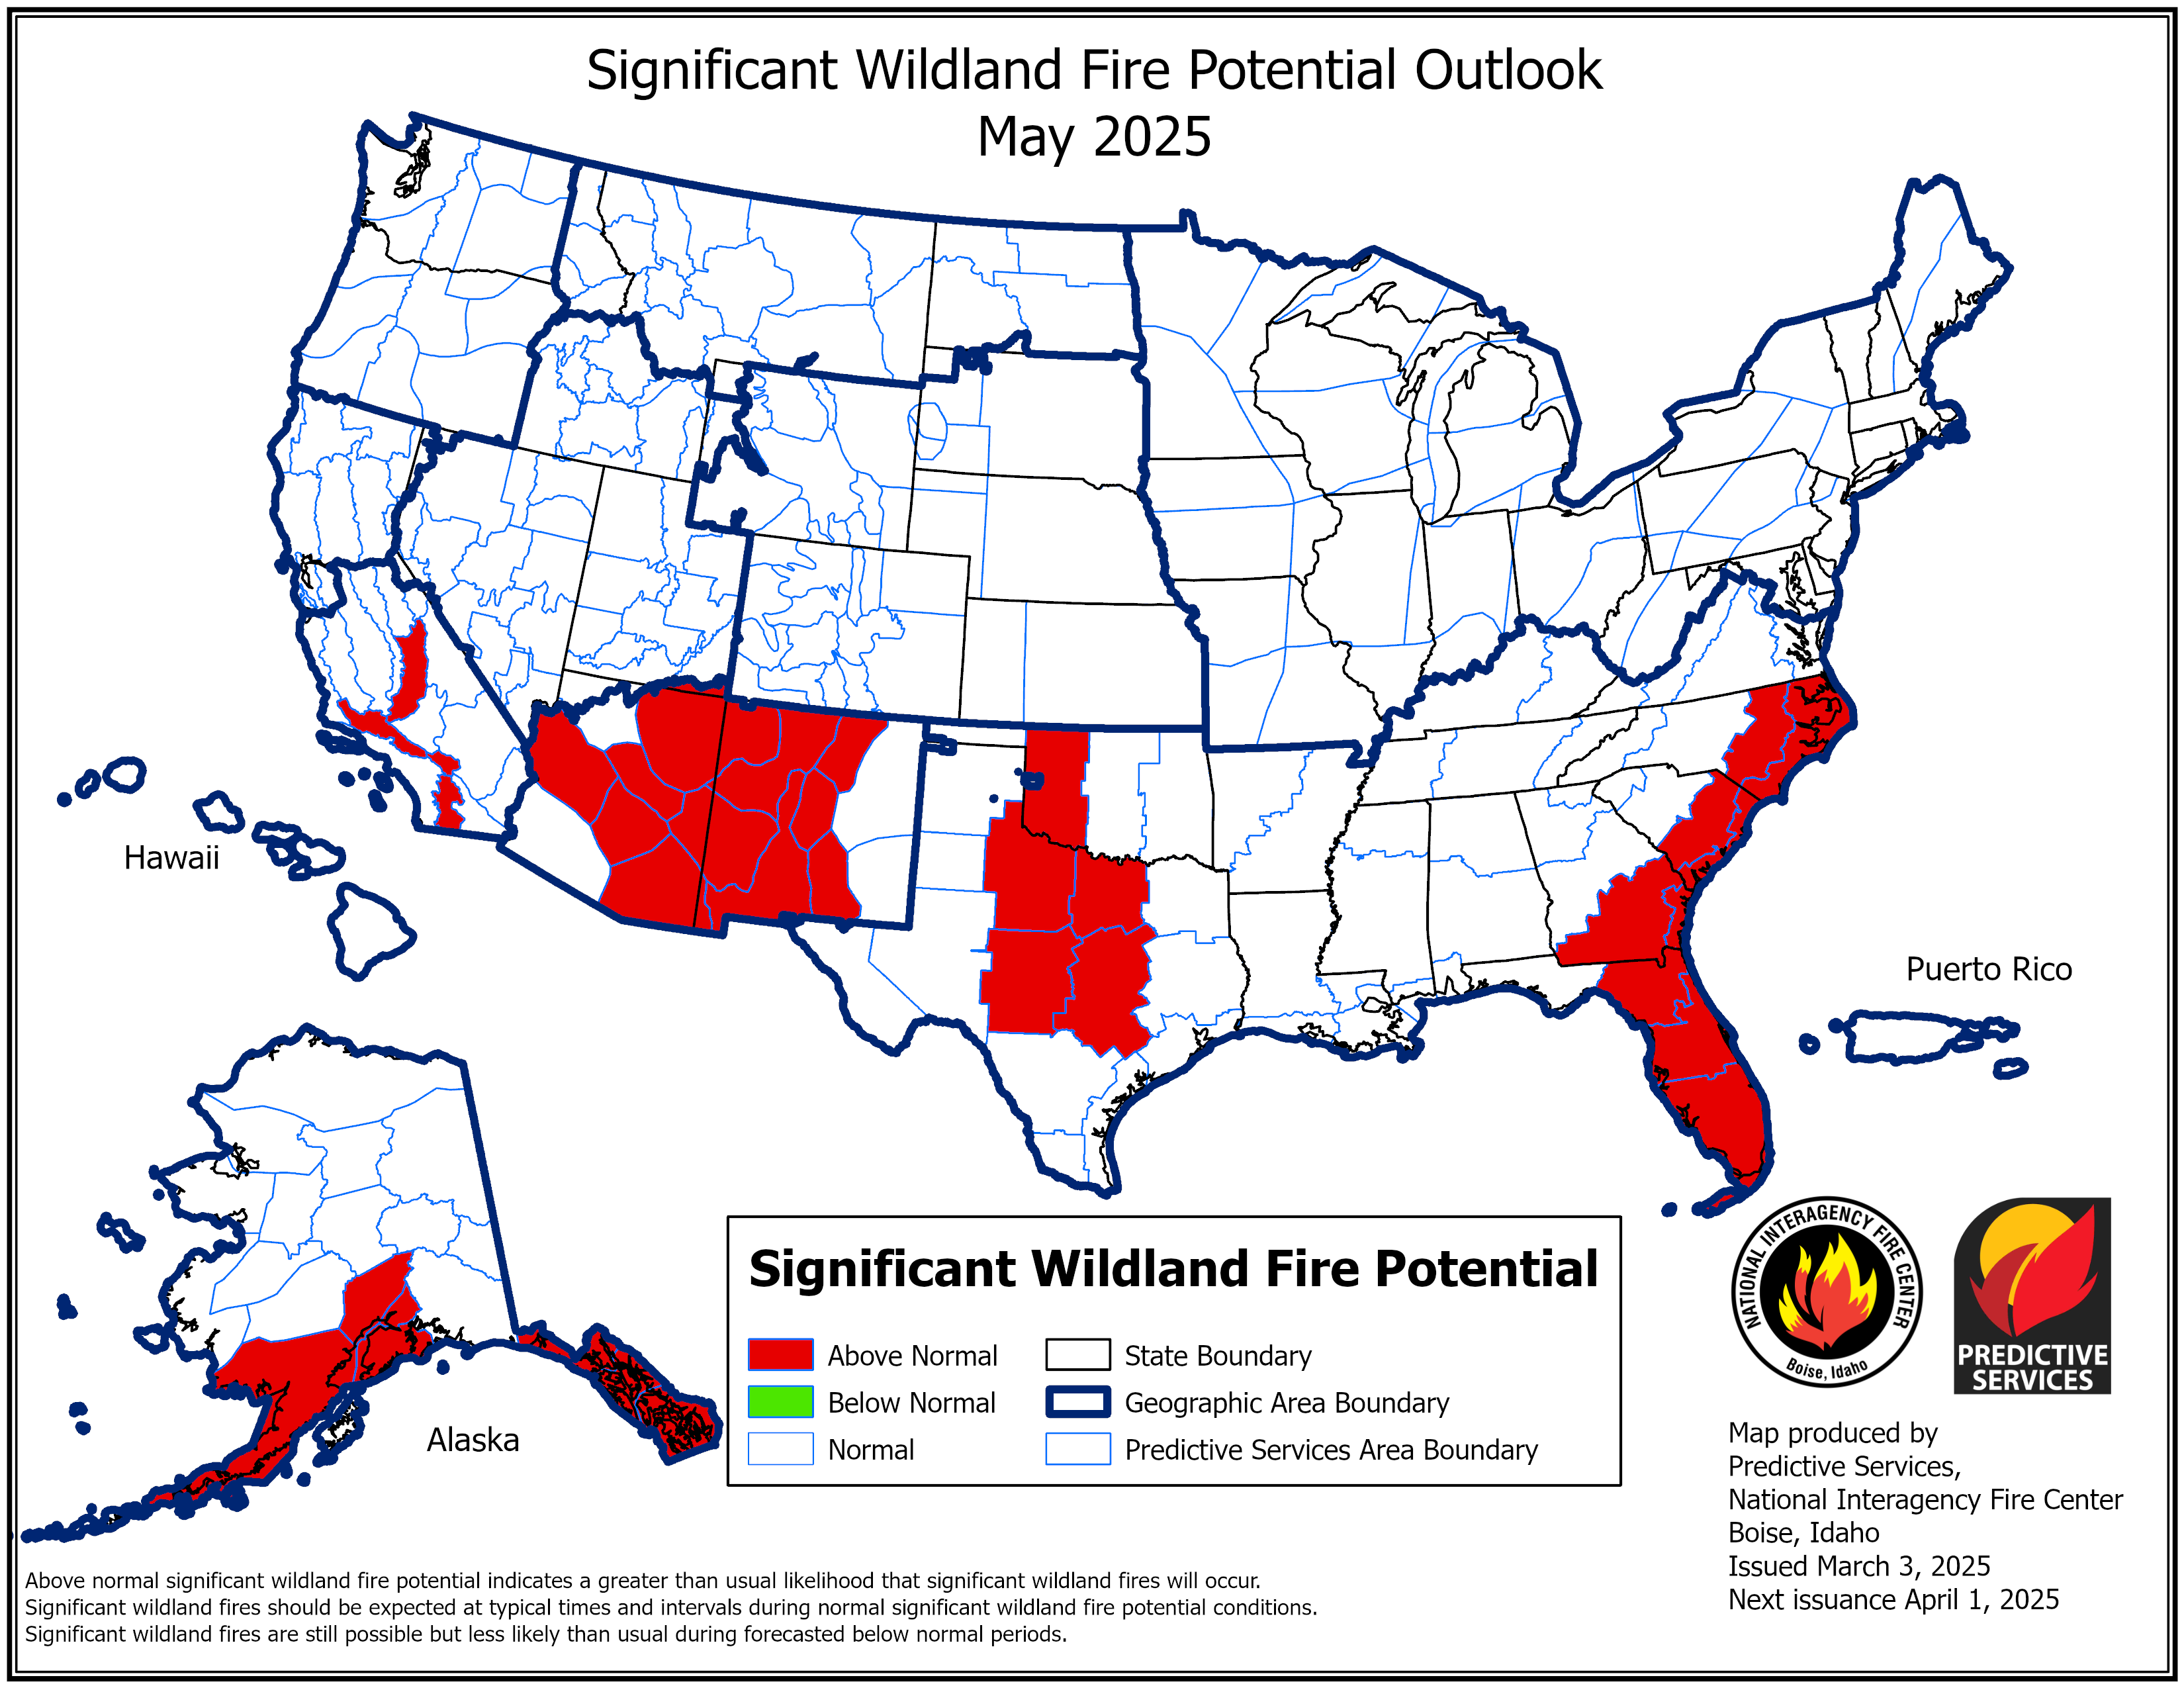
National Significant Wildlife Fire Potential Outlooks
 |
 |
 |
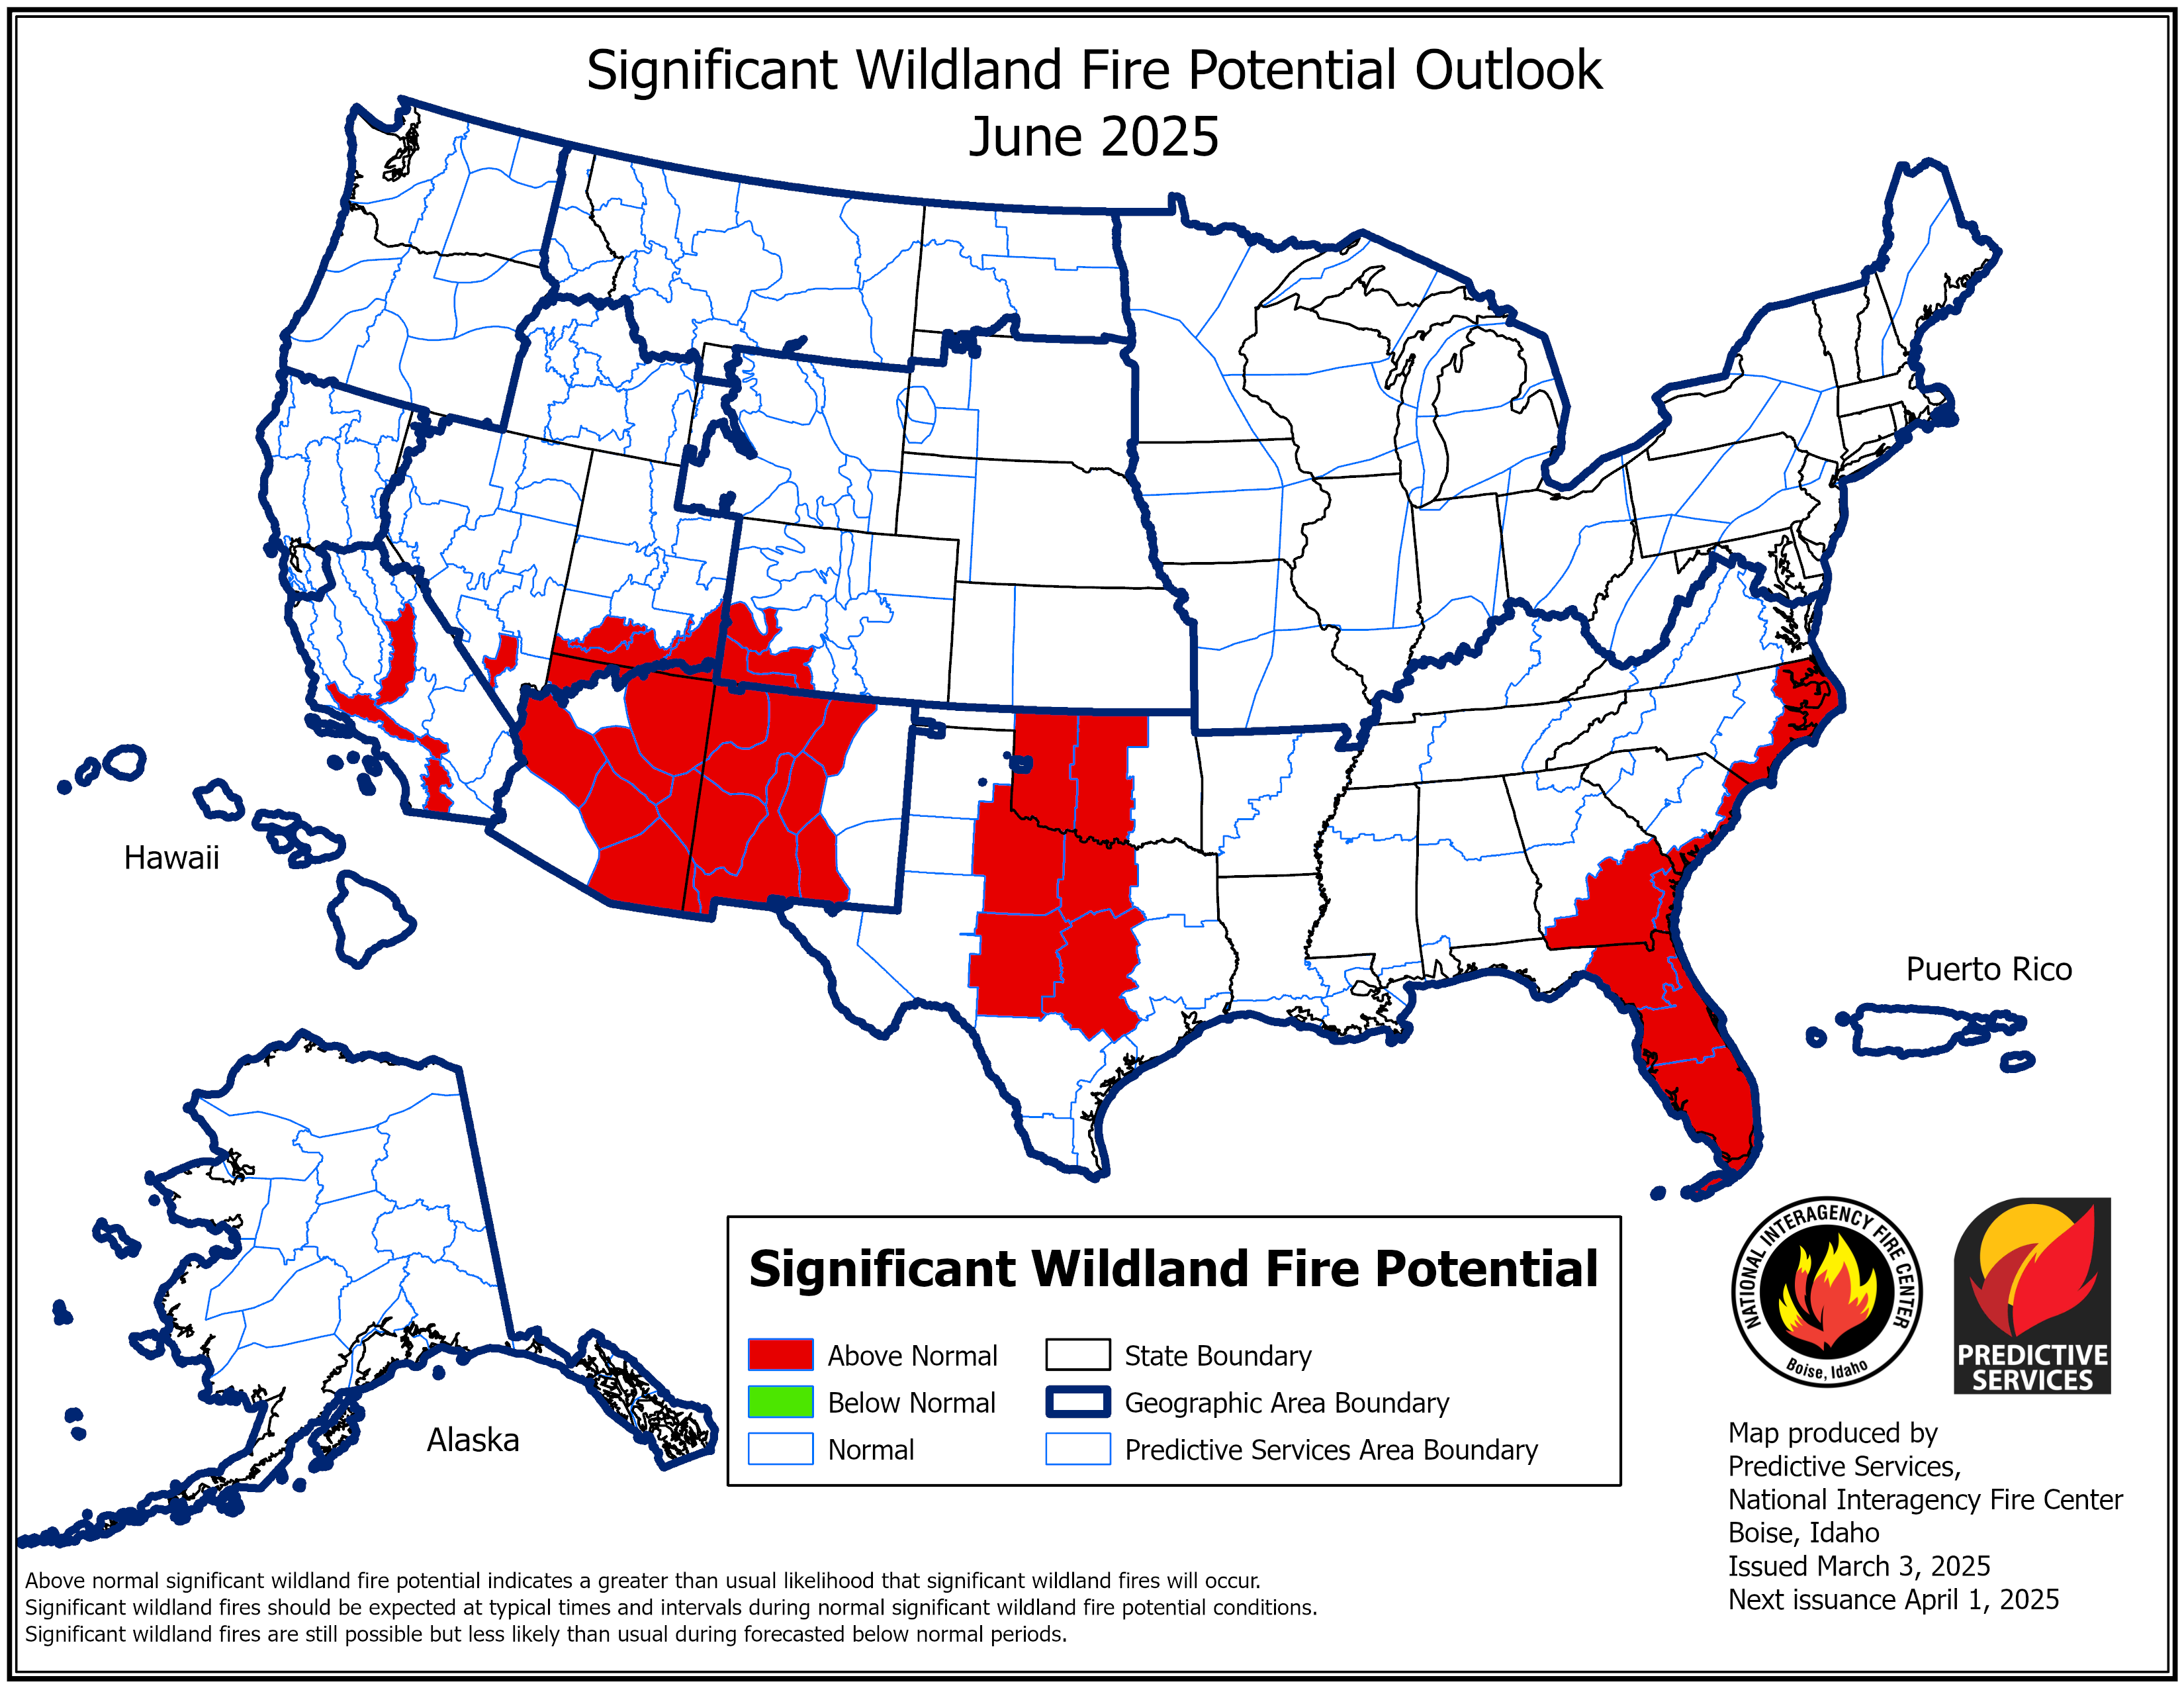 |
| Current Month Outlook | Next Month Outlook | Month 3 Outlook | Month 4 Outlook |
|
Fire Weather Watch / Red Flag Warning Fire Weather Products & Services Guide (PDF) - 2026 Fire Weather Annual Operating Plan (PDF) - 2026 |
Local NFDRS Forecasts 301101 = Iroquois NWR
|
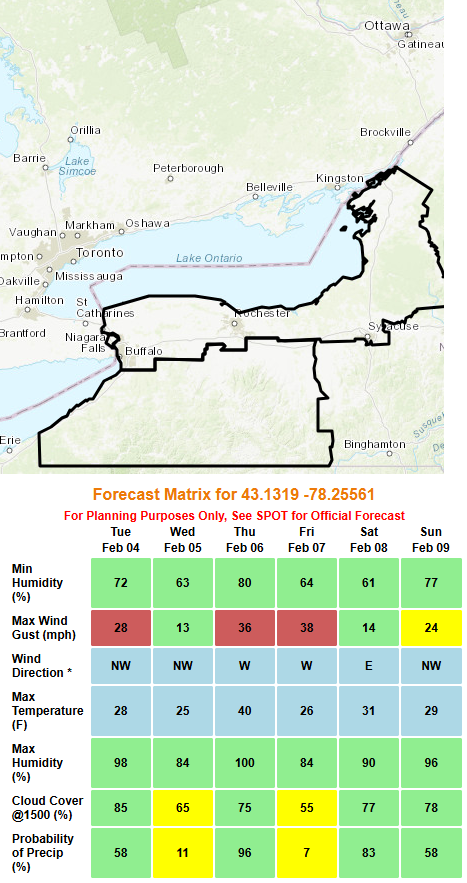
Fire Weather Matrix - Experimental |
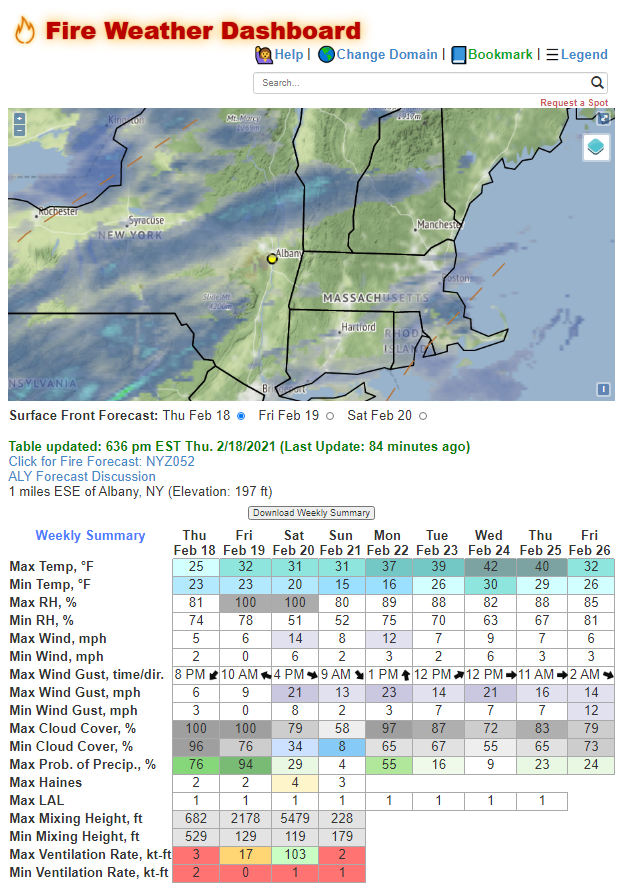
Fire Weather Dashboard (Iroquois) |
Fire Weather Dashboard (Lowville) |
 |
 |
|
| Planning forecast with color-coded thresholds | Point and click fire weather forecast - mobile friendly |
 |
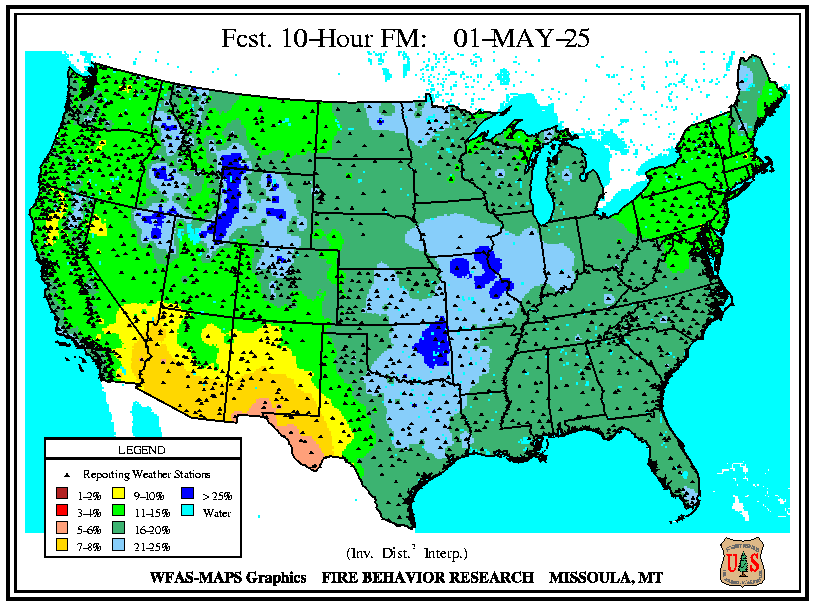 |
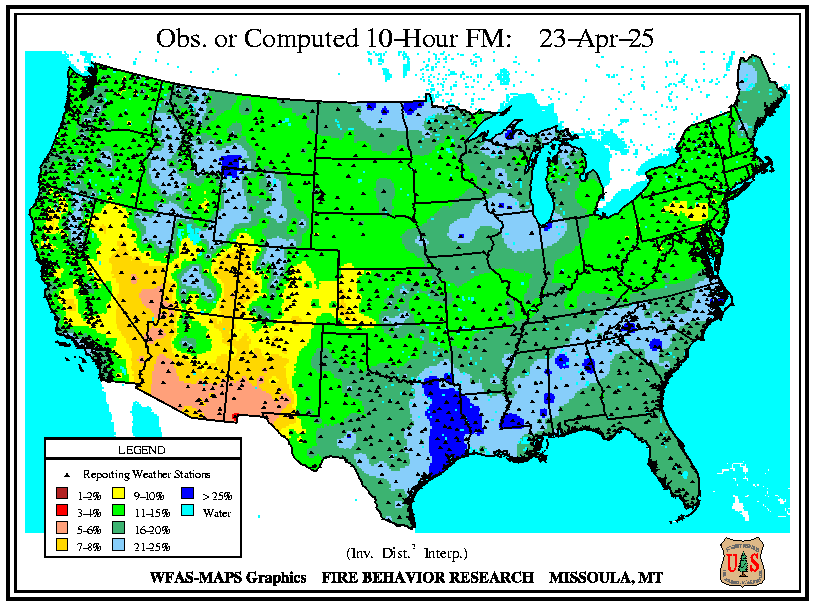
| 10-hour fuel moisture - observed | 10-hour fuel moisture - forecast |
 |
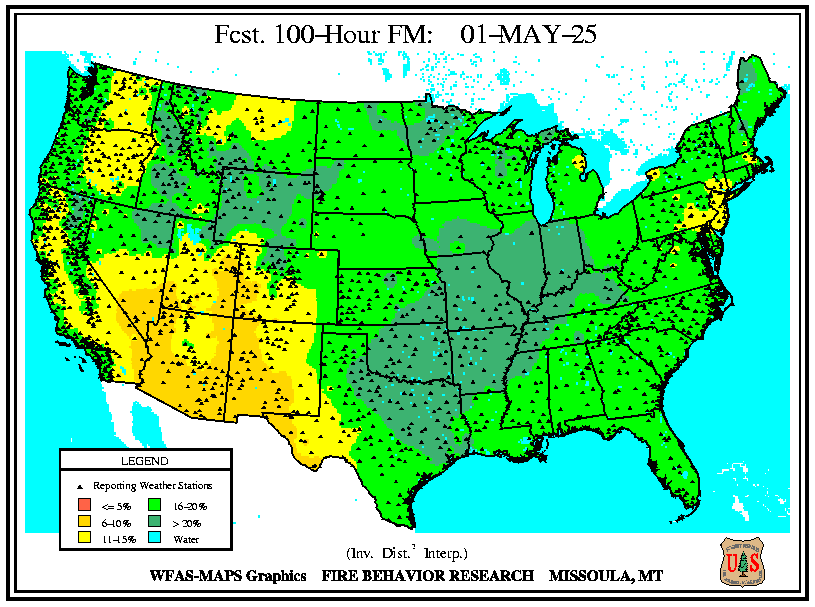 |
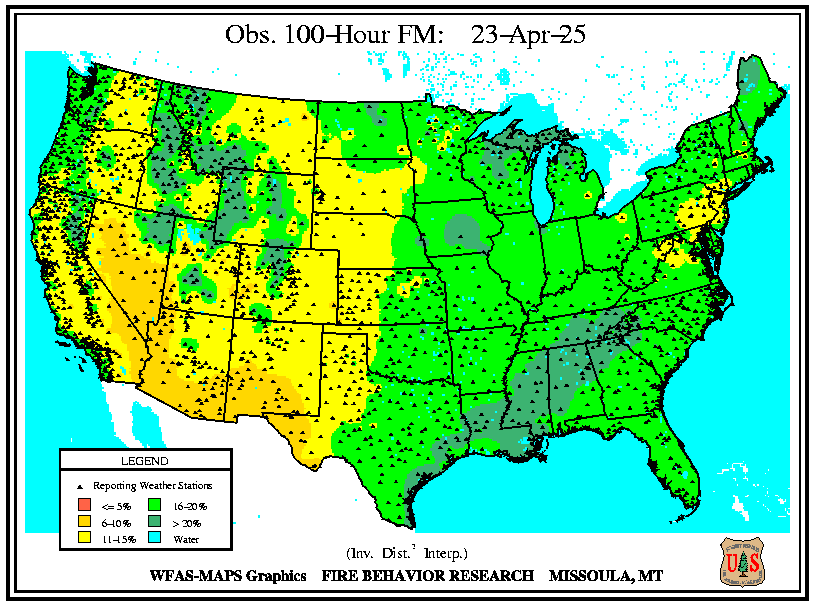
| 100-hour fuel moisture - observed | 100-hour fuel moisture - forecast |
 |
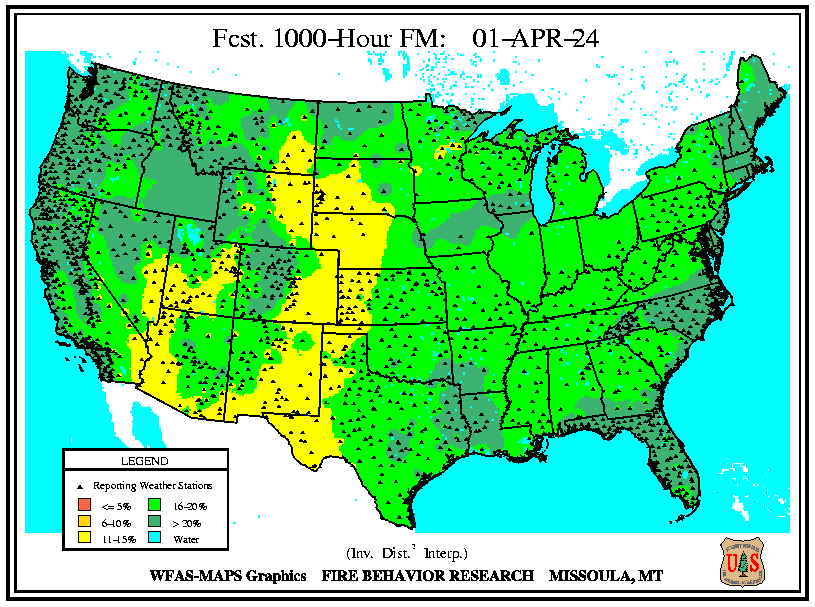 |
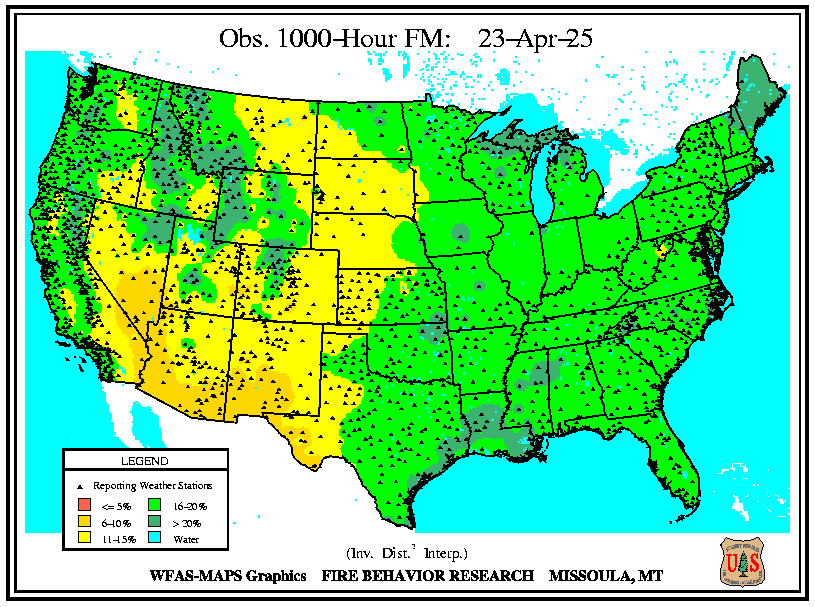
| 1000-hour fuel moisture - observed | 1000-hour fuel moisture - forecast |
 |
 |
 |
| Drought Monitor - Northeast Interactive Map |
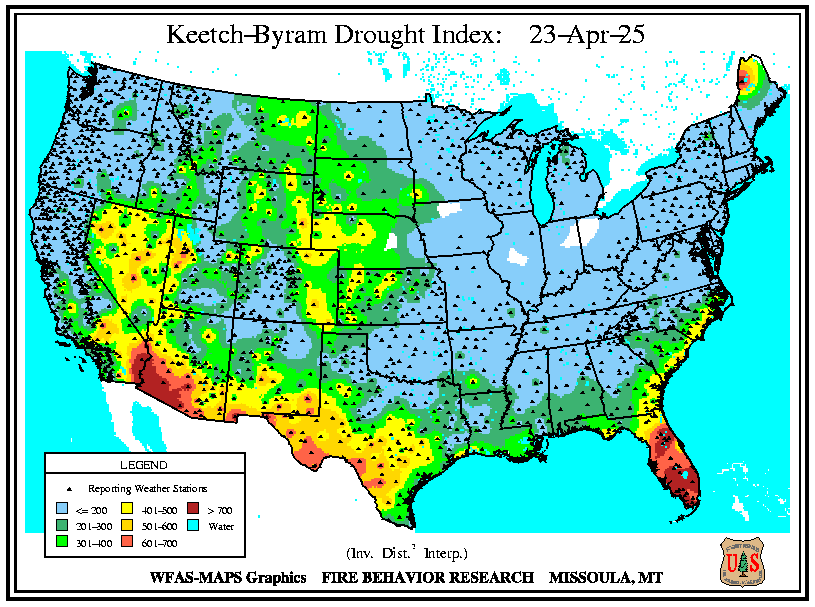
Monthly Drought Outlook | Keetch-Byram Drought Index |
 |
 |
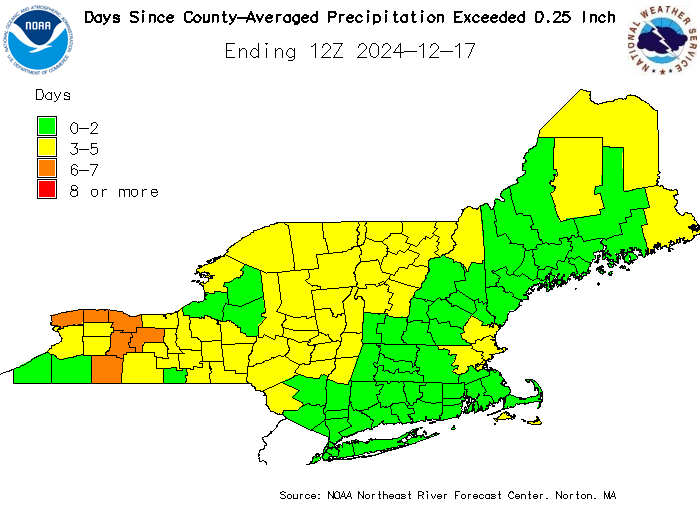 |
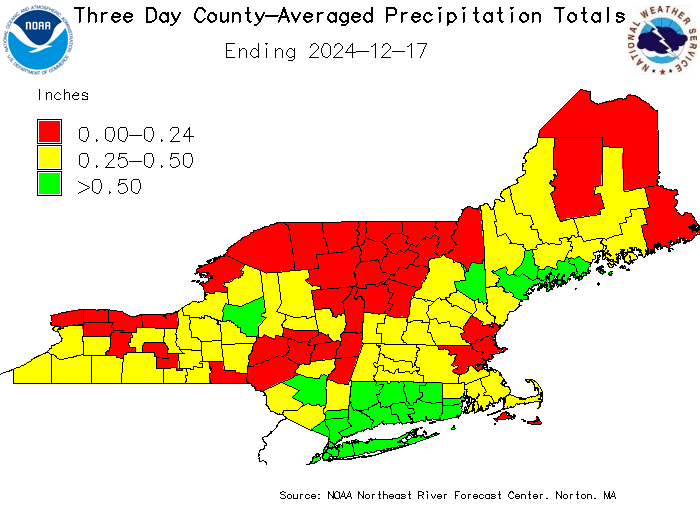
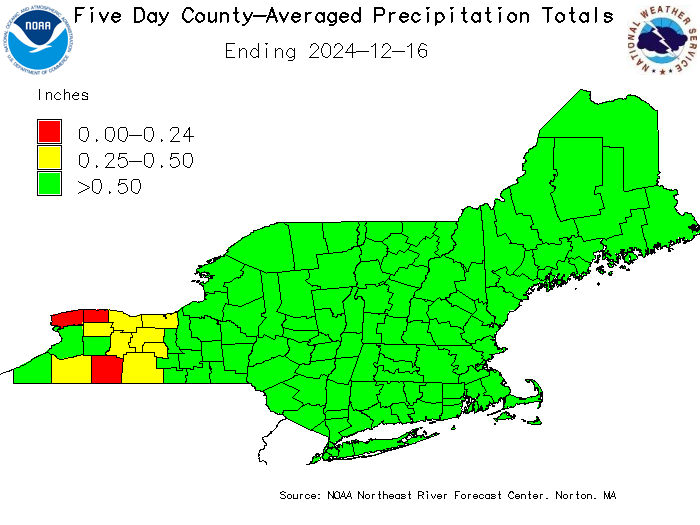
| Three-day Observed Precipitation Totals | Five-day Observed Precipitation Totals | Days Since 0.25" Precipitation |
 |
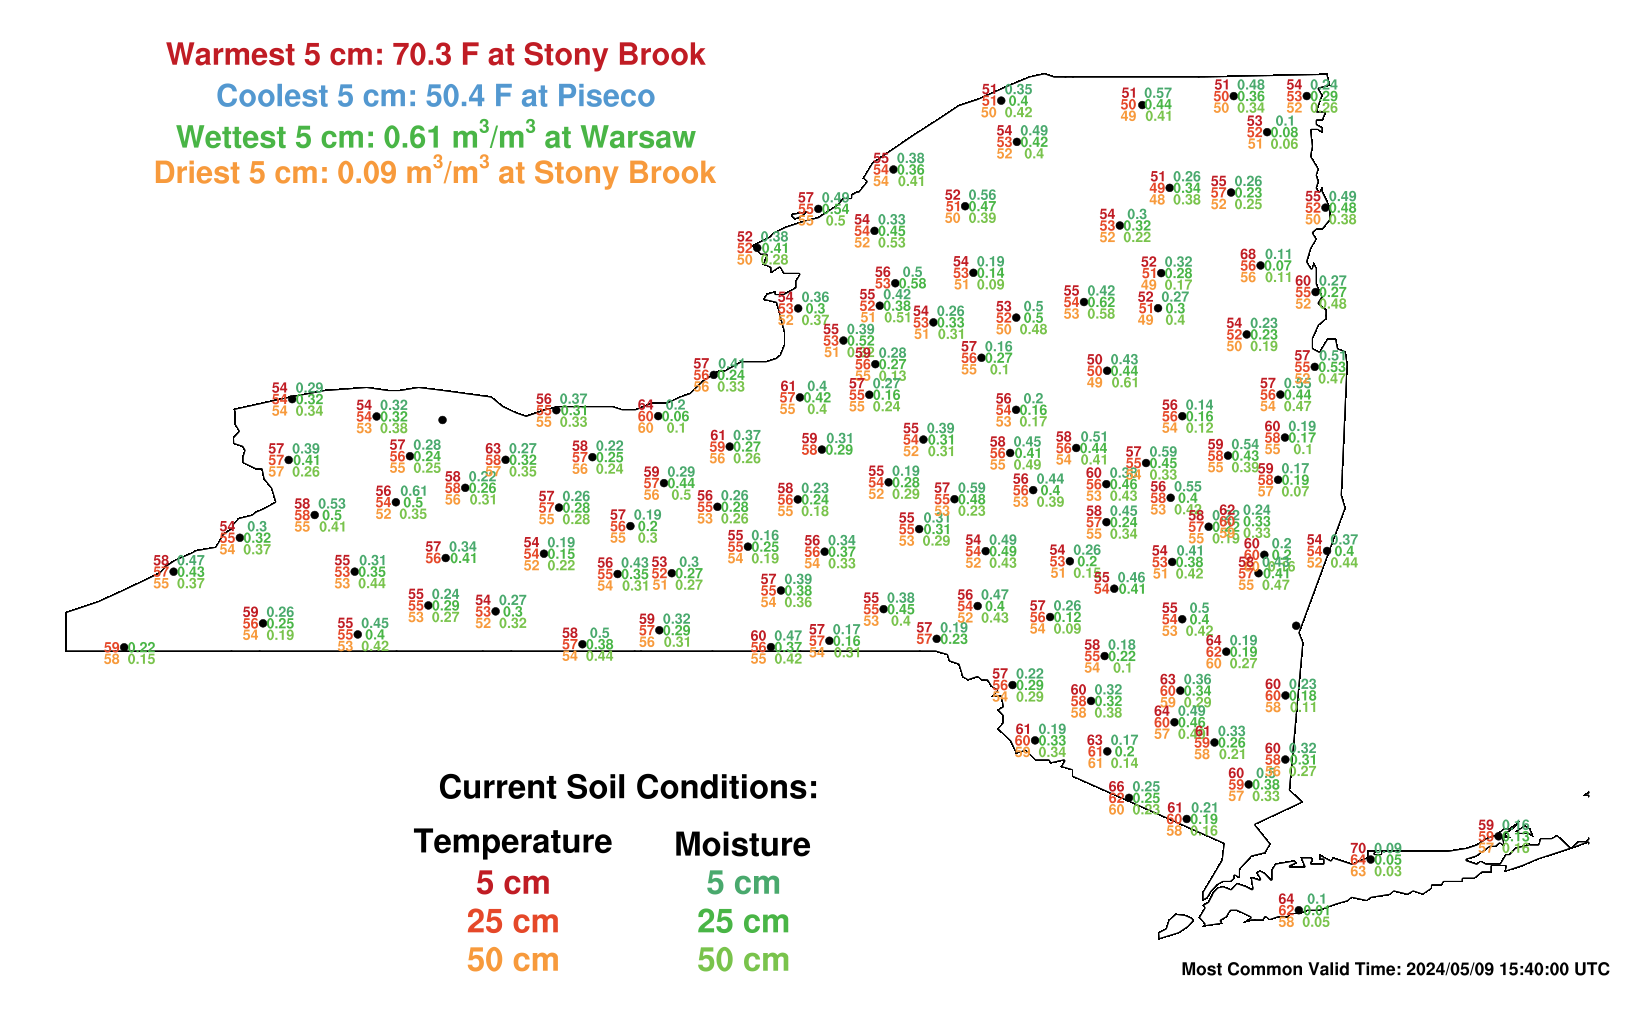 |
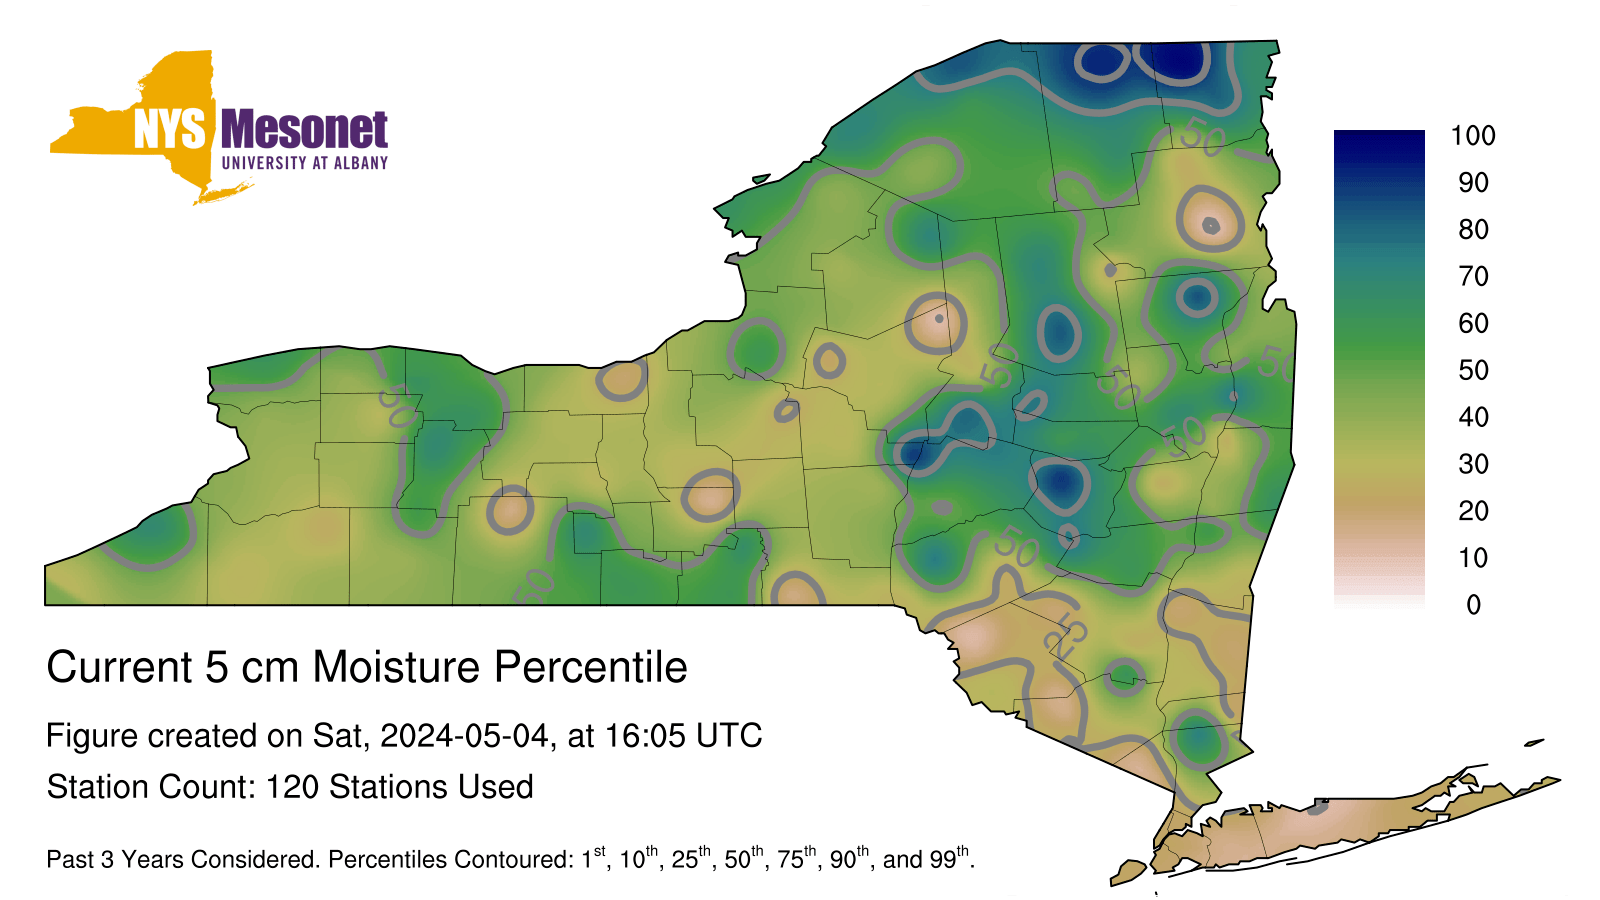
| New York State Mesonet 5cm Soil Moisture Percentiles | New York State Mesonet Current Soil Conditions |
|
Snow Depth Resources |
Observed Precipitation Resources |
 |
 |
| 6-10 Day Temperature Probability Interactive Map |
6-10 Day Precipitation Probability Interactive Map |
 |
 |
| 8-14 Day Temperature Probability Interactive Map |
8-14 Day Precipitation Probability Interactive Map |
 |
 |
| Week 3-4 Temperature Probability | Week 3-4 Precipitation Probability |
 |
 |
| One-Month Temperature Probability Interactive Map |
One-Month Precipitation Probability Interactive Map |
 |
 |
| Three-Month Temperature Probability Interactive Map |
Three-Month Precipitation Probability Interactive Map |
|
|
 |
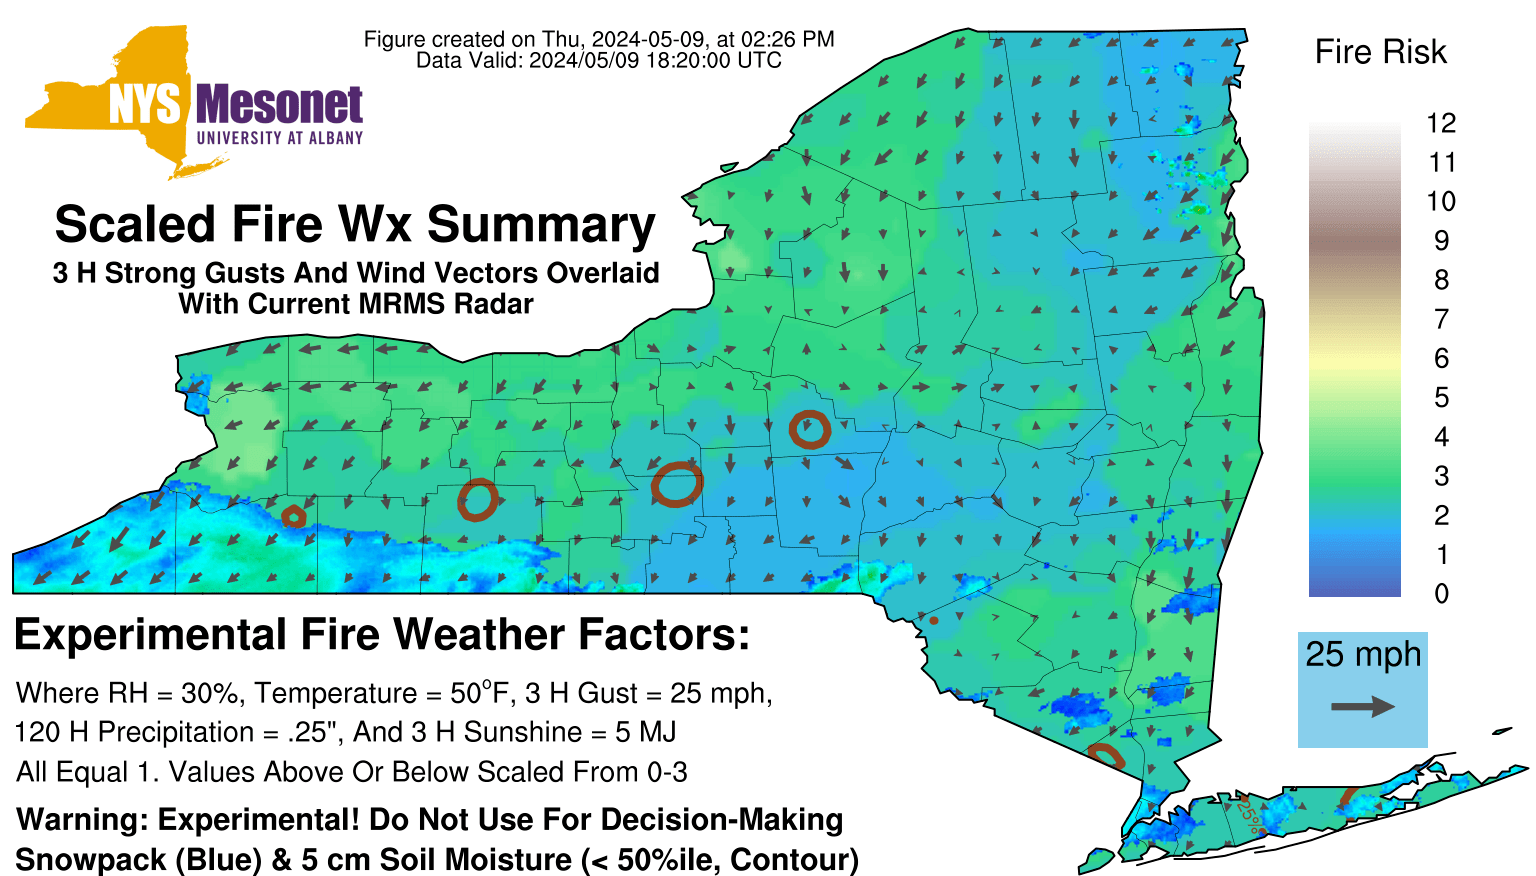 |
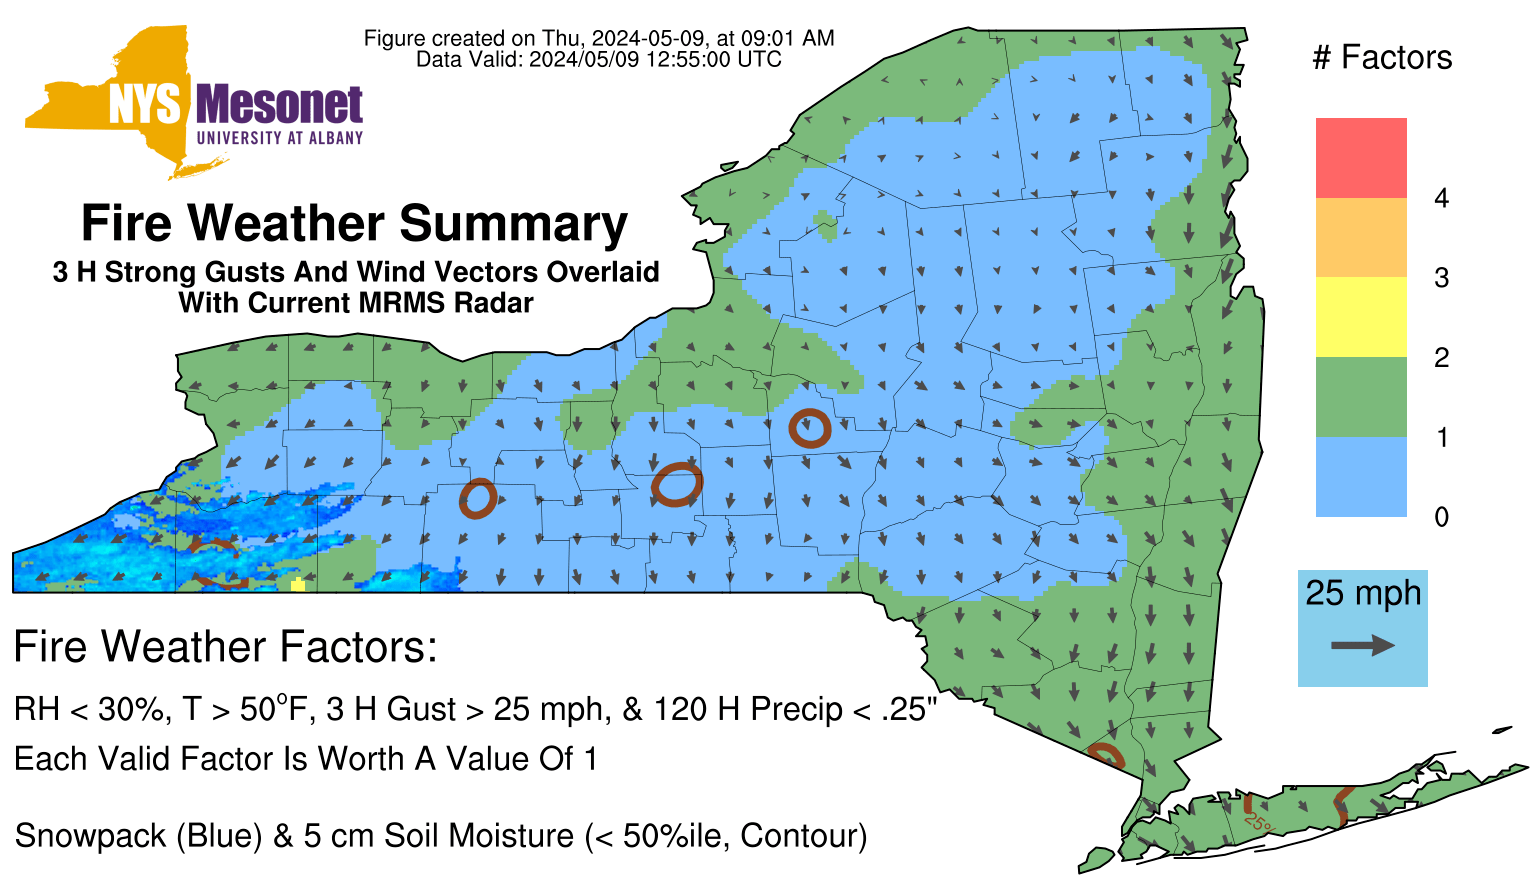
| New York State Mesonet - Simple Fire Weather Summary | New York State Mesonet - Complex Fire Weather Summary |
National NWS Fire Weather Page
Storm Prediction Center - Fire Weather
National Interagency Fire Center