
A Wind Advisory has been issued for portions of northern New York from 11 AM to 8 PM today for localized southwest winds 15 to 30 mph with gusts up to 50 mph possible. A few power outages are possible. The strongest winds are expected between noon and 5 PM today. Read More >
 Email the author
Overview
Between 16 February and 18 February 2022, a period of active weather occurred across the North Country. Several weather hazards occurred during this period. Strong southerly winds, a period of moderate to heavy rainfall and thawing conditions on Thursday that led to localized flooding and a major ice jam on the Ausable River, then followed by the combination of flash freeze and sleet/freezing rain producing very hazardous driving conditions. Each hazard will be discussed briefly.
High Winds
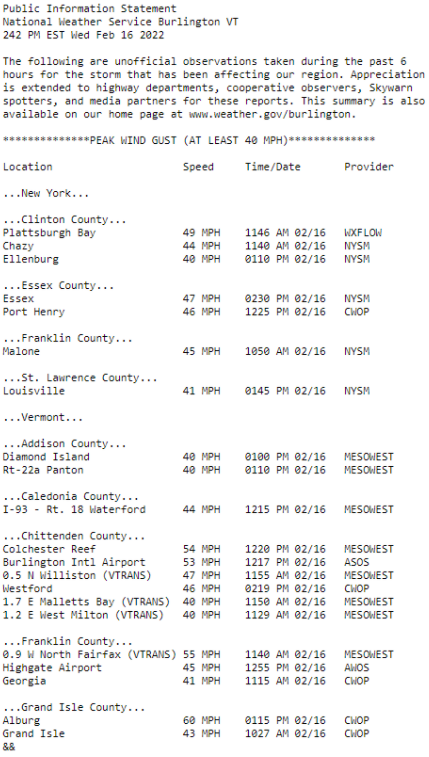
Figure 1: Public Information Statement of maximum observed wind gusts 16 February 2022.[click to enlarge]
Anomalously strong surface high pressure observed at 1046mb south of Nova Scotia and weak surface low pressure traveling towards James Bay in Canada resulted in stronger than normal pressure gradients across the forecast area. A south to southwest low-level jet of 50 to 55 knots was observed as a warm frontal boundary lifted north across the region (Figure 2). Channeled winds between the Adirondack and Green Mountains resulted in these winds being maximized across the Champlain Valley. In particular, the strongest observed winds took place over Lake Champlain, likely aided by the lack of friction over ice-covered areas. Observed wind gusts between 40 to 55 mph were common, with Alburgh reporting 60 mph (Figure 1). Pieces of thin ice broke off and were pushed north towards the Cumberland Ferry route, closing their route for the day (Figure 3). Power impacts were minimal across the region, as the strongest winds were confined to the immediate lakefront. South winds typically do not have the level of impacts as other directions, and that was true for 16 February 2022 as well.

Figure 2: Left) WPC surface analysis at 15Z 16 February 2022. Right) RAP analysis of 850hPa heights, wind, and temperatures at 18Z February 16 2022.[click to enlarge]

Figure 3: Burlington hazecam with a thin ice sheet moving north in the strong south winds over Lake Champlain.[click to enlarge]
Heavy Rain and Thawing Conditions
Efficient warm advection behind the warm front brought temperatures into the 40s and 50s Thursday into Friday. Massena, New York and Montpelier, Vermont both set daily record highs on Thursday. Temperatures began to rise above freezing Wednesday afternoon, and did not fall below freezing for many locations until Friday. This resulted in thawing degree hours near, or above, 300 for much of the region, which is considered favorable for ice break up (Figure 4). Initially, snowmelt was relatively slow, due to dewpoints well below 32 °F on Wednesday, 16 February 2022, but dewpoints rose into the low to mid 40s during the day on Thursday, 17 February 2022. Estimated snowmelt of 0.75” to 2.00” took place before the cold front ended the thaw early Friday morning (Figure 5). Snow depths fell about 4 to 8 inches across the North Country (Figure 6).


Figure 4: Left) Max Temperature between 12Z Thursday, 17 February and 12Z Friday, 18 February. On the right, thawing degree hours, a cumulative measure of temperatures above freezing, between 15Z Wednesday, 16 February and 13Z Friday, 18 February.[click to enlarge]

Figure 5: Estimated snowmelt based on NOHRSC analysis from 05Z Wednesday 17 February through 05Z Friday 17 February. Estimated snowmelt from 0.75”-2.00” was common across much of the region.[click to enlarge]
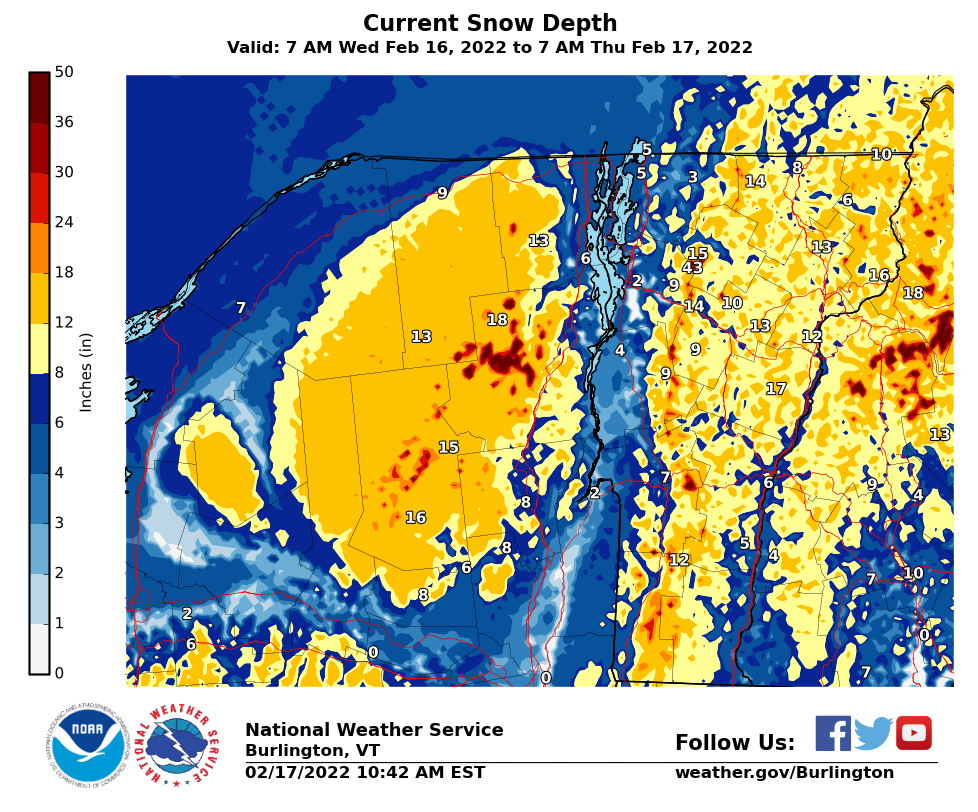
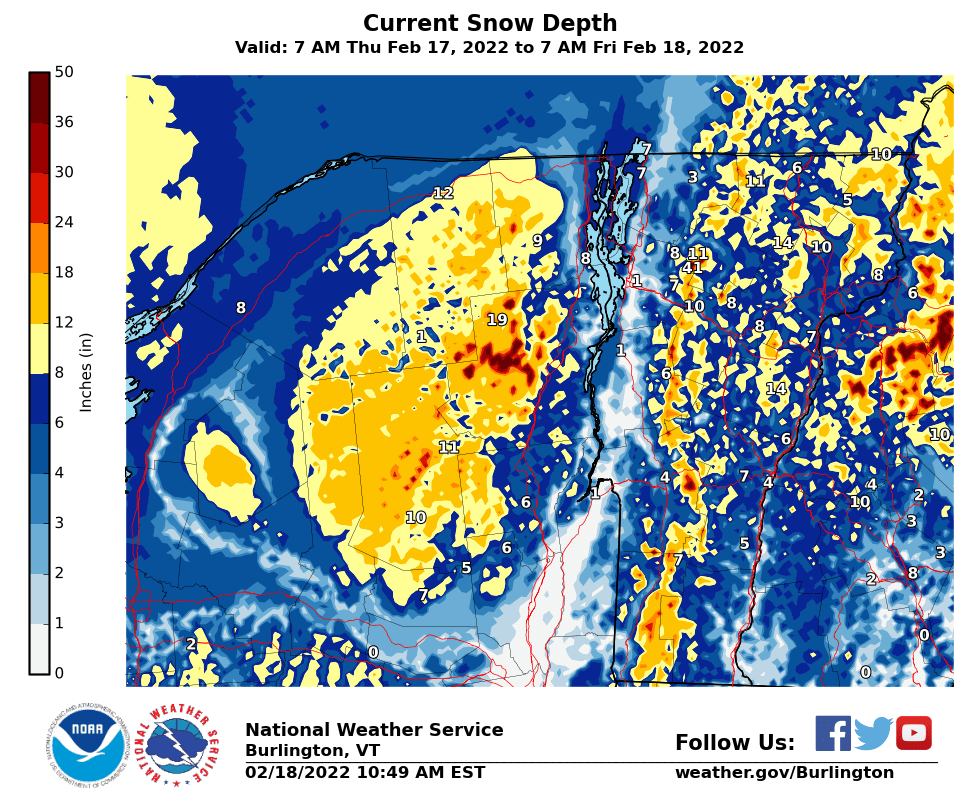
Figure 6: Left) Snow Depth analysis based on COOP data 17 February 2022. Right) Snow Depth analysis based on COOP data 18 February 2022. Changes in snow depth were estimated to be 4 to 8 inches across most areas.[click to enlarge]

Figure 7: Storm Total Precipitation 17-18 February 2022.[click to enlarge]
In addition to snowmelt, the synoptic scale pattern was favorable for heavy precipitation, particularly over northern New York. Rainfall was between 1.0” and 2.5” in the Adirondacks, and between 0.50” and 1.25” in much of Vermont (Figure 7). Thursday evening into Friday, an elongated area of low pressure lifted into the North Country, deepening from 992 mb to 984 mb while moving from the Ohio River Valley through the Mohawk Valley, and into the Connecticut River Valley. In conjunction with favorable positioning to the north of a southwest to northeast 140 knot jet at 300 hPa, an enhanced period of coupled low-level convergence and upper-level divergence remained in place several hours across the region, particularly over northern New York. This coincided with the development of a sharp cold front across the region (Figure 8). Another contributor to moderate to locally heavy rain was an area of weak elevated instability, with maximum 2-6km lapse rates near 7.5 °C across northern New York into northern Vermont (Figure 9). Precipitable water values briefly exceeded 1 inch across portions of southern Vermont (not shown). Accelerating south to southwest mid-level flow ahead of the deepening low resulted in sharp terrain shadowing across the Connecticut River Valley and north of the White Mountains, while enhancing precipitation along sections of the western Green Mountains and the Adirondacks.

Figure 8: Left) Looped RAP analysis of upper divergence and lower convergence 03Z 18 February 2022 through 12Z 18 February 2022. Right) Looped RAP analysis of 850hPa frontogenesis from 00Z 18 February 2022 through 12Z February 2022.[click to enlarge]

Figure 9: 10Z 18 February 2022 RAP analysis of 2-6km AGL maximum lapse rates.[click to enlarge]
River Flooding and Ice Jams
With the contributions of rain and snowmelt, area rivers sharply rose during the day on Friday, which produced localized flood events. Reports of minor flooding took place along Route 125 between Ripton and Middlebury, and the Mad River reached minor flood stage from ice movement. An ice jam in Woodstock, Vermont along the Ottauquechee near Route 4 pushed water onto roadways, although the road remained passable. Additional ice jams were reported along the White River at West Hartford, at the Missisquoi that flooded portions of Davis Park, as well as along the Winooski and Lamoille River but without impact (Figure 10).

Figure 10: Ice jam events and impacted areas between 16 and 18 February 2022.[click to enlarge]
While most impacts were limited, in contrast, the East Branch of the Au Sable River reached its 3rd highest reported level at 15.19 ft due to an ice jam, surpassing the observed water level from the ice jam on 12 January 2018 by nearly 2 feet (Figure 11). Major flooding closed roads, flooding cars, with water entering homes and businesses. Cars were submerged beneath flood waters near Ausable Forks (Figure 12). Videos on social media platforms of the event depicted flooded roadways downtown, with reports of water in basements along Intervale Road. This acts as a reminder that despite the below average snowpack and the cooler temperatures compared to the January Thaw of 2018, that the severity of ice jam flooding can be hard to predict.

Figure 11: Submerged vehicles near Ausable Forks. Photo by Kevin Zaumetzer.[click to enlarge]

Figure 12: Observed river stage at the East Branch of the Ausable River at Ausable Forks, New York. Water levels crested at 15.19 ft, which ranked as the 3rd highest observed stage.[click to enlarge]
Wintry Precipitation/Flash Freeze
Temperatures rapidly cooled late on the 17 February and early 18 February. The observed 15 degree drop at BTV (Burlington International Airport) between 11 PM and 12 AM and 18 degree drop at MPV (Knapp State Airport, Barre-Montpelier) between 4 and 5 AM were ranked 10th for hourly temperature drops in the winter season (Figure 13). A transition from rain to freezing rain and sleet took place as low level temperatures quickly fell below freezing. Snowmelt, in combination with the recent rainfall, caused icy road conditions as this flash freeze took place.

Figure 13: The top 10 temperature drops for Burlington (Top) and for Barre-Montepelier (Bottom).[click to enlarge]

Figure 14: Hourly temperature (°F) observations across the North Country Thursday and Friday. Warm conditions prevailed Friday. Cold air can be observed moving south by 8 PM Thursday, even against increasing temperatures near Rutland, Vermont about 4 AM Friday.[click to enlarge]
The northern valleys experienced these conditions first, as cold, dense air was trapped against the Adirondack and Green Mountains. Eventually cold air would overspread the whole region (Figure 14). The positioning of the upper trough resulted in a shorter duration of southwest winds just off the surface across Massena, which lasted longer across the Champlain Valley (Figure 15 and 16). The result was that Massena experienced a faster transition from rain, to a wintry mix, and then to snow. The transition from freezing rain to sleet was fast across the St. Lawrence Valley, but heavy sleet lasted much longer in the northern Champlain Valley due to its position relative to the storm track. Areas in the Champlain Valley had a warm layer above 0 °C that was more persistent, along with a zone of enhanced low-level convergence that was present across the Champlain Valley. (Figure 17) Observational reports from Charlotte, Vermont, sleet accumulations of 1.7” took place early Friday morning. Ice accumulation from freezing rain was generally a few hundredths across northern New York and portions of central Vermont. Along the region of favorable convergence in the Champlain Valley, ice accumulations were likely between 0.10”-0.20” for much of the area (Figure 18).
Figure 15: RAP forecast soundings for Massena, NY from 21Z 17 February 2022 through 06Z 18 February 2022. In red is the temperature profile, in green is the moisture profile, the left hand bars represent the relative humidity with the forecast precipitation type next to the bars. Forecast winds are on the right hand column and scaled to wind speeds.[click to enlarge]

Figure 16: Same as Figure 15, but for Burlington, Vermont from 00Z through 12Z 18 February 2022. Note the stronger and more persistent layer of above freezing air compared to Massena.[click to enlarge]
Figure 17: Surface METAR observations 06Z 18 February 2022. North winds were observed across Canada, against the south winds measured at Burlington, Vermont at this time.[click to enlarge]
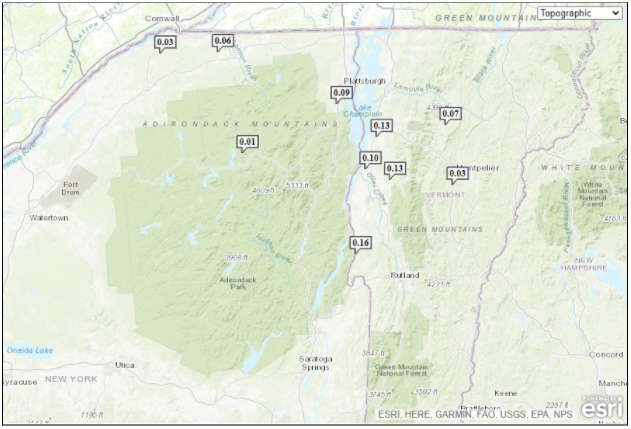
Figure 18: Reported ice amounts across Vermont and northern New York on 18Z February 2022.[click to enlarge]
North of the zone of sleet and freezing rain, a band of moderate to heavy snow developed in the St. Lawrence Valley, though generally remaining north of the International Border. Still a narrow zone of 6 to 8 inches of snow fell across far northern St. Lawrence and Franklin Counties in New York (Figure 19). Having made a few comparisons to the January 12-13, 2018 ice jams and heavy snow, the extent was much smaller compared to the 8-14 inches that fell from that event. The 12-13 January 2018 event had a meridionally oriented upper jet configuration and more amplified upper trough compared to this event (Figure 20). As a result, the snow on 18 February 2022 was more progressive, ending soon after the low passed east, while on 13 January 2018, better upper diffluence and a slower frontal passage due to flow parallel to the frontal boundary resulted in greater snow totals. For more on the similar 12-13 January 2018 Event - please see our review here.

Figure 19: Observed storm total snow on 18 February 2022.[click to enlarge]


Figure 20: A comparison between the upper jet structure with the SPC analyzed 250 hPa winds at 00Z 18 February 2022 (Left) and 12Z 13 January 2018.[click to enlarge]

