 Email the authors
I. Overview
This document serves as a preliminary review of the meteorological and hydrological conditions that contributed to flooding and severe weather across portions of Vermont and northern New York on 10-11 July 2024. Coincidentally, this significant event occurred precisely one year after the Great Vermont Flood of 2023.
A combination of flash flooding, river flooding, and severe weather was observed as the remnants of tropical cyclone Beryl interacted with a quasi-stationary front draped across the Northeastern United States (Fig. 1). The heaviest rainfall fell along an axis from Essex County NY east-northeastward across central into northeastern Vermont (Fig. 2).
Total rainfall amounts were generally between 3-5" within this heavy rain axis, with localized values exceeding 7". A couple of the higher rainfall totals included 6.76" in Hinesburg and 7.1" in Walden.
Rich moisture was in place across Vermont and northern New York, and contributed to torrential downpours. Precipitable water values were in excess of 2 inches (Fig. 1), representing near-record values for our geographic area. During the late afternoon through the evening hours on July 10th, high precipitation supercells interacted with the aforementioned quasi-stationary front draped across central VT. These supercell thunderstorms ultimately evolved into a larger cluster of thunderstorms with heavy rain training over the same areas during the evening hours and into the pre-dawn hours on July 11th. The mosaic composite reflectivity loop from the National Severe Storms Laboratory (NSSL) Multi-Radar Multi-Sensor (MRMS) analysis shows well the thunderstorm development and subsequent training of storms (Fig. 3). In addition to the flooding, instability and strong low and deep-layer shear resulted in numerous severe thunderstorms during the afternoon and evening hours on July 10th. Severe weather reports included damaging winds and large hail up to 1.5 inches in diameter (Fig. 4).
This writeup is organized as follows. Observations and conditions associated with flash flooding are covered in Section 2, followed by a similar analysis of river flood conditions in Section 3. In Section 4, flood surveys conducted by NWS Burlington are summarized. In Section 5, a radar-based analysis of the severe thunderstorms across northern New York and Vermont is provided. Lastly, Section 6 provides a concluding summary.
II. Flash Flooding
By far the most impactful aspect of this event was the riverine and flash flooding, some extreme, that affected the region. This generally occurred in a 30-40 mile wide band extending from Essex County, New York east-northeastward through portions of Addison, Chittenden, Washington, Lamoille, Caledonia and Essex Counties in Vermont, and was highlighted in a special Mesoscale Precipitation Discussion by the NOAA/NWS Weather Prediction Center on the evening of July 10 around 800 pm (Fig. 5). In this region, moisture-rich air with precipitable water (PWAT) values over two inches associated with the remnants of tropical cyclone Beryl converged along a stationary front, providing the impetus for enhanced atmospheric lift and efficient convective rainfall (Fig 1). In fact, PWAT values (a general measure of the amount of moisture in the atmosphere) were near record levels for the date as interpreted by the NOAA/NWS Storm Prediction Center's Atmospheric Sounding Archive, using Albany, NY as a closest proxy (Fig. 6).
Given these concerning parameters, as training showers and thunderstorms formed along the stationary frontal boundary very efficient rainfall rates were observed in excess of 2 inches per hour in the most intense bands. The core of the flash flood event began during the late afternoon and evening hours on the 10th and persisted into the early morning hours on the 11th, after which a gradual transition to riverine flooding occurred. After a thorough review of all observations from a variety of sources, including NWS Cooperative Observer and Automated Surface Observation Sites, CoCoRaHS data and reliable, privately-owned home weather stations, a storm total precipitation map was created and shared to core partners and the public. This indicated average rainfall totals ranged from 3 to 5 inches in the core of the hardest hit areas, with localized totals as high as 6 to 7 inches (Fig. 2).
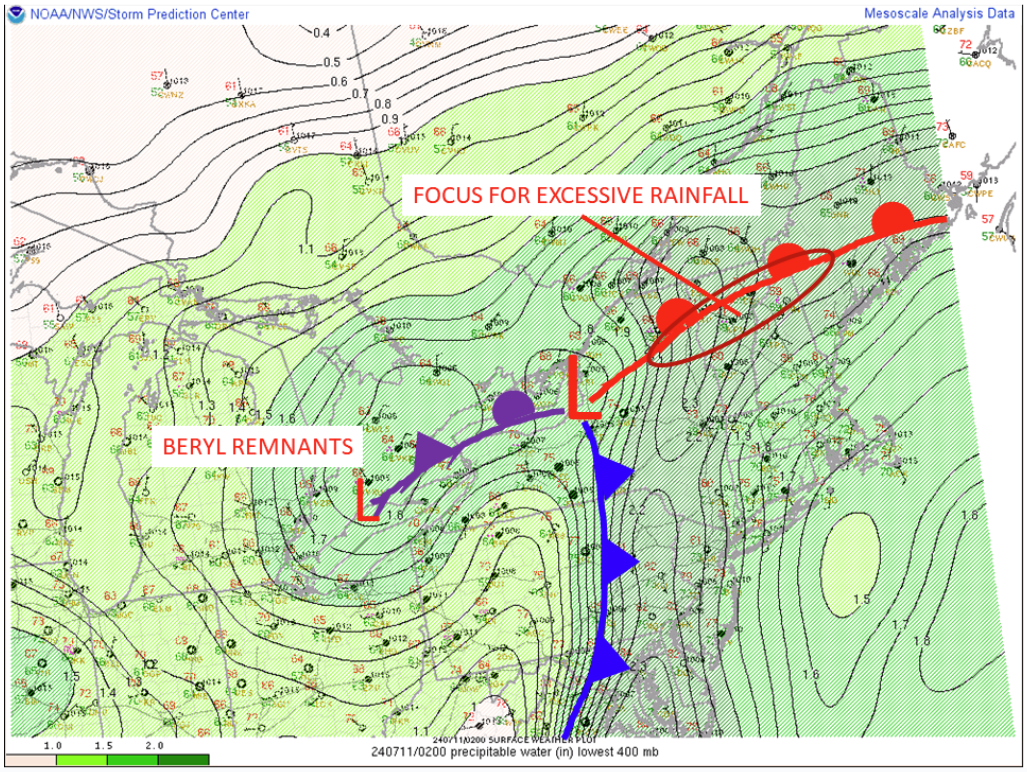
Figure 1: NOAA/NWS/Storm Prediction center surface observations with precipitable water values (PWAT, shaded, in inches) and surface frontal analysis at 02Z on 11 July, 2024 from NOAA/NWS/Weather Prediction Center. Near record PWAT values over 2 inches were observed across the region.[click to enlarge]
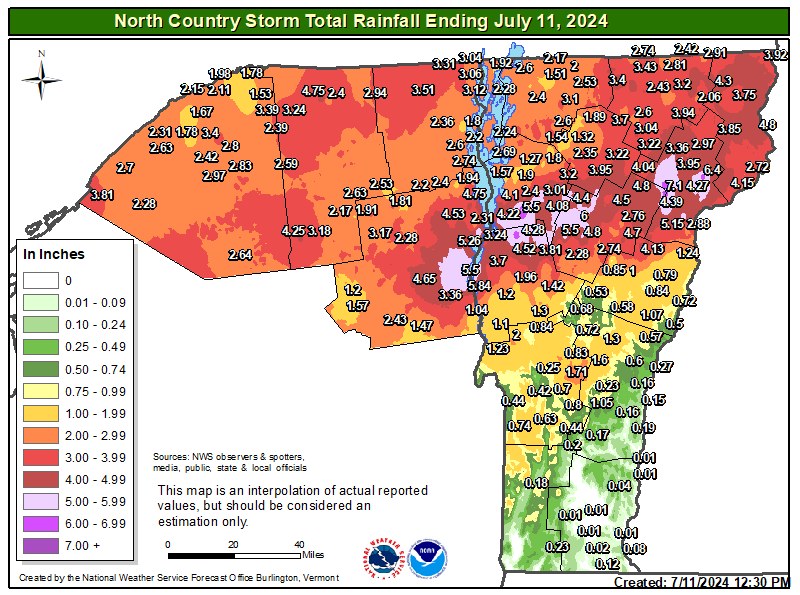
Figure 2: Storm total rainfall (in inches) for the period July 10th through 7am on July 11th, 2024. Maximum rainfall amounts occurred along an axis from Essex County, New York east-northeastward across central Vermont and into Caledonia County in Vermont's Northeast Kingdom.[click to enlarge]
Figure 3. NSSL's Multi-Radar, Multi-Sensor (MRMS) mosaic composite reflectivity (dBZ) loop in 30-minute increments for the period 0856Z July 10th through 1456Z on 11 July 2024. The MRMS analysis includes radar reflectivity data from both the WSR-88D network and the Canadian radar network. [click to enlarge]
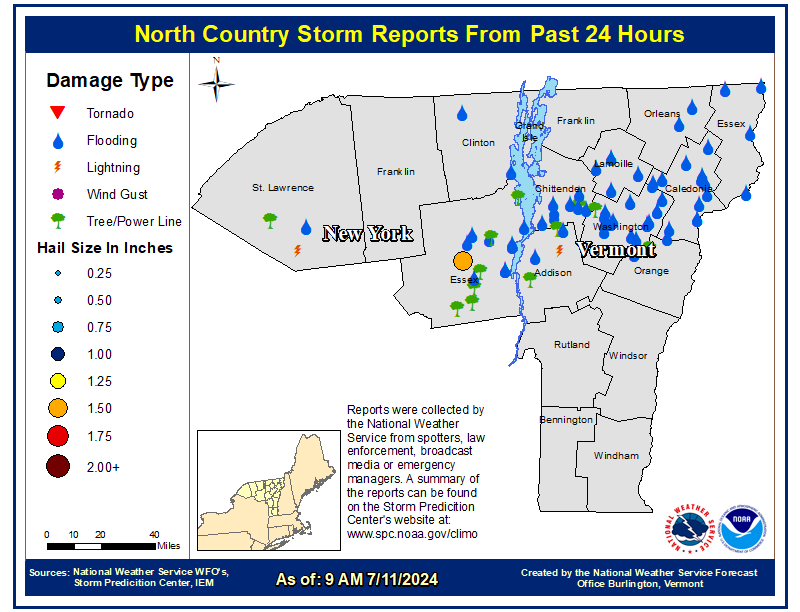
Figure 4. Preliminary analysis indicating locations of reported damage from flooding, lightning, large hail, and damaging winds on July 10th into the morning of July 11th, 2024. [click to enlarge]
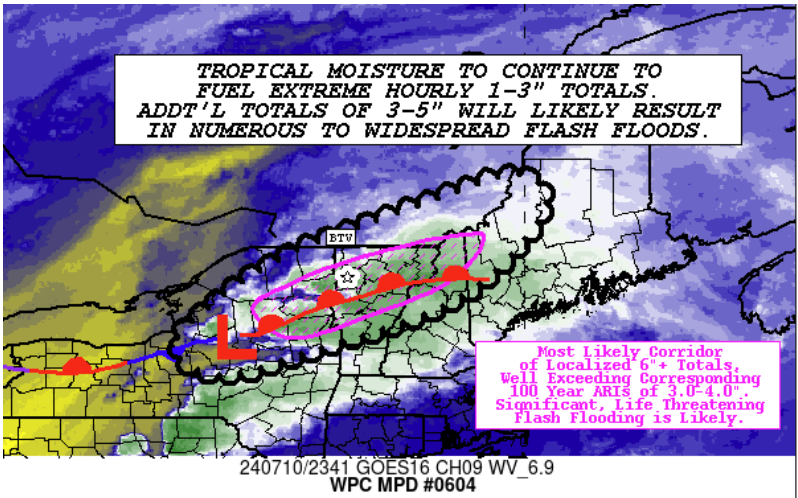
Figure 5: The NOAA/NWS/Weather Prediction Center Mesoscale Precipitation Discussion #0604 image from 7:43 PM EDT on 10 July 2024 indicated the likelihood of significant flash flooding across portions of the NWS Burlington forecast area.[click to enlarge]
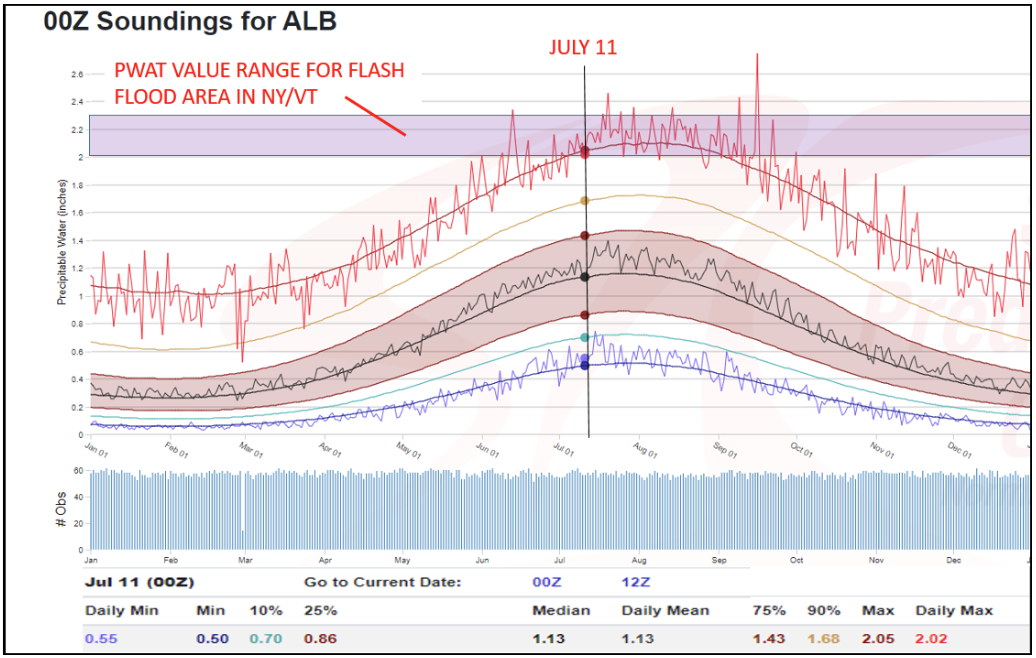
Figure 6: The NOAA/NWS/Storm Prediction Center's precipitable water (PWAT) climatology analysis for Albany, NY at 00Z. At 00Z on 11 July 2024, PWAT values across much of the NWS Burlington forecast area ranged from 2 to 2.3 inches which ranks near or above record values for the date.[click to enlarge]
These excessive rainfall totals led to numerous areas of flash flooding. On the morning of July 11, Vermont Emergency Management had received nearly 700 reports of damage related to flooding. Numerous roads and bridges had been impacted (Fig. 7), or in some cases washed out and numerous swift water rescues performed by local first responders or teams from Vermont Swift Water Rescue. Their heroic work likely saved many lives. Essex County, NY, was also not immune to the damage, with NY State Office of Emergency Management reporting nearly 25 roads closed due to high water, or flood damage (Fig. 4). Of all the flash flooding, none was more severe than in the towns of Plainfield, Barnet and portions of Peacham, VT. Here, stretches of the Great Brook, South Peacham Brook and Stevens River were scoured down to bedrock, and in some cases left their channels, subsequently carving out separate channels which damaged structures and homes. Another area of significant damage occurred along Calendar Brook in Lyndon where significant damage to a few structures was noted. A few flash flood damage photos taken during post-event flood surveys are shown in Figs. 8 and 9.
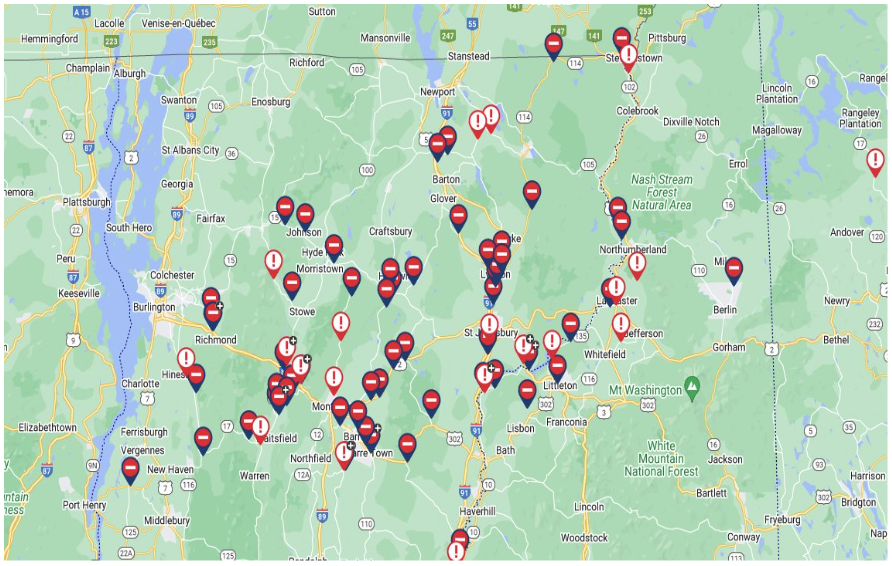
Figure 7: Vermont 511 road closures on the morning of July 11, 2024. These reports indicate only primary or major travel routes impacted. Numerous other secondary road damage/washout locations are not shown.[click to enlarge]
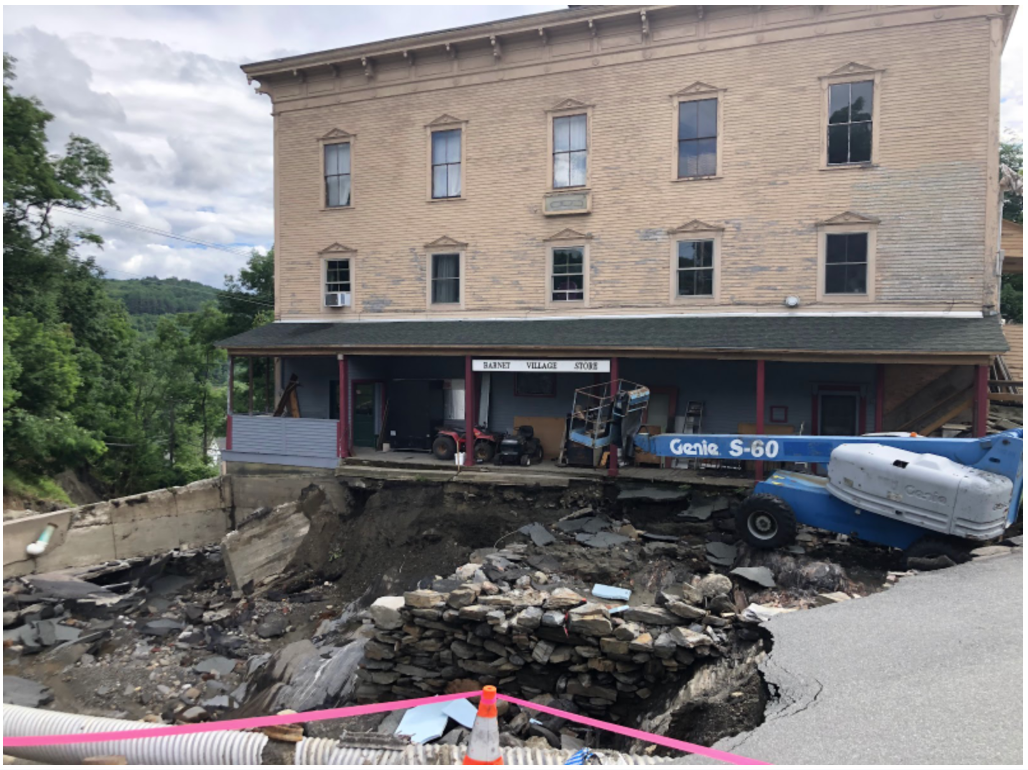
Figure 8: Severe flash flooding forced the Stevens River to leap its banks and scour out a huge pit in front of the old Village Store in Barnet, Vermont, damaging the building and uncovering an early foundation built on the original bedrock at Stevens Falls (NWS Burlington photo).[click to enlarge]
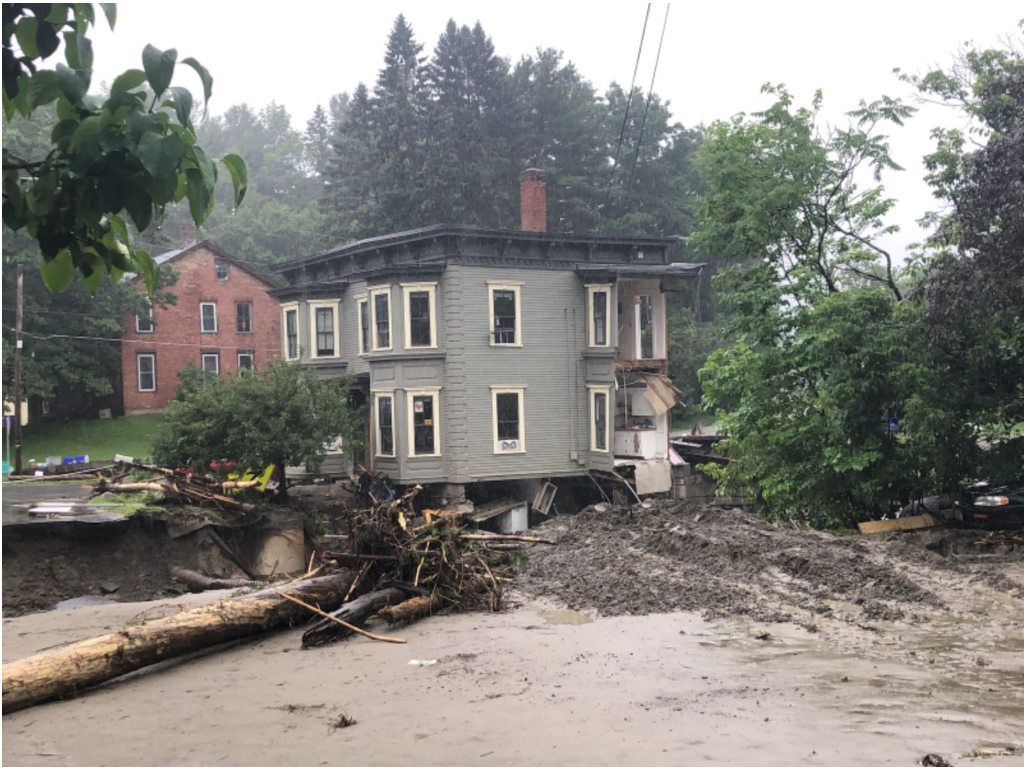
Figure 9: 4 to 6 inches of rainfall in the Great Brook watershed in Plainfield, VT led to catastrophic flash flooding which damaged or destroyed several structures in town (NWS Burlington photo).[click to enlarge]
A post-analysis of precipitation trends during this event indicated the majority of the excessive rainfall fell in a 6 to 9 hour time frame. This is key, since rainfall rates and their duration play a key role in assessing the potential for flash flooding. Higher rates in shorter time frames have a greater potential to produce flash flooding than lower rates during longer periods. This is a logical conclusion, however, it can be challenging to assess potential flash flood severity in areas with poor radar estimates or low density observational networks despite many excellent tools NWS Burlington has at their disposal. Ground truth reports and coordination with core emergency management personnel are critical during the storm interrogation and warning phase of these events.The NOAA Atlas-14 Point Precipitation Frequency Estimate Climatology can also be instructive in this regard, providing approximate return intervals for selected precipitation amounts on a variety of time scales. Using Barnet, Vermont as an example with a 5 inch rainstorm over a 9 hour period, Table 1 indicates that a return period for this event lies somewhere less than 500 years, but greater than 200 years. These return interval values were common in the core of the most severe flash flooding during this event.
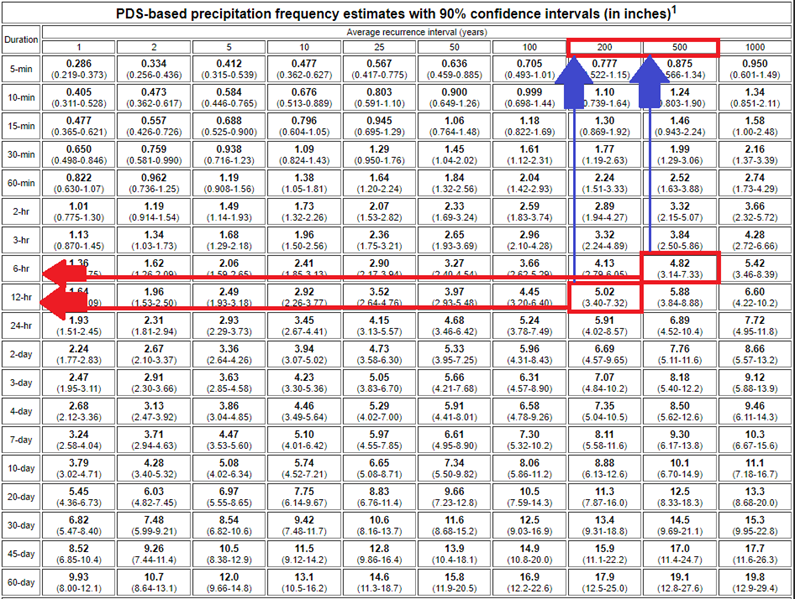
Table 1: Precipitation return frequency table for Barnet, Vermont, showing that an approximate 5 inch storm in 9 hours would yield a return period greater than 200 years, but somewhat less than 500 years.[click to enlarge]
III: Riverine Flooding
In addition to the widespread flash flooding observed in the area, significant river flooding also occurred as runoff from the headwater regions entered the main channels. Several of these "mainstem" rivers rose rapidly during the early morning hours and throughout the day of July 11th. Six gauged locations experienced major flooding, with several more receiving minor to moderate flooding. Those included but were not limited to the Winooski, Lamoille, Mad, Passumpsic and Wells River (Table 2) where crests, in some cases exceeded those observed during Tropical Storm Irene in August 2011. The most severe impacts from river flooding appeared to be along stretches of the Passumpsic River where numerous stretches of U.S. Route 5 were damaged or washed out from Lyndon south through St. Johnsbury. The Northeast Kingdom mobile home park in Lyndonville was one such location, with high water forcing evacuations of several homes and river flood waters reaching depths of over 4 feet in some locations (Fig. 10).
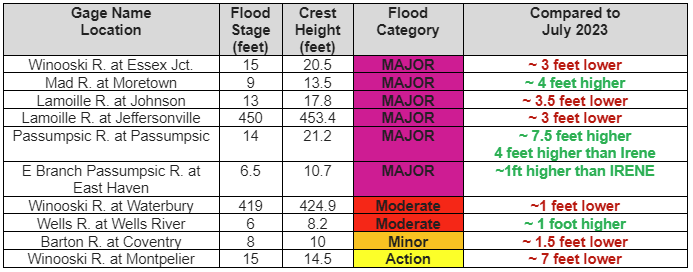
Table 2. Select river gauge locations across Vermont showing flood stage (in feet), crest height for the July 10-11, 2024 event (in feet), and flood category. The rightmost column indicates the crest height compared to the Great Vermont Flood of July 2023.[click to enlarge]
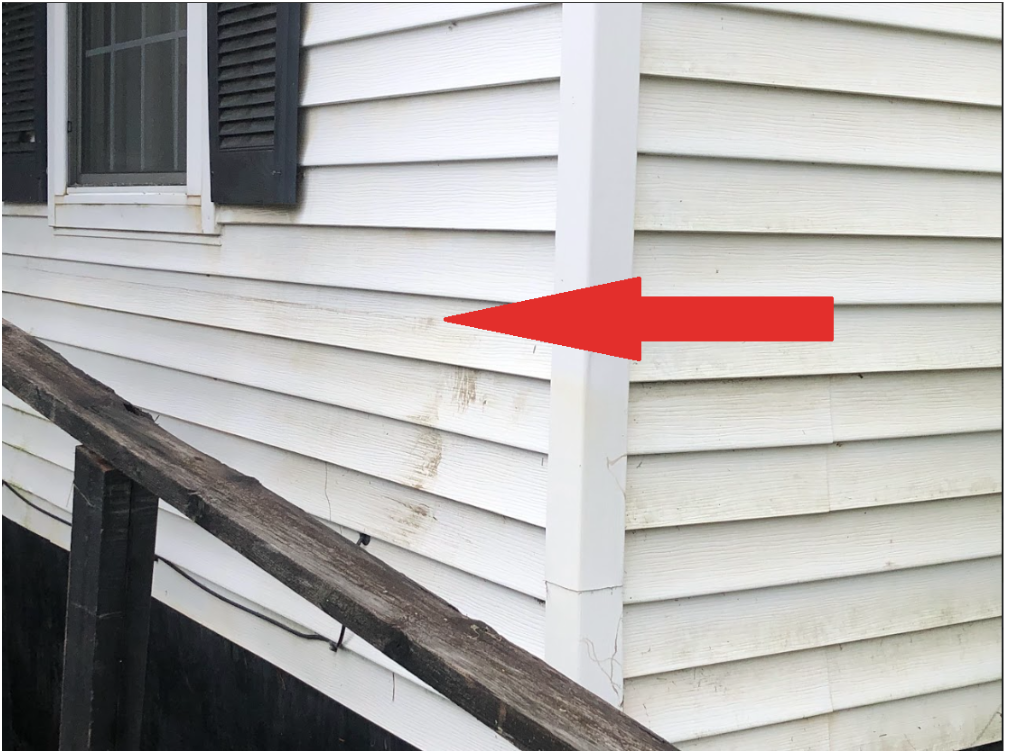
Figure 10: A high water mark is shown on a home at the Northeast Kingdom Trailer Home Park after significant flooding along the Passumpsic River on July 11, 2024 (NWS Burlington photo).[click to enlarge]
IV: NWS Burlington Damage Assessment Surveys
Following this historic flooding event, NWS Burlington conducted a damage assessment survey in some of the harder hit areas of Vermont. The survey consisted of two teams, whose focus was 1) areas in Hinesburg, Richmond, Moretown and Stowe, and 2) Plainfield, Lyndon, St. Johnsbury, Barnet, Peacham and Groton. The teams documented damage, gathered high water mark data, and spoke with a variety of emergency management/first responders and members of the public to assess timing and impacts of the floods. Assessments of this type help the NWS connect with core partners and aid in improving future flood forecasting services (Figs. 11 and 12).
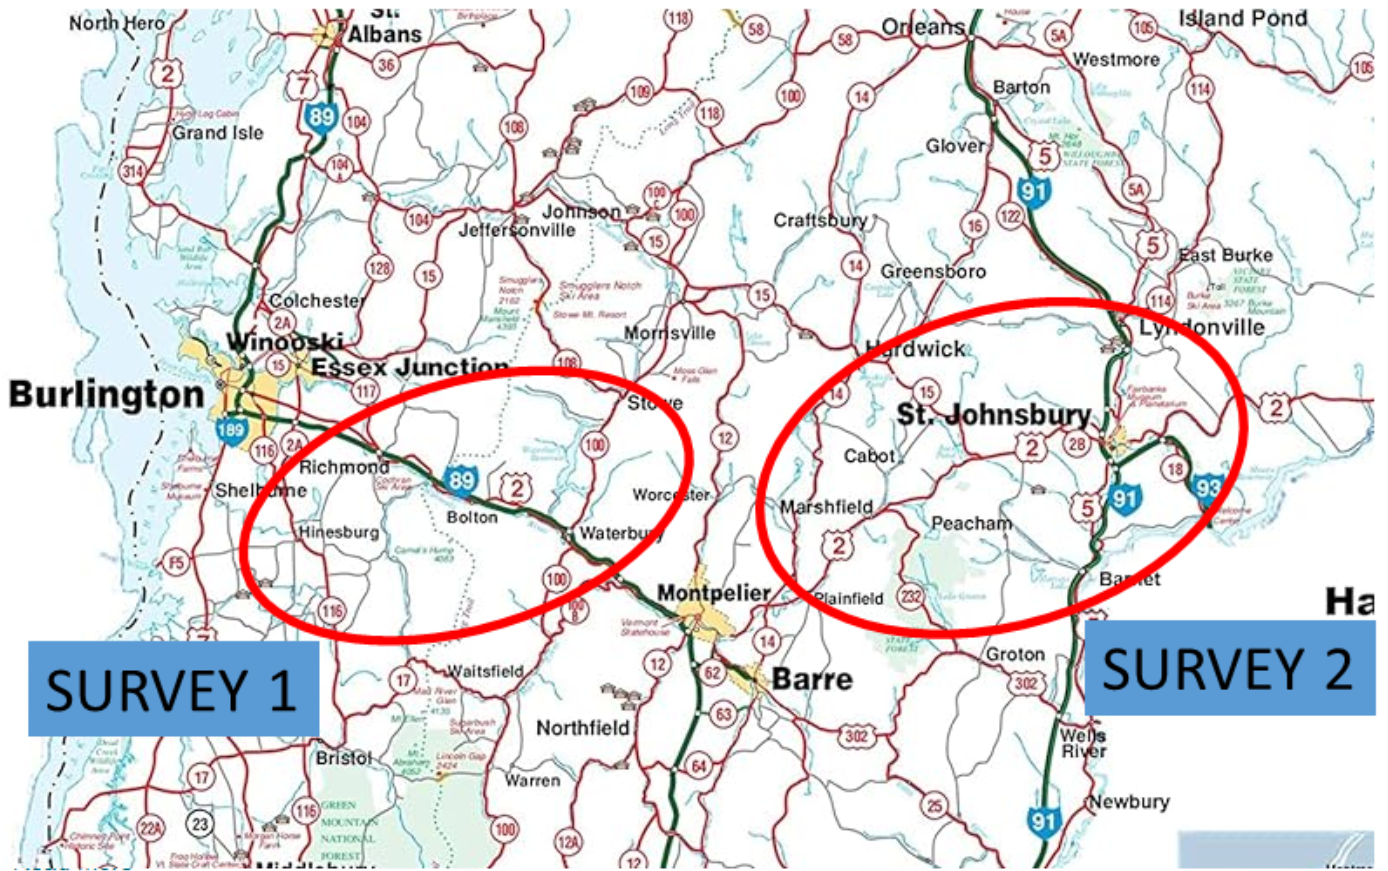
Figure 11: Approximate locations of damage assessment surveys conducted by NWS Burlington on July 12, 2024.[click to enlarge]
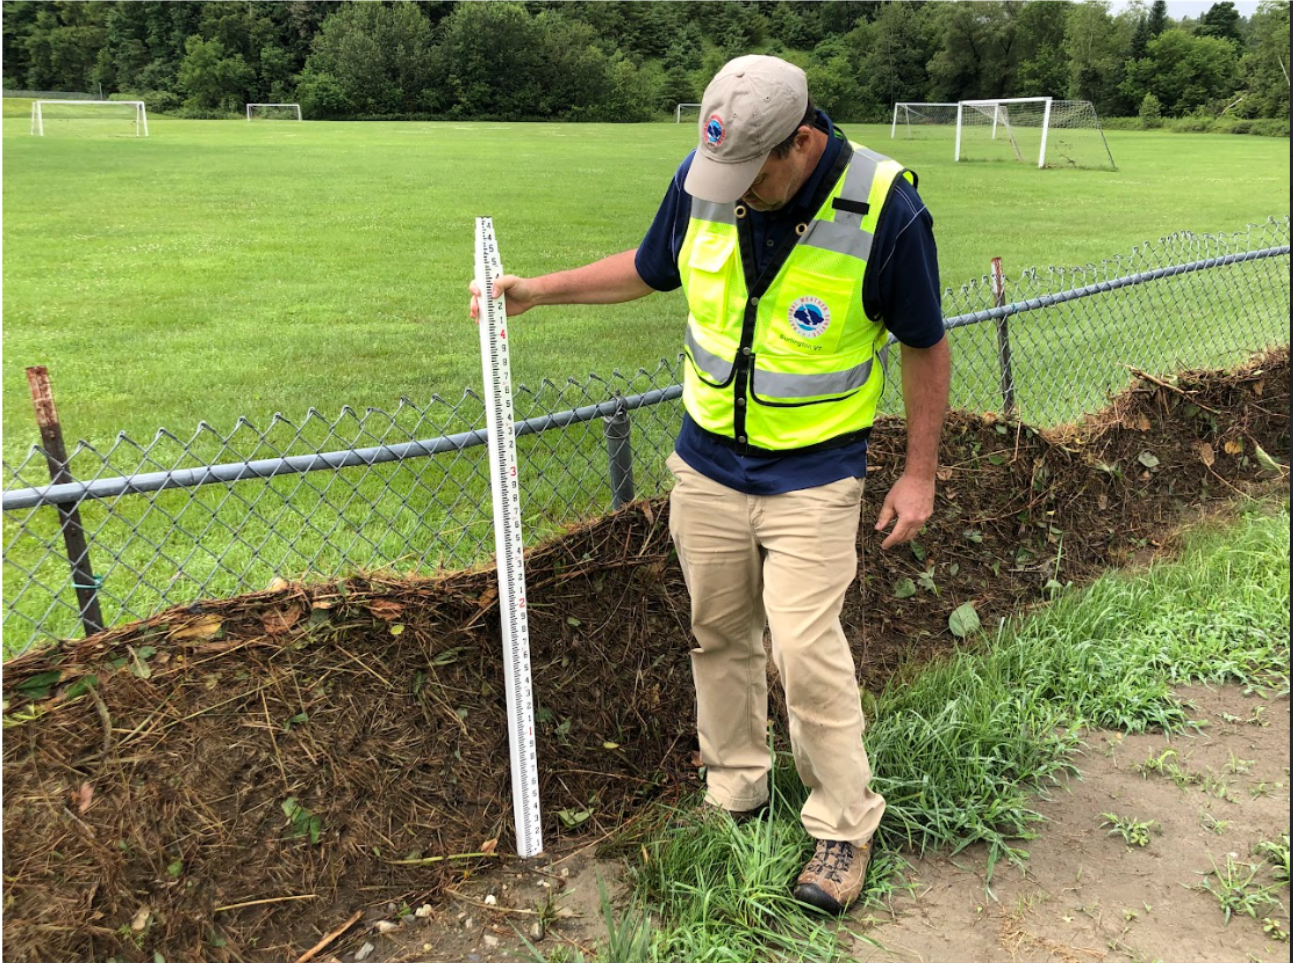
Figure 12: NWS Burlington Senior Service Hydrologist John Goff surveys a high water mark at the Lyndon Recreational Fields on Lily Pond Road along the East Branch of the Passumpsic River on July 12, 2024 (NWS Burlington photo).[click to enlarge]
V: Severe Thunderstorm Interrogation
In this section, we examine the significant radar signatures that produced severe weather on 10 July 2024 across portions of our region. In addition, to very high moisture levels, the atmosphere exhibited a plethora of low level instability and favorable turning of the winds with height to support organized supercell thunderstorms. A supercell thunderstorm is characterized by a deep, persistent rotating updraft called a mesocyclone, which forms when a thunderstorm updraft interacts with changing wind direction and speed with height. A supercell thunderstorm can be capable of producing large hail, damaging winds, tornadoes and frequent lightning.
These thunderstorms developed along a sharp temperature/instability gradient with favorable turning of winds with height during the afternoon hours on July 10th and produced damaging wind gusts, large hail, abundant lightning, and very heavy rainfall (Fig. 4). Severe thunderstorm wind gusts up to 60 mph caused trees and power lines to come down across portions of Essex County, New York into Addison County, Vermont. Hail up to 1.5 inches in diameter was observed 4 miles south-southwest of St. Huberts in Essex County New York, while 10 to 20 large trees were uprooted or blown down across central/northern Addison County, especially near the Bridport area.
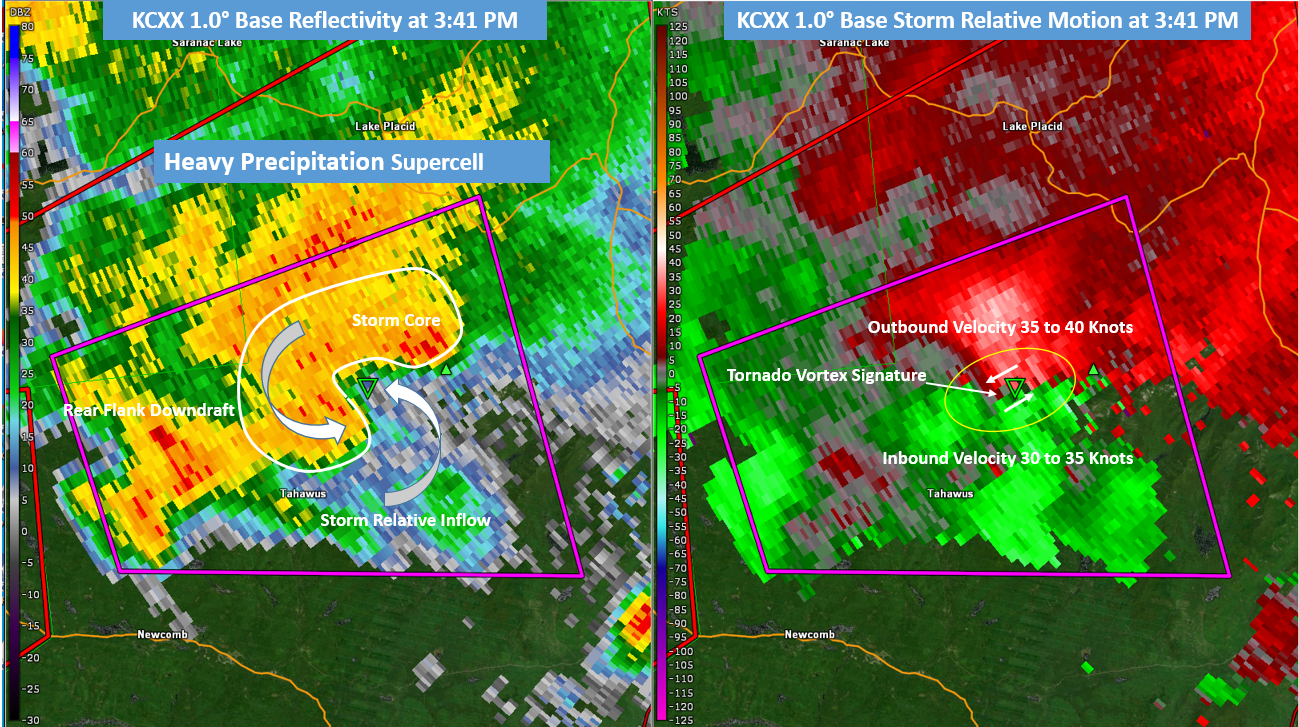
Figure 13: Colchester, Vermont (KCXX) 1.0° base reflectivity (left image) and 1.0° storm relative motion (right image) at 3:41 PM EDT on 10 July 2024.[click to enlarge]
The first thunderstorms developed during the early afternoon hours on July 10th and quickly grew into supercells capable of severe winds, large hail and tornadoes. Figure 13 shows the Colchester, Vermont (KCXX) 1.0° base reflectivity (left image) and storm relative motion (right image) at 3:41 PM on 10 July 2024, with the purple polygon indicating a tornado warning. The reflectivity structure showed a kidney bean shape with a well-defined supercell thunderstorm structure with good storm relative inflow and a developing rear flank downdraft. The rear flank downdraft is located in the southwest flank of the sharpening reflectivity gradient, where the tornado vortex signature occurred associated with a strong gate-to-gate velocity couplet. The storm relative motion (right image above) data showed 30 to 35 knots inbound winds (green color) and 35 to 40 knots outbound winds (red color), which translates to a moderate to strong mesocyclone capability of producing a tornado. This gate-to-gate rotation was observed from 5,000 feet to 12,000 feet above ground level per KCXX radar data, suggesting a moderately deep mesocyclone.
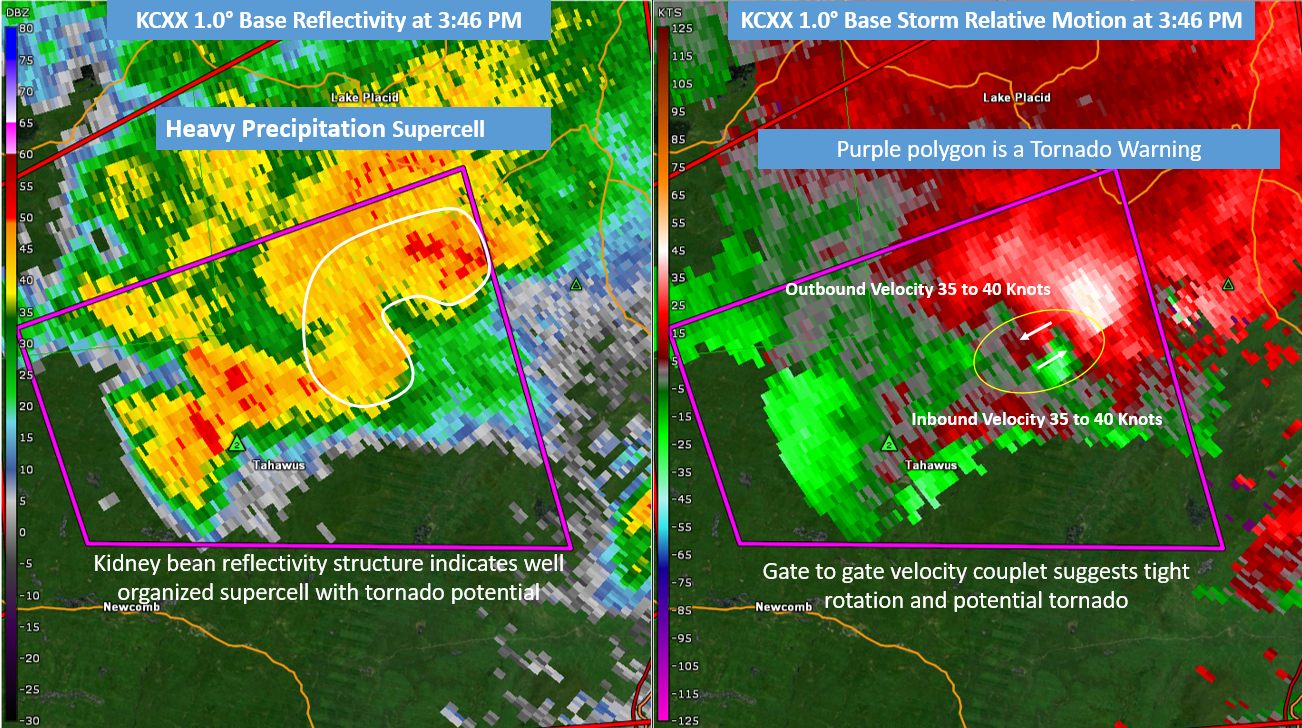
Figure 14: KCXX 1.0° base reflectivity (left image) and 1.0° storm relative motion (right image) at 3:46 PM on 10 July 2024.[click to enlarge]
Figure 14 above is the KCXX 1.0° base reflectivity (left image) and storm relative motion at 3:46 PM on 10 July 2024 across central Essex County, New York. This volume scan from KCXX at 3:46 PM continued to show a well developed supercell with a kidney bean reflectivity structure and a moderately strong gate to gate velocity couplet. These radar signatures continued to support the potential for a tornado to develop, especially given the persistent and vertical depth of the rotating updraft. The inbound velocity increased at 35 to 40 knots, while the outbound velocity was still 35 to 40 knots, resulting in 70 to 80 knots of total rotation within the mesocyclone. Given the location of the supercell over the unpopulated Adirondack High Peaks, at the time of this writing, we are unable to confirm if a tornado occurred in this area or the extent of damage.
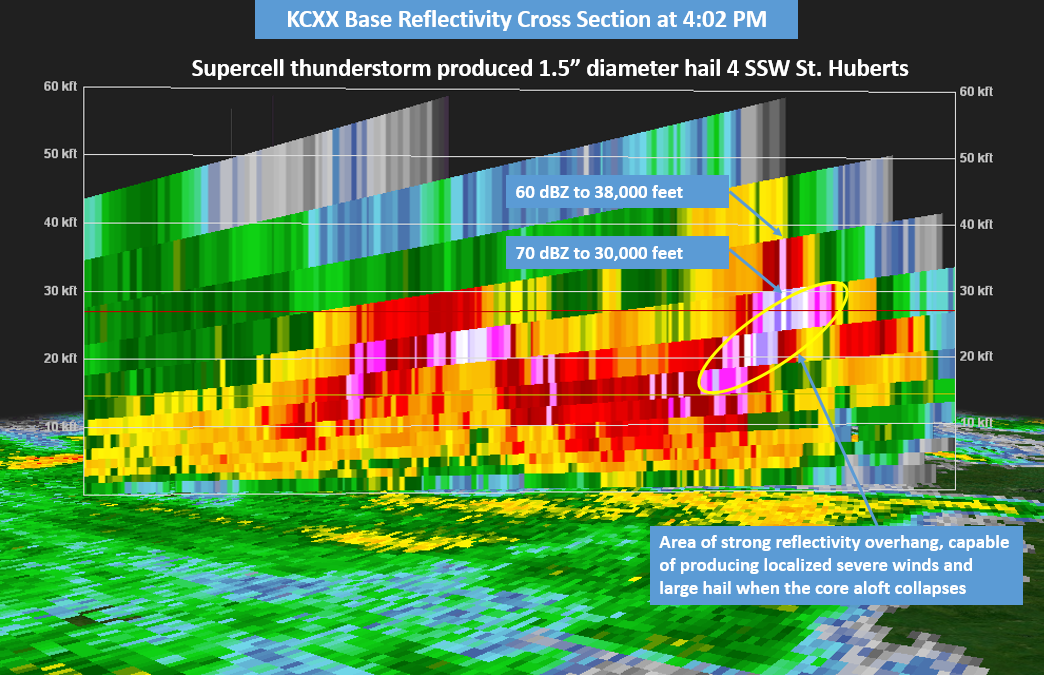
Figure 15: KCXX base reflectivity cross section across central Essex County, New York at 4:02 PM on 10 July 2024.[click to enlarge]
Figure 15 above is a KCXX base reflectivity cross section of the 1.5 inch diameter hail producing supercell thunderstorm across central Essex County, New York at 4:02 PM on 10 July 2024. A hiker in the High Peaks area shared a photo of hail at least 1.5 inches in diameter approximately 4 miles south-southwest of St. Huberts in central Essex County, New York. The image above clearly shows an intense updraft with 70 dBZ echoes to 30,000 feet and 60 dBZ returns to 38,000 feet, supporting a thunderstorm capable of large hail, especially with such strong reflectivity returns above the freezing and -20C levels. In addition, a bounded weak echo region was observed below the strong reflectivity aloft, indicating the potential for damaging wind gusts when the core aloft collapses.
Another important radar product for determining potential large hail is the Vertically Integrated Liquid (VIL) product and associated Echo Top (ET). Figure 16 shows VIL (left image below) and ET (right image below) at 4:02 PM, when 1.5 inch diameter hail was observed. VIL is an estimate of the total mass of precipitation in the clouds based on reflectivity measurements obtained from the radar. This measurement is used to determine the size of hail and when VIL values quickly weaken, it may mean that a damaging downburst wind is imminent, resulting in the weakening of the storm's updraft and the storm's inability to hold copious amounts of water/hail within the storm's updraft. These VIL (gray color) values between 90-100 kg/m2, indicates a very strong updraft capable of large hail and damaging winds. The ET (lower right) was over 50,000 feet high, indicating the supercell thunderstorm extended almost 10 miles into the atmosphere.
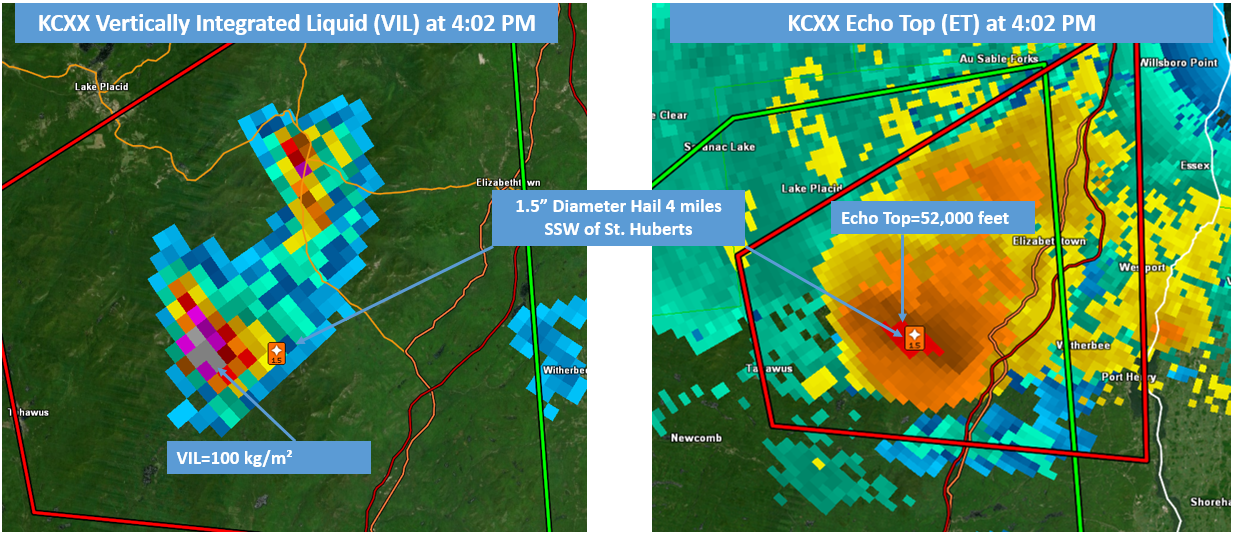
Figure 16: The KCXX Vertically Integrated Liquid (VIL) (left image) and Echo Top (ET) (right image) at 4:02 PM on 10 July 2024.[click to enlarge]
The next area of interest we will examine is the thunderstorm and associated wind damage that occurred near Bridport, Vermont around 5:45 PM on 10 July 2024. Figure 17 shows KCXX 0.5o base reflectivity (Z) and Storm Relative Motion (SRM) data at 5:45 PM, approximately the time a funnel cloud was reported, along with wind damage in the Bridport, Vermont area. A NWS survey found no damage beneath the reported funnel cloud location, with the wind damage occurring under the storm core about 2 to 5 miles northeast of the funnel cloud position. The area of spotty damage was 2.4 miles long and approximately 1.5 miles wide, consisting of 10 to 20 trees uprooted or blown down, along with some minor property damage. All trees were lying in a west to east direction, confirming a wet microburst occurred within the collapsing supercell reflectivity core. The yellow triangle in the image below shows the approximate location of the funnel cloud, while the yellow circle indicates the area of spotty tree and minor property damage. The reflectivity structure (lower left) showed a well defined hook-like structure, with modest storm relative inflow winds (green color) and slightly stronger outflow (red color) winds. The gate-to-gate velocity couplet in the SRM product (lower right) was rather weak with inbound winds of 5 to 15 knots and outbound 15 to 20 knots, suggesting a modest mesocyclone with no tornado vortex signature from the KCXX radar.
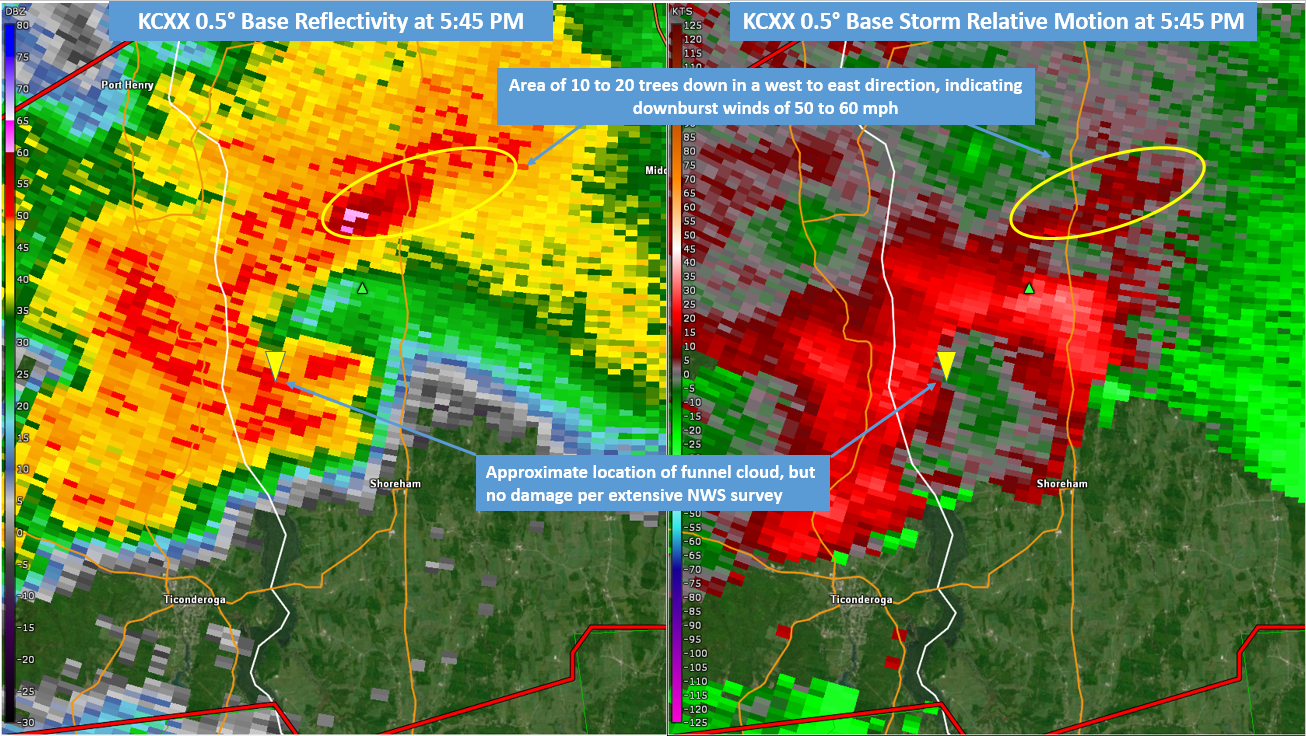
Figure 17: KCXX 0.5° base reflectivity (left image) and 0.5° storm relative motion (right image) at 5:45 PM on 10 July 2024.[click to enlarge]
The next radar image is the KCXX base reflectivity cross section at 5:45 PM showing a strong reflectivity core aloft, along with a well established bounded weak echo region (Fig. 18). This enhanced reflectivity structure aloft was associated with the supercell core, which collapsed near Bridport, VT and caused tree and minor property damage, along with some localized power outages. This strong reflectivity core aloft had 60 dBZ to 35,000 feet above ground level and a little core of 70 dBZ to 27,000 feet, indicating a very strong storm updraft.
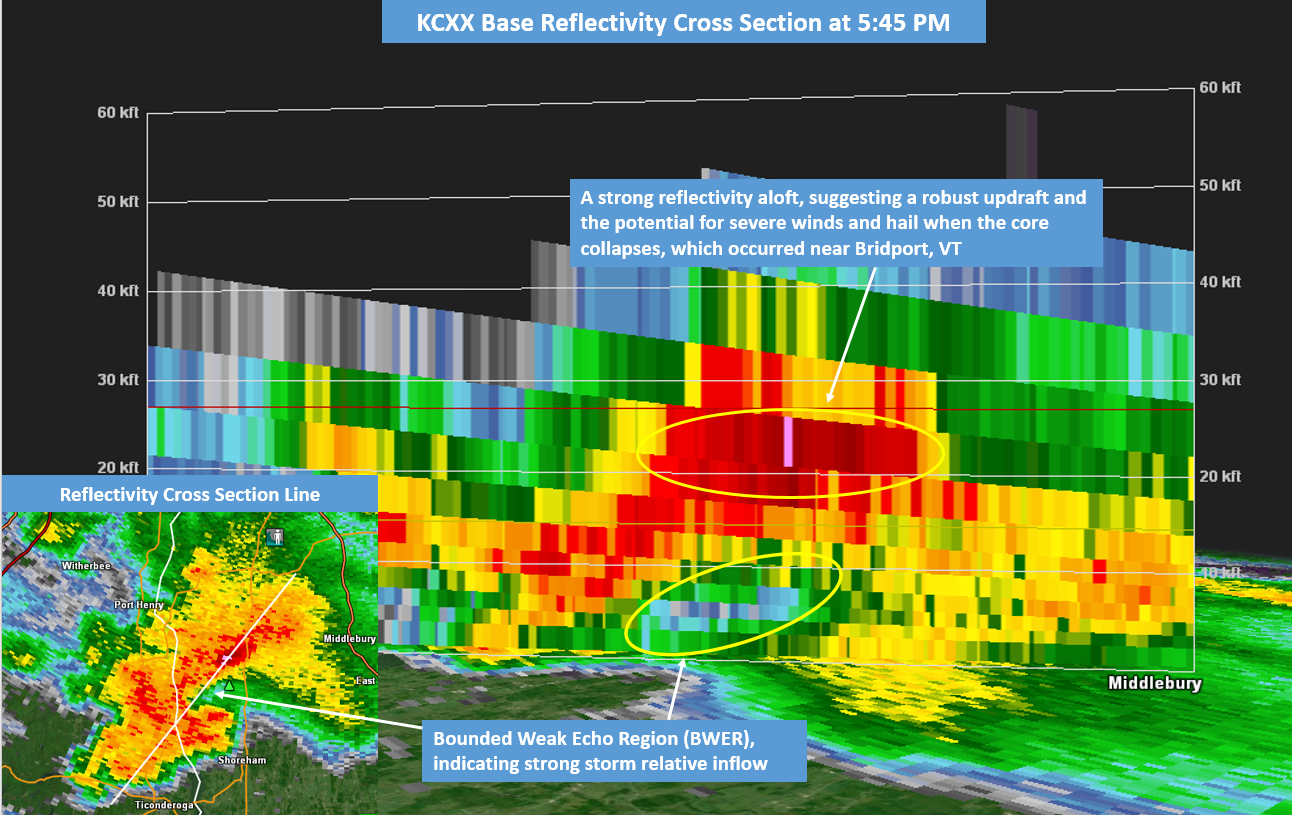
Figure 18: KCXX base reflectivity cross section across central Addison County, Vermont at 5:45 PM on 10 July 2024.[click to enlarge]
The image below shows the composite reflectivity approximately 5 minutes prior to the damage occurring near Bridport, Vermont associated with the collapsing supercell reflectivity core. The greenish/yellow color below highlights the area of most concentrated damage, per NWS survey, which found 10 to 20 trees blown over or uprooted, along with areas of minor property damage. It was estimated that winds were 50 to 70 mph associated with this thunderstorm damage.
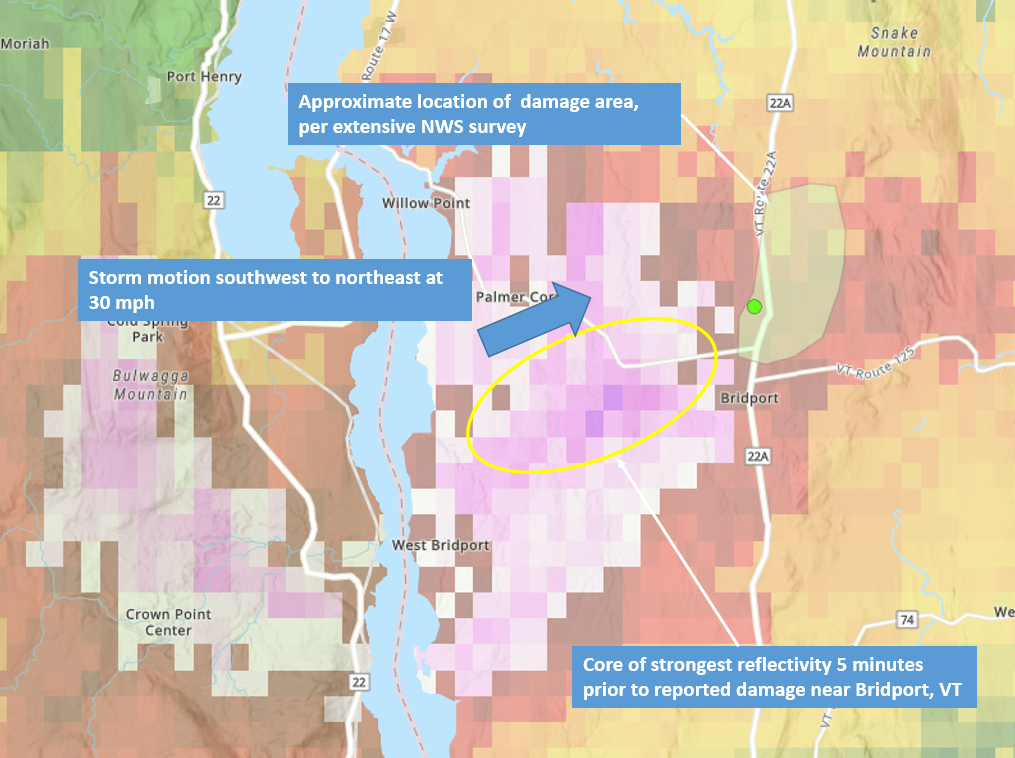
Figure 19: Composite reflectivity at 5:45 PM on 10 July 2024, with some damage area outlined in greenish/yellow color.[click to enlarge]
The final pictures are taken near Bridport, Vermont associated with the tree damage that occurred with the strong thunderstorm winds. These pictures were taken as part of a NWS damage survey conducted by Weather Forecast Office (WFO) Burlington, Vermont.
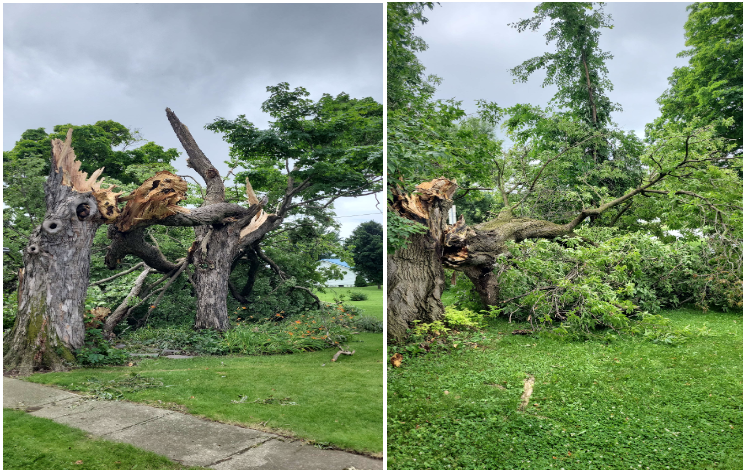
Figure 20: Storm damage pictures near Bridport, Vermont on 10 July 2024. Photos courtesy of NWS Burlington.[click to enlarge]
VI: Conclusion
In summary, a combination of flash flooding, river flooding, and severe weather was observed as the remnants of tropical cyclone Beryl interacted with a quasi-stationary front draped across the Northeastern United States on 10 July 2024. The most impactful aspect of this event was the river and flash flooding, some extreme, that generally occurred in a 30-40 mile wide band extending from Essex County, New York east-northeastward through portions of Addison, Chittenden, Washington, Lamoille, Caledonia and Essex Counties in Vermont. The excessive rainfall totals of 3 to 5 inches, with localized amounts exceeding 7.0 inches led to numerous areas of flash flooding. By the morning of July 11, Vermont Emergency Management had received nearly 700 reports of damage related to flooding with numerous roads and bridges impacted, and numerous swift water rescues. The secondary impact from this event was the scattered supercell thunderstorms, which produced wind damage, large hail, and frequent cloud to ground lightning. In conclusion, the weather events of July 10th and 11th will go down as one of the most impactful in our region in 2024, while also coincidently marking the 1-year anniversary of the Great Flood of 2023.

