 Email the authors
Introduction
A powerful storm system tracked across the eastern Great Lakes late on 31 October 2019 and produced an axis of 3 to 5 inches of rain, which caused significant flooding across our region. Record rainfall occurred at Burlington, Vermont with 3.30 inches on October 31st, along with a record high temperature of 71 degrees. In addition, very gusty southwest winds developed behind this potent storm, which generated scattered to widespread power outages. Surface wind gusts measured up to 65 mph across northern New York and parts of Vermont, with gusts over 100 mph at the summits.
The heavy rainfall washed out numerous roads and culverts from Essex County, New York into parts of central and northern Vermont, while 10 rivers reached flood stage with 8 reaching moderate to major levels. A new record high level of 14.72 feet was attained at North Troy on the Missisquoi River. Extensive flooding was observed in the following river basins: Missisquoi, Lamoille, Winooski, and Ausable, while flash flooding with very sharp rises of smaller streams and rivers occurred across the higher terrain of the eastern Adirondacks into central and northern Green Mountains of Vermont, including the Champlain Valley. A few observed storm total rainfall were 5.26 inches in East Berkshire, 4.85 inches in Enosburg Falls, 4.80 in Fletcher, 4.32 Wesford, and 4.0 inches in Elizabethtown, New York. Figure 1 below shows the storm total precipitation from 31 October at 8 AM to 1 November 2019 at 2 PM; note the very heavy rainfall axis of greater than 3 inches from Essex County, New York into most of central and northern Vermont. This highlights the areas with significant flooding.

Figure 1: Observed storm total rainfall from 8 AM EDT on 31 October to 2 PM EDT on 1 November 2019.[click to enlarge]
Meanwhile, the second significant impact from this powerful storm was the high winds, which caused scattered to widespread power outages across northern New York into Vermont. The core of the strongest winds occurred early morning on November 1st across New York and spread into Vermont during the daytime hours. At the peak, over 120,000 customers were without power across the region. Given how saturated the soils were from the recent heavy rainfall, shallow rooted trees were easily uprooted, exacerbating power outages. A few peak wind gusts included 69 mph at Ellenburg, 65 mph in Potsdam and 62 mph in Malone, New York, while a gust to 71 mph was measured in Johnson, 66 mph at Burton Island and 111 mph at Mount Mansfield in Vermont. Figure 2 below shows a map of observed peak wind gusts across the North County on 1 November 2019.

Figure 2: North Country maximum wind gust on Friday, November 1, 2019.[click to enlarge]
Synoptic Scale Ingredients for Heavy Rainfall
In this section we will examine the synoptic scale ingredients that came together to produce an axis of very heavy rainfall from the eastern Adirondack Mountains into the central and northern Green Mountains of Vermont, including parts of the Champlain Valley. This area received 3 to 5 inches of rainfall in a 6 to 10 hour window, resulting in significant flooding. The 300 hPa analysis indicating a potent jet couplet of 150 to 175 knots was lifting from the central Great Lakes into eastern Canada. This placed the North Country in a very favorable region of upper level divergence, which is indicated by the yellow lines (Figure 3), as a sharp upper level trough slowly moved eastward. This strong upper level divergence pattern produced large scale synoptic lift, helping to enhance heavy rainfall across northern New York and Vermont. Figure 3 below shows the 300 hPa upper air analysis on 1 November 2019 at 8 PM.

Figure 3: The 300 hPa upper air analysis on 1 November 2019 at 8:00 PM. Isotach (dark blue >75 knots, lighter blue >100 knots, and lightest blue >125 knots, streamlines (black), wind barbs, (plotted in blue, 1 pennant=50 knots, 1 barb=10 knots, 1/2 barb=5 knots), and upper level divergence (yellow lines).[click to enlarge]
Figure 4 below shows the mid level water vapor image at 11 PM on 31 October 2019. Several features in this image support the threat for very heavy rainfall, which include a deep conveyor belt of rich moisture, an area of enhanced upper level divergence, and a mid/upper level trough becoming negatively tilted across the central Great Lakes. This developing circulation promoted strong divergence in the upper level wind fields, while slowing the eastward progression of a well defined dry slot over western New York and Pennsylvania, as the low to mid level wind fields paralleled the flow aloft. The strong and deep southerly flow of 60 to 80 knots advected copious amounts of moisture along and ahead of the very slow moving cold front, which featured 2 to 4 convective fine lines with enhanced rainfall rates. Rainfall rates within these convective lines were 0.50 to 1.0 inch per hour. This resulted in areas of flash flooding and numerous roadways and culvert washouts, mostly in complex terrain. Meanwhile, in the urban interface, widespread street flooding developed due to the heavy rainfall rates and clogged storm drains from recently fallen leaves. Click here for a 7 hour water vapor loop from 7 PM on 31 October to 2 AM on 1 November 2019.
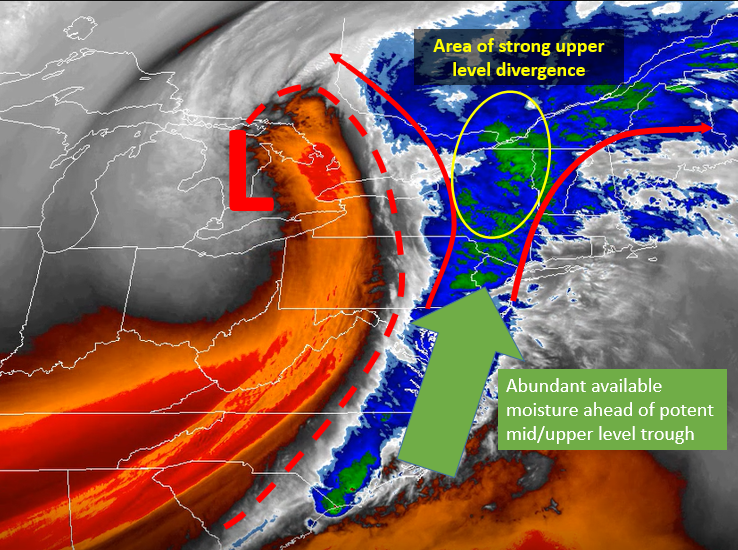
Figure 4: Mid level water vapor at 1100 PM on 31 October 2019.[click to enlarge]
The 850 hPa analysis on 1 November 2019 at 8 PM indicated low pressure just north of Lake Ontario, while a sharp cold front extended from low pressure into central and eastern New York. Ahead of this sharp boundary temperatures warmed well into the 60s to lower 70s, with dewpoints in the upper 50s to mid 60s. Burlington, Vermont recorded a record high temperature of 71 degrees on October 31st. In addition, to the very warm temperatures, a strong 850 hPa jet of 60 to 80 knots from the south/southwest was advecting deep layer moisture ahead of the surface cold front across northern New York into most of Vermont during the late evening hours on October 31st. This sharp/slow moving boundary and excellent low level convergence combined with favorable moisture and upper level wind fields to produce 3 to 5 inches of rainfall across portions of our forecast area. Figure 5 below shows the 850 hPa analysis on 1 November 2019 at 8 PM.

Figure 5: The 850 hPa upper air analysis on 1 November 2019 at 800 PM with 850 hPa (black lines), temperatures in degrees celsius (red lines >0 and blue lines <0), dewpoint (green lines), and wind barbs in knots.[click to enlarge]
The Albany, New York observed upper air sounding on 1 November 2019 at 8 PM showed deep moisture and very warm thermal profiles, creating an environment favorable for efficient rainfall processes and high rainfall rates. The measured precipitable water was 1.88 inches, shattering the previous record for the date of 1.47 inches. The freezing level was greater than 13,000 feet, leading to warm cloud depths of 10,000 to 12,000 feet, which was just another indication of the historic moisture and temperature profiles associated with this powerful storm system. Figure 6 below shows the upper air sounding at Albany, New York on 1 November 2019 at 8 PM.

Figure 6: Upper air sounding from Albany, NY at 8:00 PM on 1 November 2019.[click to enlarge]
Synoptic Review of Damaging Winds
Deepening low pressure of 986mb was located near Ottawa, Canada on 1 November 8 AM with a strong pressure gradient between the departing low pressure and building 1026mb high pressure over the southern Ohio Valley (Figure 7 lower left). In this image, the tightly packed black lines of equal pressure highlight the sharp pressure gradient and the potential for gusty surface winds. This powerful system produced a 3-hour pressure rise couplet of 6 to 8 mb across northern New York and Vermont during the morning hours of November 1st. In addition, a potent backside low level stinger type jet was present, with 850mb winds of 45 to 60 knots lifting across the North Country.[click to enlarge]
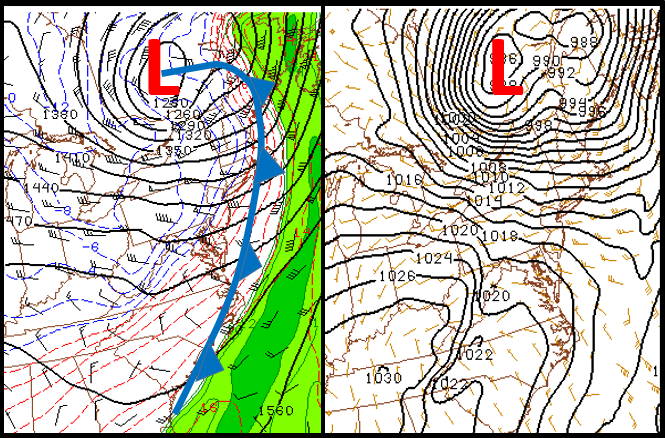
Figure 7: The 850 hPa upper air analysis (black lines), temperatures in degrees celsius (red lines >0 and blue lines <0), dewpoint (green lines), and wind barbs in knots (right panel and surface analysis with mean sea level pressure (black lines) and surface winds barbs in knots on 1 November 2019 at 800 AM. [click to enlarge]
Figure 8 shows the 8 AM Albany upper air sounding on 1 November 2019. This sounding supports favorable mixing from the surface through 850mb, along with increasing wind speeds with height. Also, note the precipitable water values decreased from 1.88 inches to 0.34 inches in 12 hours, emphasizing a significant change in the moisture profiles across the region, which promotes a favorable atmosphere for strong winds. The sounding shows wind speeds of 45 to 55 knots at 4500 feet, which with strong mixing supported locally localized gusts in the 45 to 55 mph range across northern New York into Vermont. The aligned southwest to northeast flow across the Saint Lawrence Valley created enhanced gusts up to 65 mph. In addition, downslope flow off the northern Adirondacks near Malone, NY and parts of the eastern slopes of the Greens near Cambridge, VT resulted in gusts in the 55 to 60 mph.

Figure 8: Upper air sounding from Albany, NY at 8:00 PM on 1 November 2019.[click to enlarge]
These strong winds combined with saturated soil to uproot trees and cause scattered to widespread power outages across northern New York into most of Vermont. Figure 9 below shows that at the peak there were almost 80,000 total outages, impacting over 120,000 customers. Green Mountain Power, the largest electric company in Vermont, reported over 115,000 customers were affected, making it a top 5 event for their company.

Figure 9: Power outage chart across northern New York into Vermont from November 1st through November 2nd.[click to enlarge]
Hydrologic Impacts and Flooding
The composite radar reflectivity loop below highlights several rounds of moderate rainfall developing during the late afternoon into the evening hours across northern New York into extreme northwest Vermont. Rainfall in the 4 PM to 10 PM time period on October 31st, was generally between 0.50 and 1.50 inches across northern New York into northern Vermont, with less than a half of an inch across central/southern Vermont. This initial band of moderate rainfall was associated with a potent warm front lifting from south to north across our forecast area, with temperatures warming well into the 60s to near 70 degrees, while dewpoints climbed into the mid 50s to lower 60s. This very warm and moist airmass interacted with a slow moving cold front later in the evening to produce additional rounds of moderate to heavy rainfall.

Figure 10: Multiple Radar Multiple Sensor (MRMS) composite reflectivity from 4 PM to 10 PM on 31 October 2019.[click to enlarge]
The next loop shows the composite reflectivity from 10 PM to 4 AM during the late evening into the early morning hours on 1 November 2019. This clearly highlights 2 to 3 rounds of moderate to heavy rainfall that developed from the eastern Adirondacks into central and northern Vermont. The brighter orange and red colors in the radar loop below indicates very heavy rainfall rates of 0.50 to 1.0 inch per hour. It's interesting to watch the loop which shows individual areas of enhanced reflectivity moving from south to north, while the entire line was very slowly moving west to east across our forecast area. This was a result of the surface boundary paralleling the mid/upper level flow aloft. Significant flash flooding occurred from Essex County, New York into the mountainous terrain of central and northern Vermont, including portions of the Champlain Valley. In addition, the very heavy rainfall rates resulted in numerous roads closed across the urban areas of the Champlain Valley, as storm drains became clogged with leaves and overwhelmed by the amount of water in a short period of time.
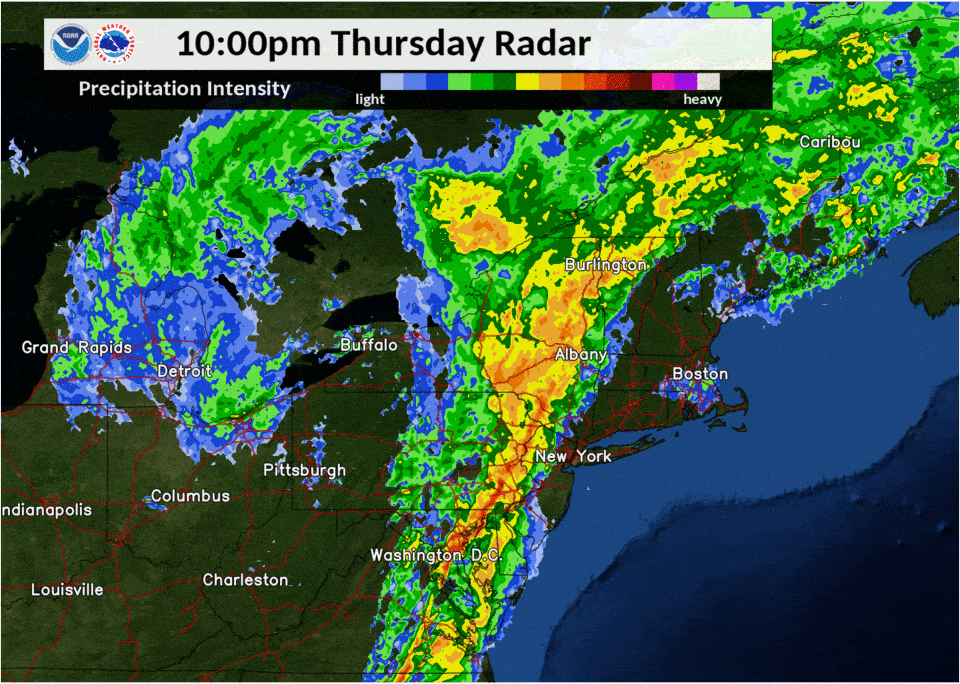
Figure 11: Multiple Radar Multiple Sensor (MRMS) composite reflectivity from 10 PM to 4 AM on 31 October into 1 November 2019.[click to enlarge]
The flooding was twofold across the North Country, with both flash flooding and river flooding occurring. As noted above, several convective lines moved across the region, and the first flooding reports came from the first as it crossed the Champlain Valley into the northern Green Mountains. Rainfall rates in these convective lines approached 1 inch per hour. The earliest flooding reports of the night came in from the Burlington area, where numerous streets where covered with several inches of water as leaf-clogged culverts became overwhelmed. Things ramped up quickly thereafter as a wide swath of rain pivoted across eastern NY and north central Vermont ahead of the slow-moving front. This heavy rain persisted for several hours during the overnight, resulting in rainfall totals of 3 to 5 inches, as seen in Figure 1. This resulted in numerous areas of flash flooding and road washouts.
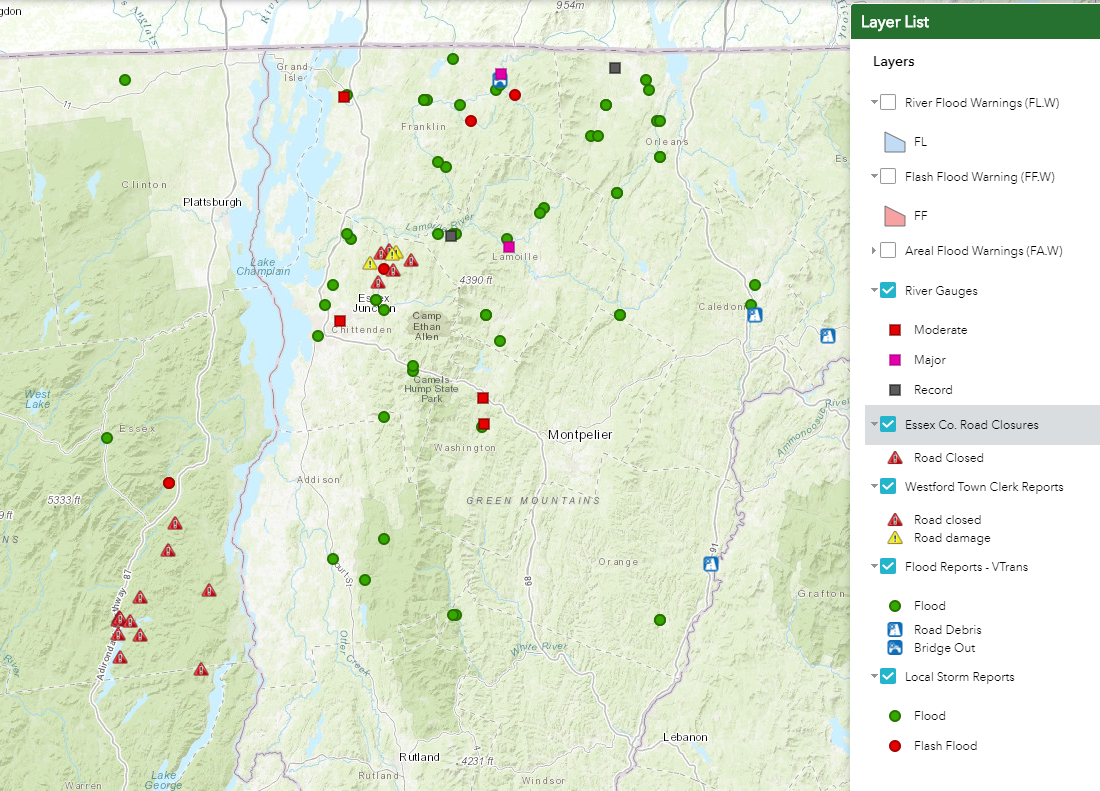
Figure 12: Map of flooding reports[click to enlarge]
In addition to the areal and flash flooding, significant river flooding occurred, particularly in the Lamoille, Missisquoi, and lower Winooski River Basins. Rivers and streams rose several feet in just a few hours, spilling out of their banks and flooding surrounding fields, homes, and roads. Of the 7 river gages that rose above flood stage, 3 exceeded moderate state, 2 went into moderate stage, and 2 set new records. The river gage at North Troy set a new record stage of 14.72 ft, while downstream the Swanton gage narrowly missed tying its previous record stage by just 0.01 ft. On the Lamoille River, the relatively new Jeffersonville gage also set a record of 454.5 ft.

Figure 13: Selected hydrographs for area river gages[click to enlarge]
All in all, millions of dollars in damage was done from the hydrologic side of this storm alone. Numerous local and state roads were damaged or destroyed. Homes were surrounded by floodwaters and high water rescues were undertaken. Numerous persons in the Burlington area reported water in their basements. Travel was severely impacted in the affected areas for the morning commute on November 1, as more than a dozen state roads and numerous local roads were closed. The state of Vermont is working toward a Federal Disaster Declaration at the time of this writing.
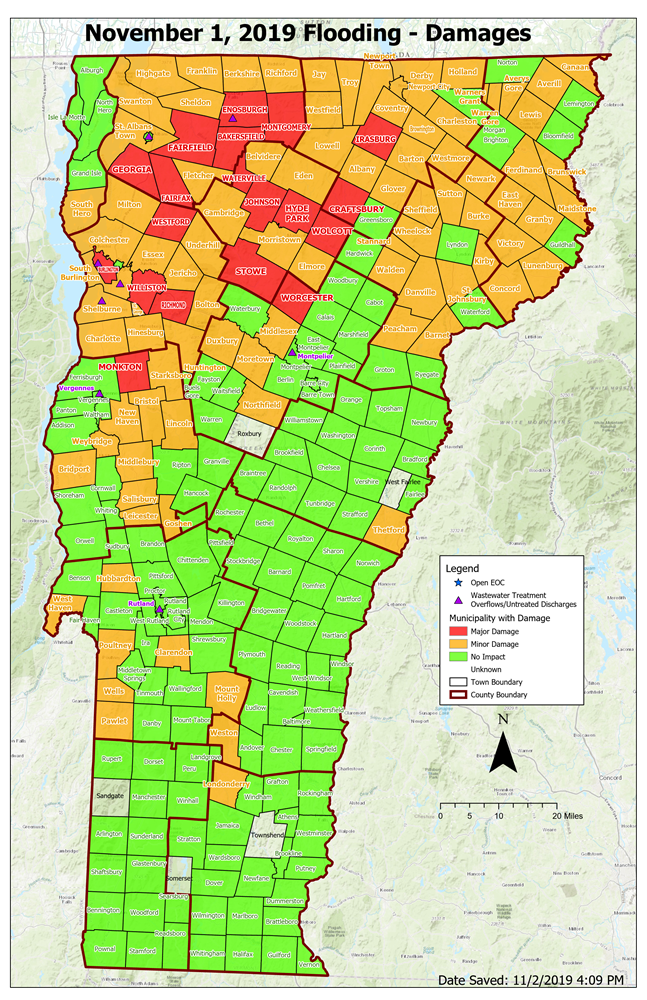
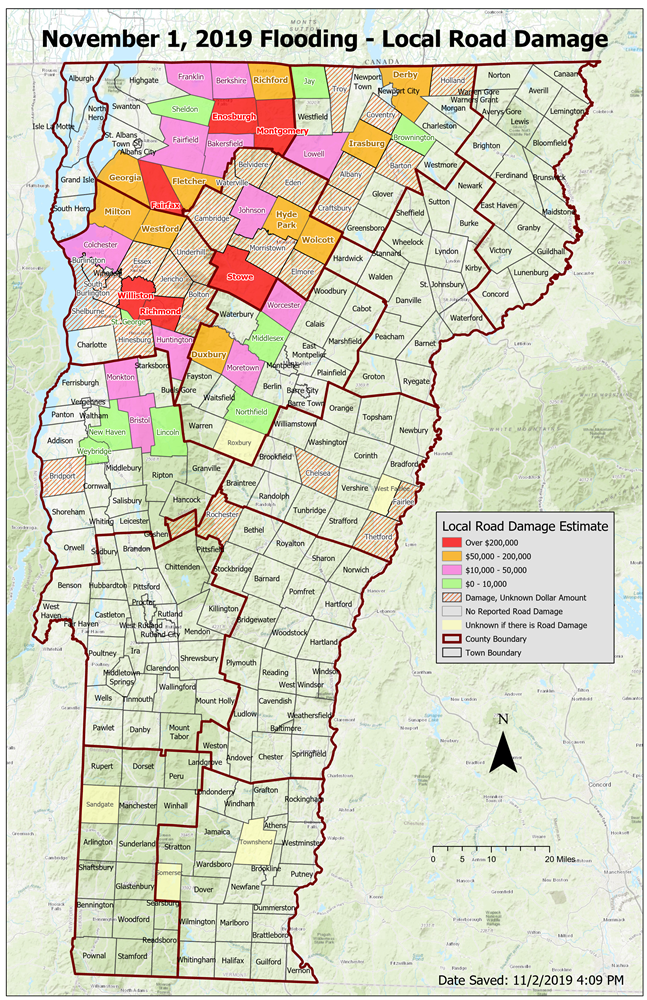
 Figure 15: Selected flood damage pictures[click to enlarge]

