 Email the authors
For much of the 2024-2025 Winter Season, large-scale winter storms have been absent across the North Country. Much of the season’s snowfall has consisted of clipper systems producing quick bursts of snow, lake effect snow showers, or regional upslope snow showers across western mountain slopes creating sharp contrasts between lower elevations with little snow and areas at or above 1500 feet elevation with snow packs one to two feet above normal. Finally, on 15-16 February 2025, a strengthening surface low crossed the Ohio River Valley, with a secondary low deepening below 980 mb as it tracked off the New England Coast late on 16 February 2025. An amplified upper ridge across the eastern US and meridional jet along its western periphery connected the New York and New England region to an atmospheric river producing significant snowfall amounts of 9 to 16 inches, locally up to 18 across the northern tier (Fig. 1).
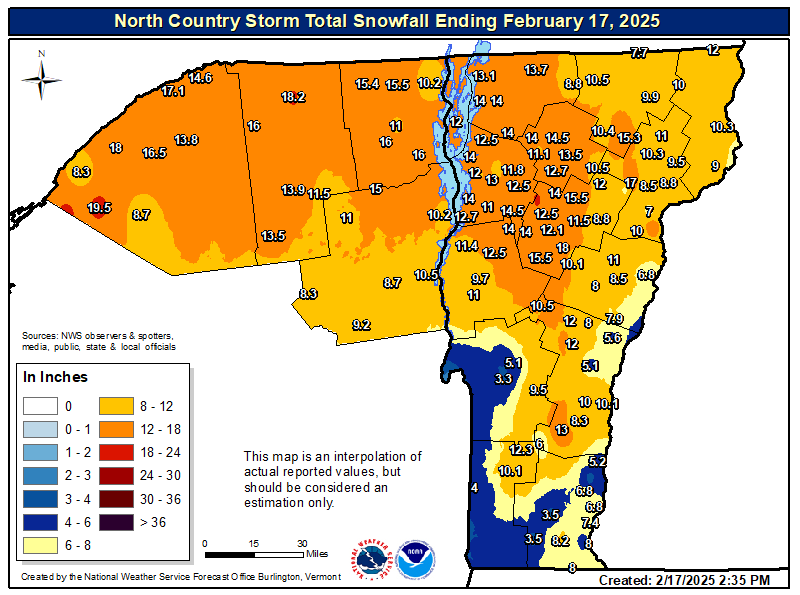
Figure 1. Storm total snowfall reports (in inches) received for the period 2pm EST February 15th through 2pm EST February 17th. Note, sleet is included in snowfall tally. [click to enlarge]
However, the strong south-southwesterly low-level jet also transported warm air aloft across parts of the Adirondacks and Vermont. This warm air aloft produced periods of sleet and freezing rain from mid-morning through mid-afternoon on Sunday, 16 February, mainly across Essex County NY and central and southern Vermont. Additionally, the strength of low pressure produced areas of strong winds ahead of and behind the system. Downslope wind gusts up to 49 mph were observed at Rutland, Vermont on the morning of 16 February. Blizzard conditions and wind gusts up to 53 mph were observed at Massena, New York while St. Lawrence County enacted a travel ban due to adverse weather. On the backside of the storm system, gusty winds were observed areawide on Monday 17 February, in some cases exceeding 50 mph.
This review describes the synoptic environment and evolution, the wintry mix, strong winds, and impacts of the 2024-2025 season’s strongest winter storm to date.
Snow began across the North Country during the mid-late afternoon hours on Saturday, 15 February 2025. This snow occurred north of a developing frontal zone across western and central New York at 4pm EST (21 UTC) (Fig. 2) and on the leading edge of the 850mb warm advection (Fig. 3). Road conditions were already treacherous during the evening hours; by midnight, a general 2 to 5 inches of snow had fallen across much of northern New York and Vermont. Some dry air to the southwest lifted north ahead of a deepening low pressure which briefly paused snowfall overnight into early Sunday 16 February 2025.
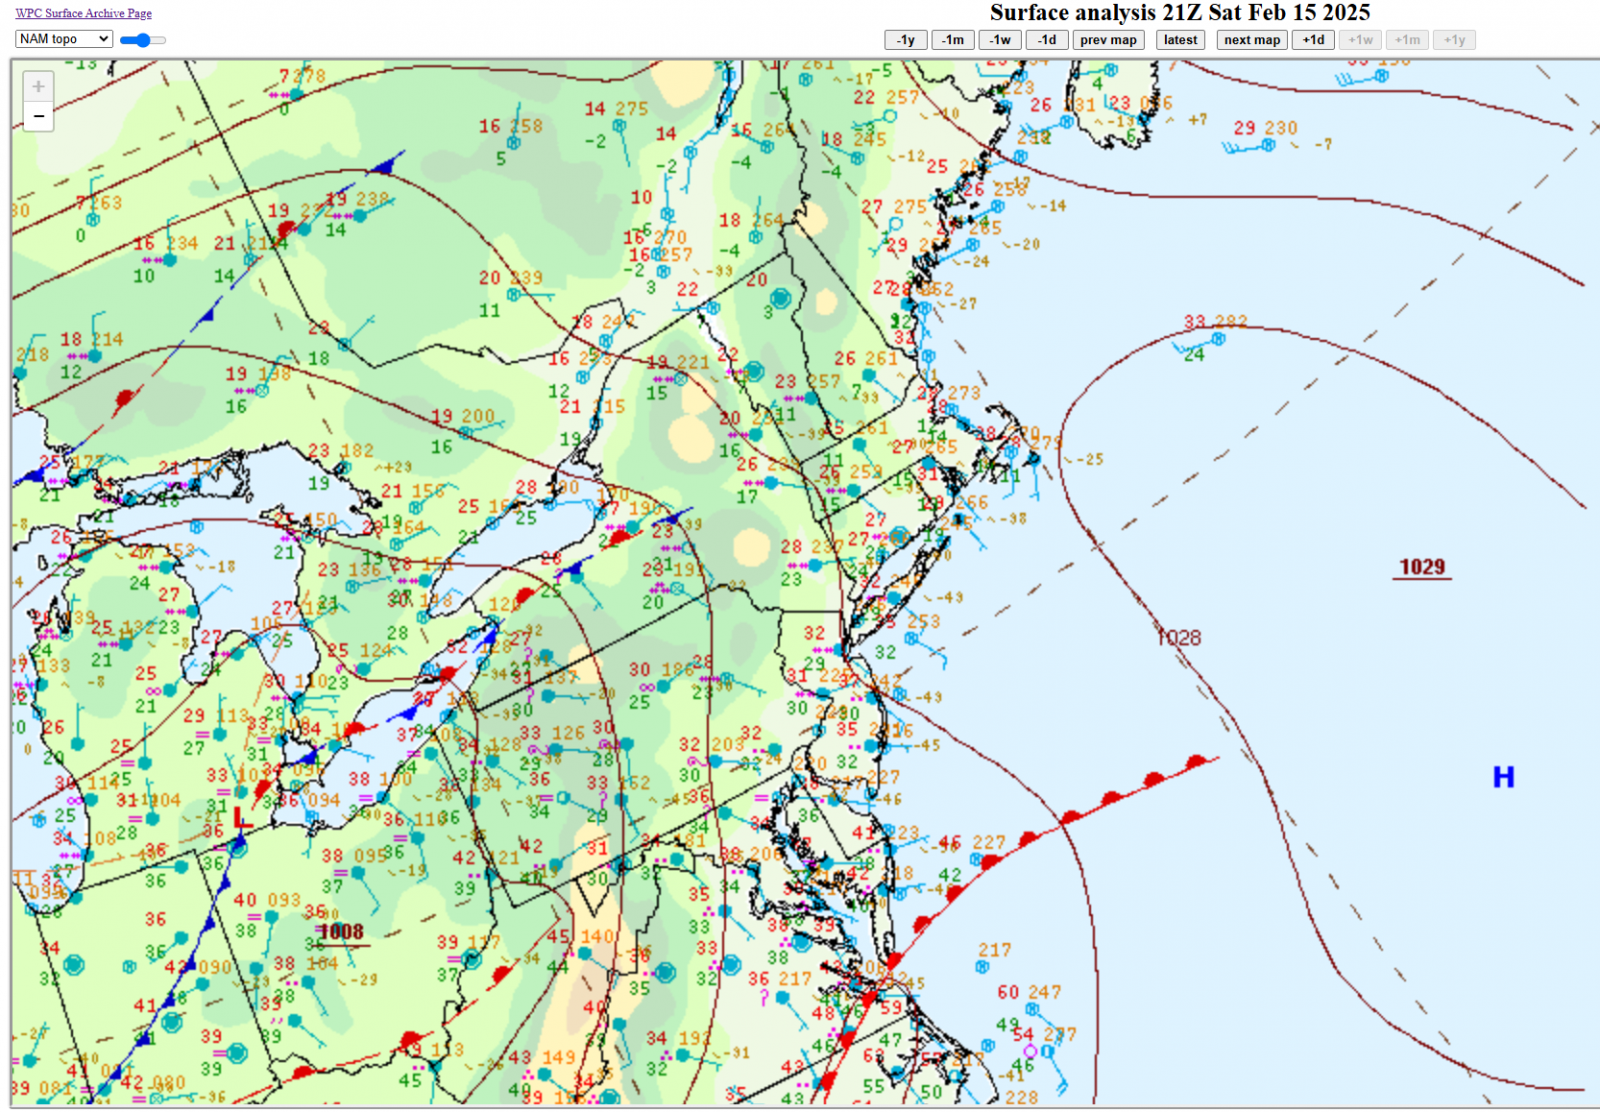
Figure 2. The WPC surface analysis for 4pm EST (21 UTC) on 15 February 2025. [click to enlarge]
Figure 3. The RAP-based SPC Mesoanalysis valid at 21 UTC on 15 February 2025. Shown are the 850mb geopotential heights (black solid lines, decameters), the 850mb temperature (red dashed lines, in degrees Celsius, and the 850mb temperature advection (shaded with red showing areas of warm air advection and blue showing areas of cold air advection). [click to enlarge]
Between 7pm EST on 15 February and 7am EST on 16 February 2025, the primary surface low would strengthen quickly as it tracked along a 925mb frontal zone from northeastern Arkansas to eastern Ohio/Western Pennsylvania (Fig. 4). In addition to the low-level baroclinicity, the low pressure system was located in the favorable right entrance region of the upper tropospheric jet, which also is favorable for development (Fig. 5)
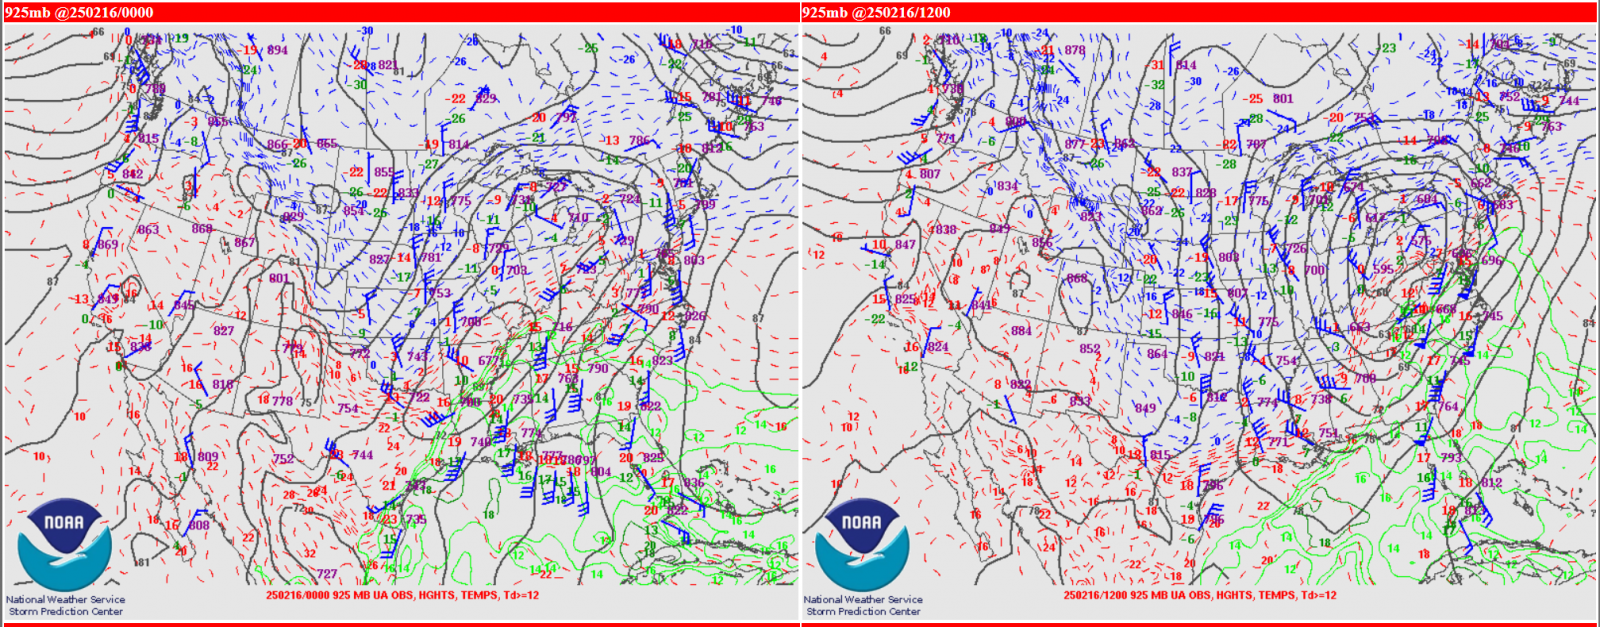
Figure 4. The 925mb upper-air analysis valid at 00 UTC (left panel) and 12 UTC on 16 February 2025 (right panel). [click to enlarge]
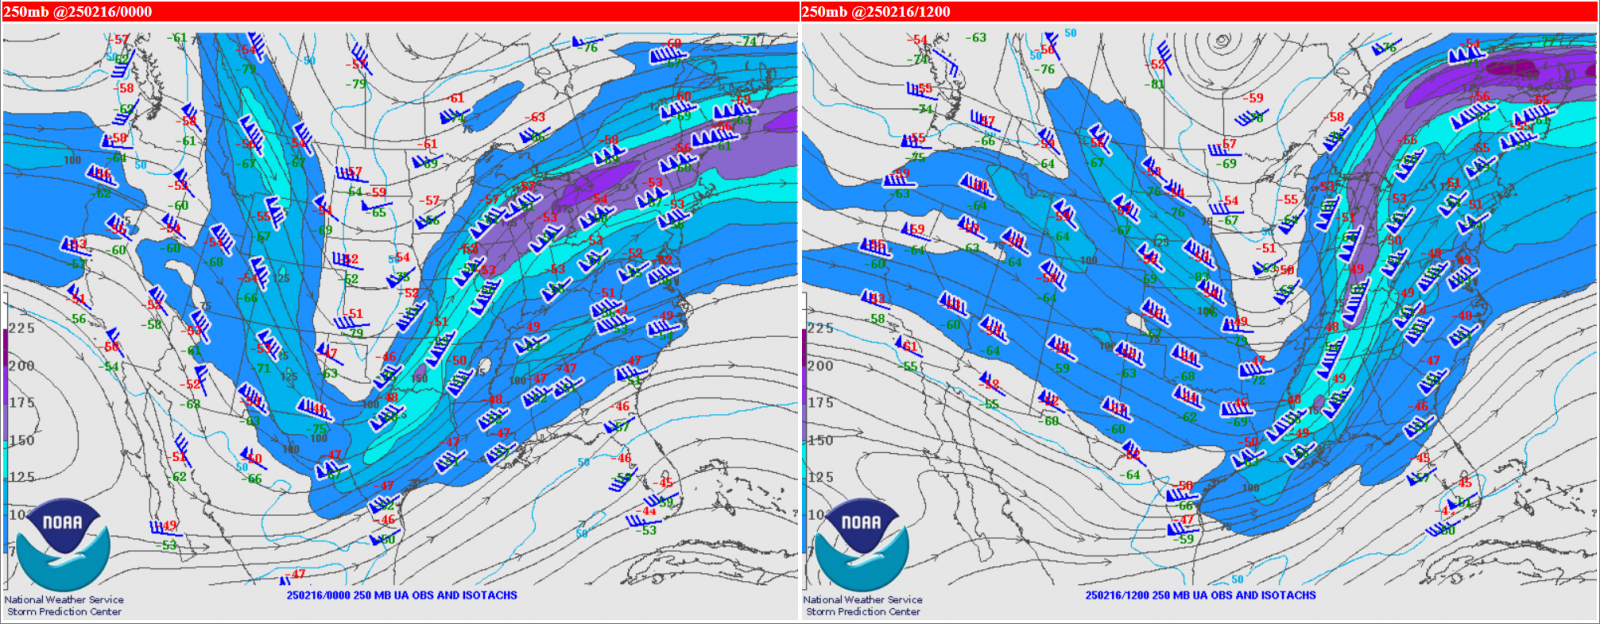
Figure 5. The 250mb upper-air analysis valid at 00 UTC (left panel) and 12 UTC on 16 February 2025 (right panel). Isotacs (knots) are shaded starting at 75 knots and at 25 knot increments per the legend in the lower left of each image. [click to enlarge]
By 7am EST (12 UTC) on Sunday 16 February 2025, the primary surface low was located over western Pennsylvania and was continuing to deepen as it headed northeastward (Figure 6). Mixed wintry precipitation was observed across central New York and as far north as Glens Falls, but the Burlington forecast area remained all snow at this time. Meanwhile, a secondary trough and incipient coastal low was noted across southern New Jersey, with minimum sea-level pressure of around 1001mb. This coastal low would deepen rapidly over the ensuing 12-24 hours.
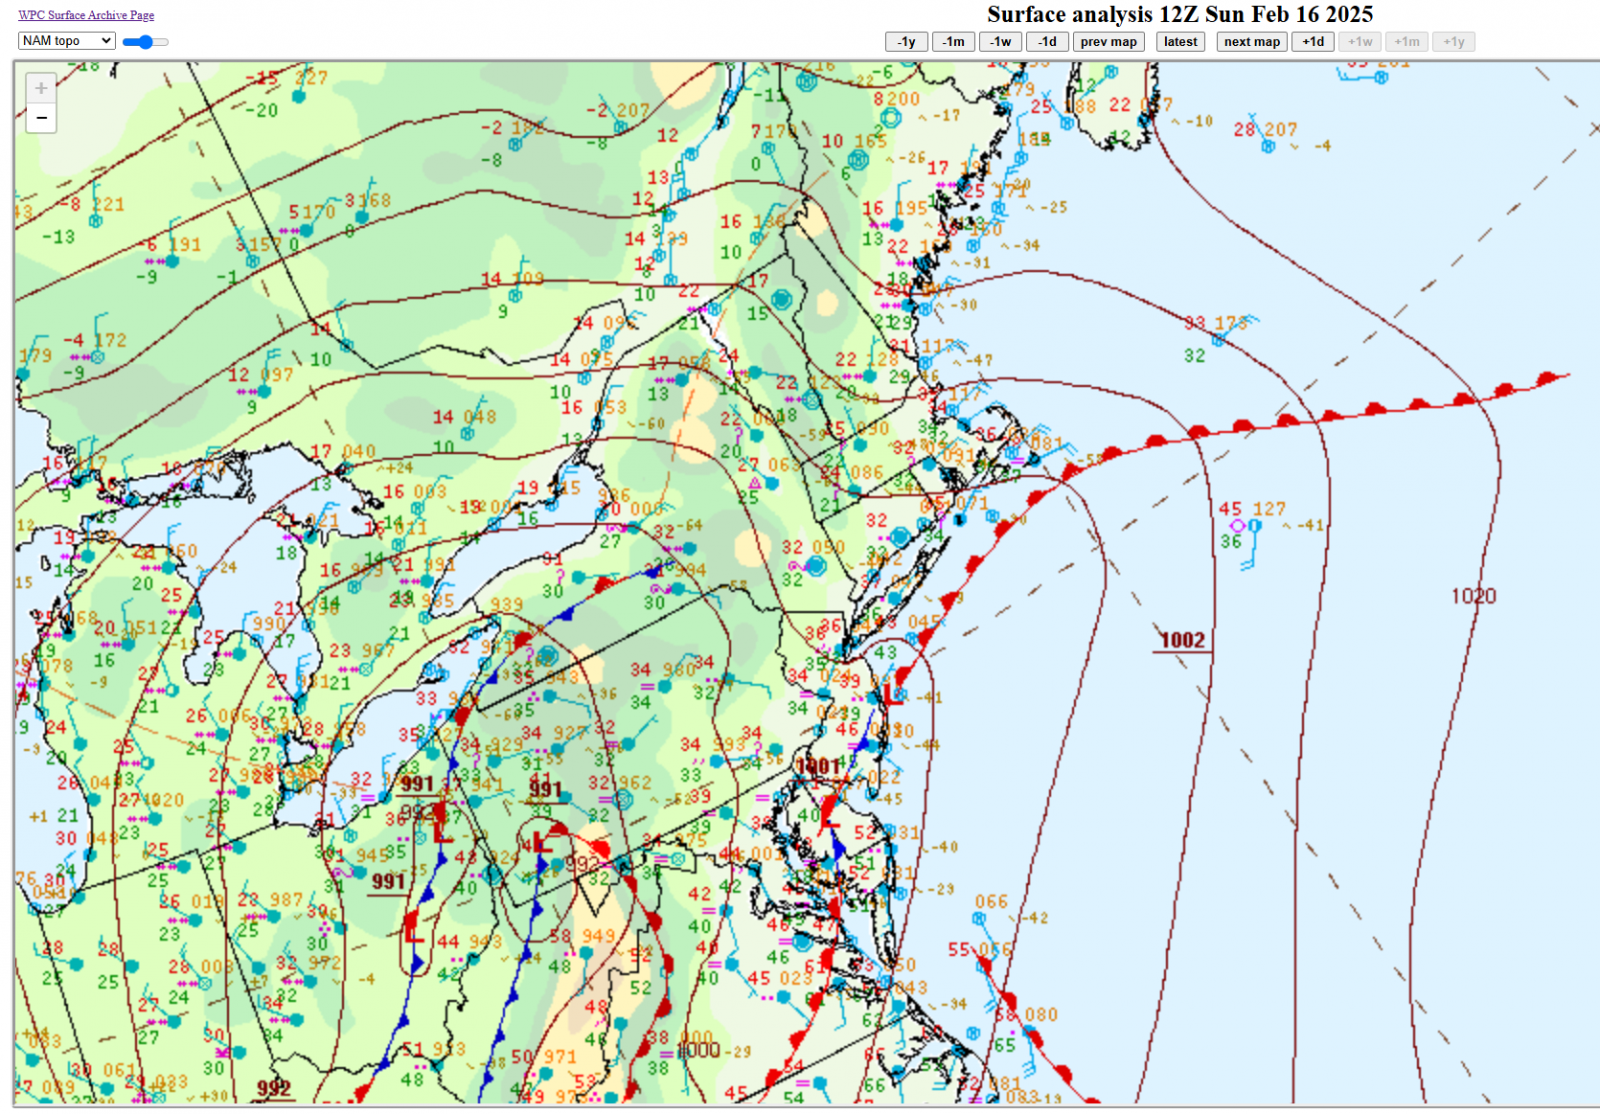
Figure 6. The WPC surface analysis for 7am EST (12 UTC) on 16 February 2025. [click to enlarge]
Due to an above freezing layer aloft while the near-surface air remained cold, ice pellets (or sleet) were observed across southern portions of the BTV forecast area. This sleet (and localized freezing rain) ultimately cut down on snowfall accumulations across portions of central and southern Vermont. Sleet made it as far north as the Burlington International Airport (KBTV) between roughly 12:30 - 3 pm EST (1730 - 20 UTC). After that time, development of the secondary surface low pressure system near the coast cut off the strong south-southwesterly winds and prevented a further north progress of the warm layer aloft. In fact, cooling conditions aloft, through increased vertical motion, allowed mixed precipitation to change back to snow during the latter half of the afternoon and through the evening hours. Meanwhile, most locations across far northwestern Vermont and most of northern Adirondacks and St. Lawrence Valley remained snow throughout the event. An analysis of freezing rain reports (Fig. 7) shows just 0.02” and 0.01” flat ice accumulation at Rutland (KRUT) and Springfield (KVSF), respectively. Higher ice accumulations were recorded in far southwestern Vermont and across the Hudson and Mohawk valleys of New York.
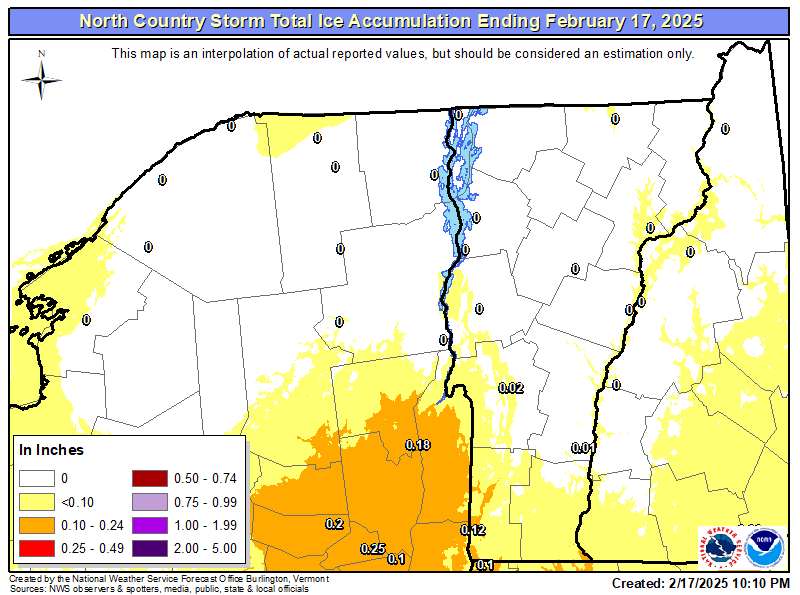
Figure 7. Storm total ice reports (in inches) received for the period 2pm EST February 15th through 2pm EST February 17th, 2025. Note, that most of the ice occurred during the morning and early afternoon hours on 16 February 2025. [click to enlarge]
The dual pol radar-based correlation coefficient (CC) is a useful product to identify areas of mixed wintry precipitation. The CC helps determine if precipitation targets have the same shape or type (e.g., snow), or if there is a mixture of precipitation types present. At 12:49pm EST (1749 UTC), the KCXX radar indicated an area of mixed phase precipitation in a layer 6500-8500ft above radar level (ARL) (Fig. 8). Note that this semicircle of mixed phase precipitation surrounding the radar doesn’t appear north of KCXX. The poleward edge of the semicircle of lower CC values denotes where the snow/sleet line was located at this particular time. Meteorologists at NWS BTV were able to monitor the northward progression of the sleet via the CC product and corroborate this with surface observations during the morning and early afternoon hours on Saturday, 16 February.
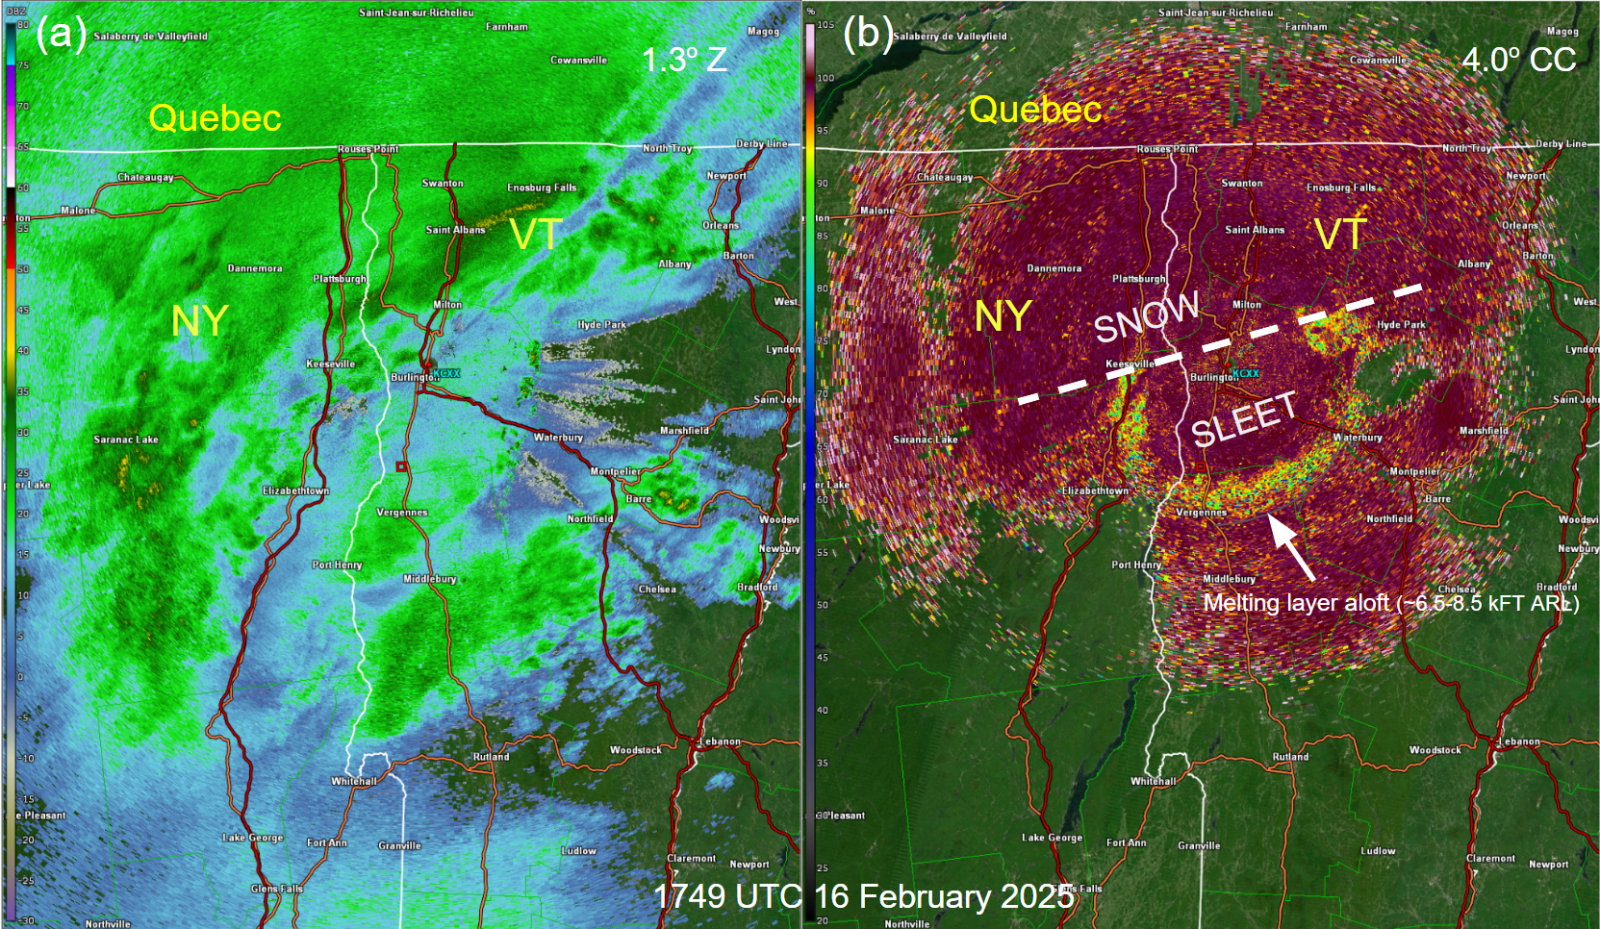
Figure 8. The KCXX (a) 1.3° reflectivity (dBZ) and (b) 4.0° correlation coefficient (CC) at 1749 UTC on 16 February 2025. The melting layer and approximate snow/sleet line is annotated in the CC image.[click to enlarge]
By 4pm EST (21 UTC) on 16 February 2025, the secondary (coastal) low was beginning to take over with pressure almost as deep as the primary low over south-central New York (~983 mb) (Fig. 9). The development of a coastal circulation would help cut off the advection of above-freezing air aloft into the North Country, and dynamic cooling would allow the precipitation to transition back to snow from northwest to southeast across central Vermont. On a related note, many of the numerical models had a deeper primary low (closer to 970 mb) that would hold on longer than what occurred. This resulted in less mixed wintry precipitation across far northern Vermont than had been forecast in the day or two leading up to the event.
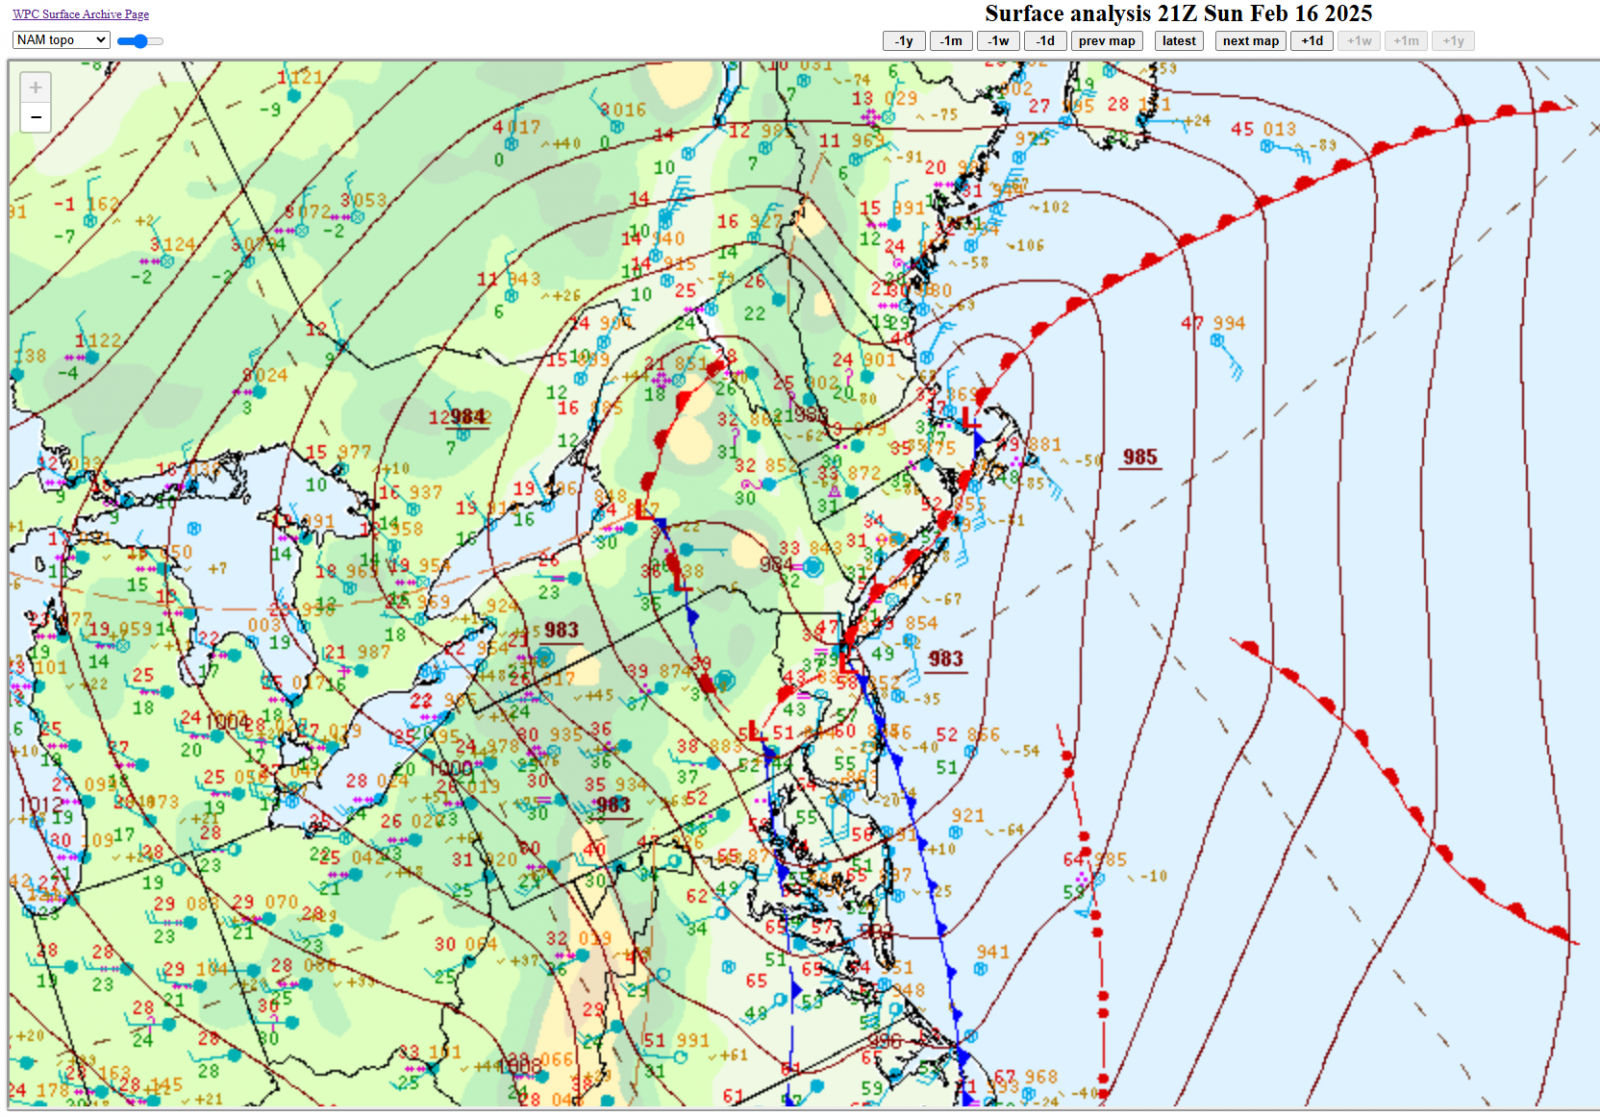
Figure 9. The WPC surface analysis for 4pm EST (21 UTC) on 16 February 2025. [click to enlarge]
Blizzard conditions were observed in the St. Lawrence Valley of New York on 16 February 2025. Wind gusts at or above 35 mph were largely a function of channeled northeasterly flow directed toward the approaching (primary) low pressure system, which was moving northeastward from western Pennsylvania into western New York during the morning hours on 16 February 2025. At Richards Field in Massena, New York (KMSS), wind gusts of 35 mph or higher were first observed around 8am EST (13 UTC) on 16 February 2025 with visibilities approaching 0.25 statute miles (Fig. 10). Four consecutive hours of gusts greater than 35 mph were observed 10:53am (1553 UTC) through 2:53pm EST (1953 UTC) in conjunction with heavy snow and visibility at or below 0.25 statute miles (SM). The highest wind gust of 53 mph at KMSS was observed at 12:02pm EST (1702 UTC), and occurred in conjunction with visibility of only 1/8 SM. The 2-meter temperature at KMSS was in the mid-teens, adding to the severity of winter weather conditions during this time frame.
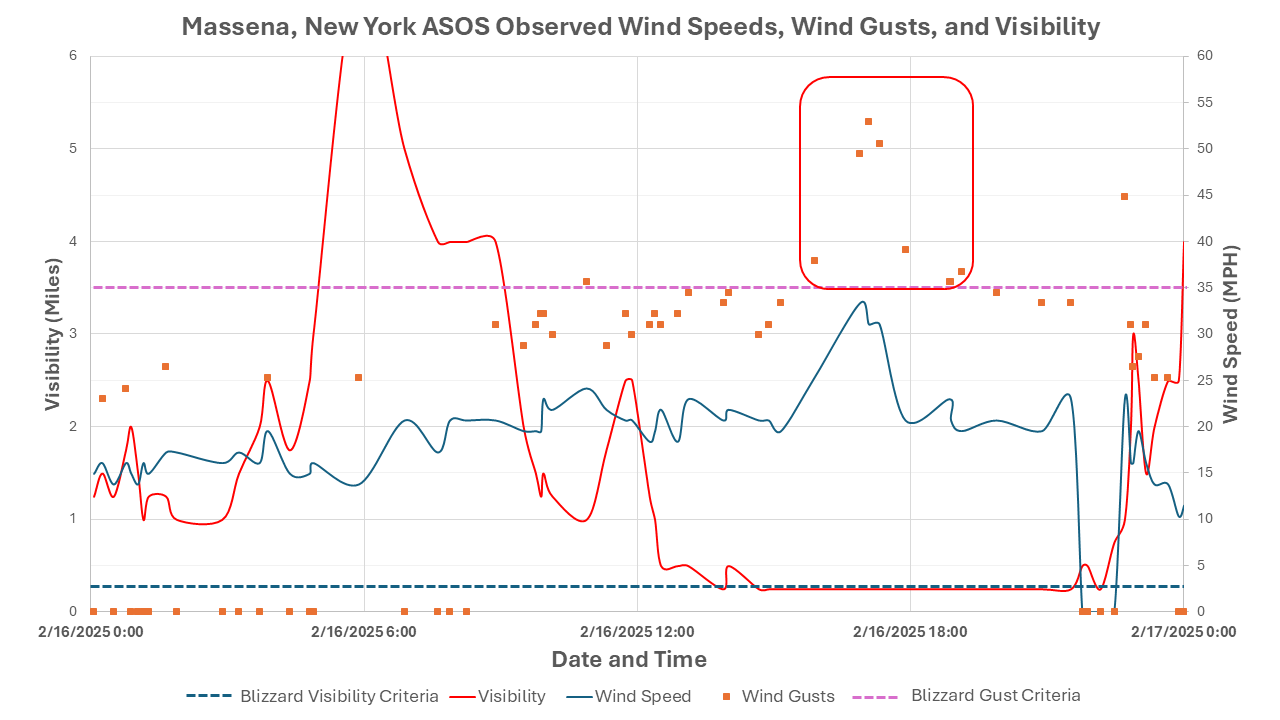
Figure 10. Time series analysis of Massena, New York observed wind speeds (blue solid line), wind gusts (orange squares) and visibility (red solid line) between 00UTC on 16 February 2025 and 00 UTC on 17 February 2025. The visibility scale is shown along the ordinate on the left side of the graphic, in statute miles. The wind speed scale is shown along the ordinate on the right side of the graphic, in miles per hour. The blizzard visibility and gust criteria are denoted as dashed horizontal lines at 1/4 statute mile and 35 mph, respectively. A red box highlights the period where both conditions were met.[click to enlarge]
As noted earlier, the secondary low developed more quickly with the parent low also taking a track farther to the south (Fig. 9). This had the impact of producing stronger northeast winds at Massena, but conversely decreased east to southeast downslope winds across western slopes of the Green Mountains. RAP analysis at 18 UTC indicated 850mb winds peaked about 45 knots (not shown). Figure 11 shows the RAP forecast sounding that suggested there would be stronger flow aloft. Additionally, an easterly wind is not able to channel as effectively through the regional topography as a southeast wind. The strongest observed wind at KRUT was 49 mph with lower magnitude gusts north along the spine of the Greens. Weaker flow compared to model forecasts resulted in a bias towards more freezing rain and sleet than was observed.
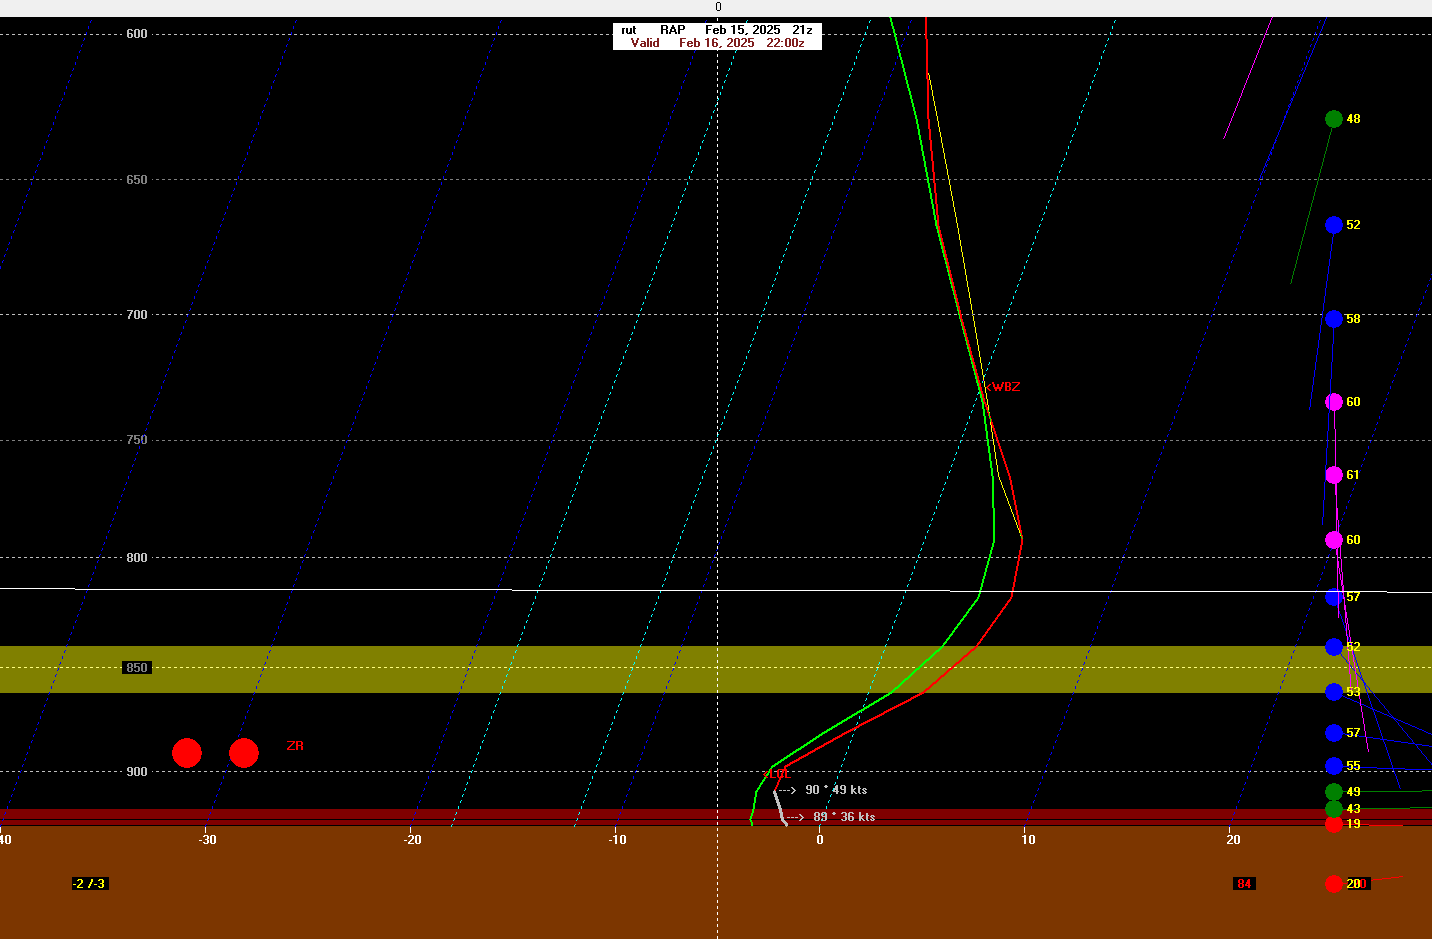
Figure 11. The 5pm EST (22 UTC) 15 February 2025 RAP forecast for Rutland, VT (KRUT) valid 22 UTC February 26 2025 when downslope winds were expected to be strongest on a Skew-T. The red line indicates temperature, the green line indicates dewpoint, and the mixed layer near the ground is highlighted in gray. Colored wind barbs at different levels are plotted on the far right with their speed in knots.[click to enlarge]
Ahead of the storm, forecasts for winds aloft ranged between 55 and 65 knots as the system would depart. Post storm westerly and northwesterly winds would peak during the daylight hours on Monday 17 February 2025, a function of steep low-level lapse rates in strong cold advection, which promoted efficient downward momentum transfer to the surface. Some notable maximum wind gusts included 66 mph at the VTRANS site near Jay Peak, 54 mph at the Springfield airport, and 53 mph at the Knapp State Airport in Barre-Montpelier. An analysis of peak wind gusts received for the period 16-17 February 2025 is shown in Figure 12. Power outages in Vermont peaked just above 4000 customers during the mid-afternoon hours on 17 February. Considering the amount of snow and strength of the winds, these impacts pale in comparison to the many wet snow events from recent years.
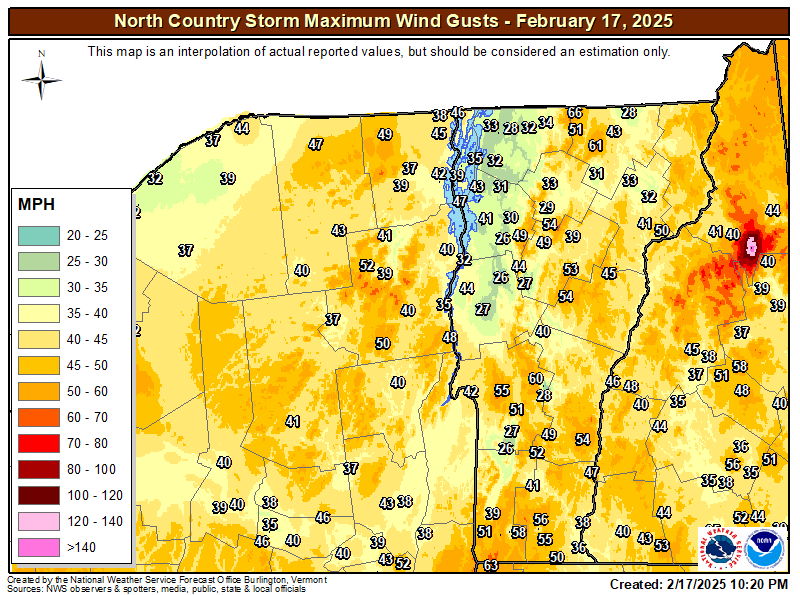
Figure 12. Observed wind gusts (mph) received by the National Weather Service on 17 February 2025 across Vermont, northern New York, and surrounding areas. [click to enlarge]
The blustery conditions led to low wind chill values, making post-storm snow removal rather unpleasant. With temperatures in the single digits and low teens, the strong winds resulted in wind chill values of 5 to 15 below in most valley locations throughout the morning hours on 17 February. There was some improvement by afternoon as temperatures increased and winds slowly abated.
The 15-17 February 2025 will be remembered for its long duration of accumulating snow, along with periods of sleet and high winds in some locations. It will also be remembered for generating deep snow depths across the region, on the heels of prolonged cold and moderately snowy conditions throughout January and the first half of February 2025. Snow initially broke out Saturday afternoon with the first wave of low-level warm advection and isentropic ascent. That snow would generally accumulate 2-5” by midnight across the North Country. The strong forcing directly tied to the low pressure system arrived Sunday morning, producing periods of heavy snow and mixed precipitation through the daylight hours on Sunday. As low pressure redeveloped near the south coast of New England, precipitation changed back to snow later Sunday afternoon and evening before ending during the overnight hours. Strong gradient flow on the backside of the system produced blustery conditions across all of Vermont and northern New York throughout the daylight hours on Monday.
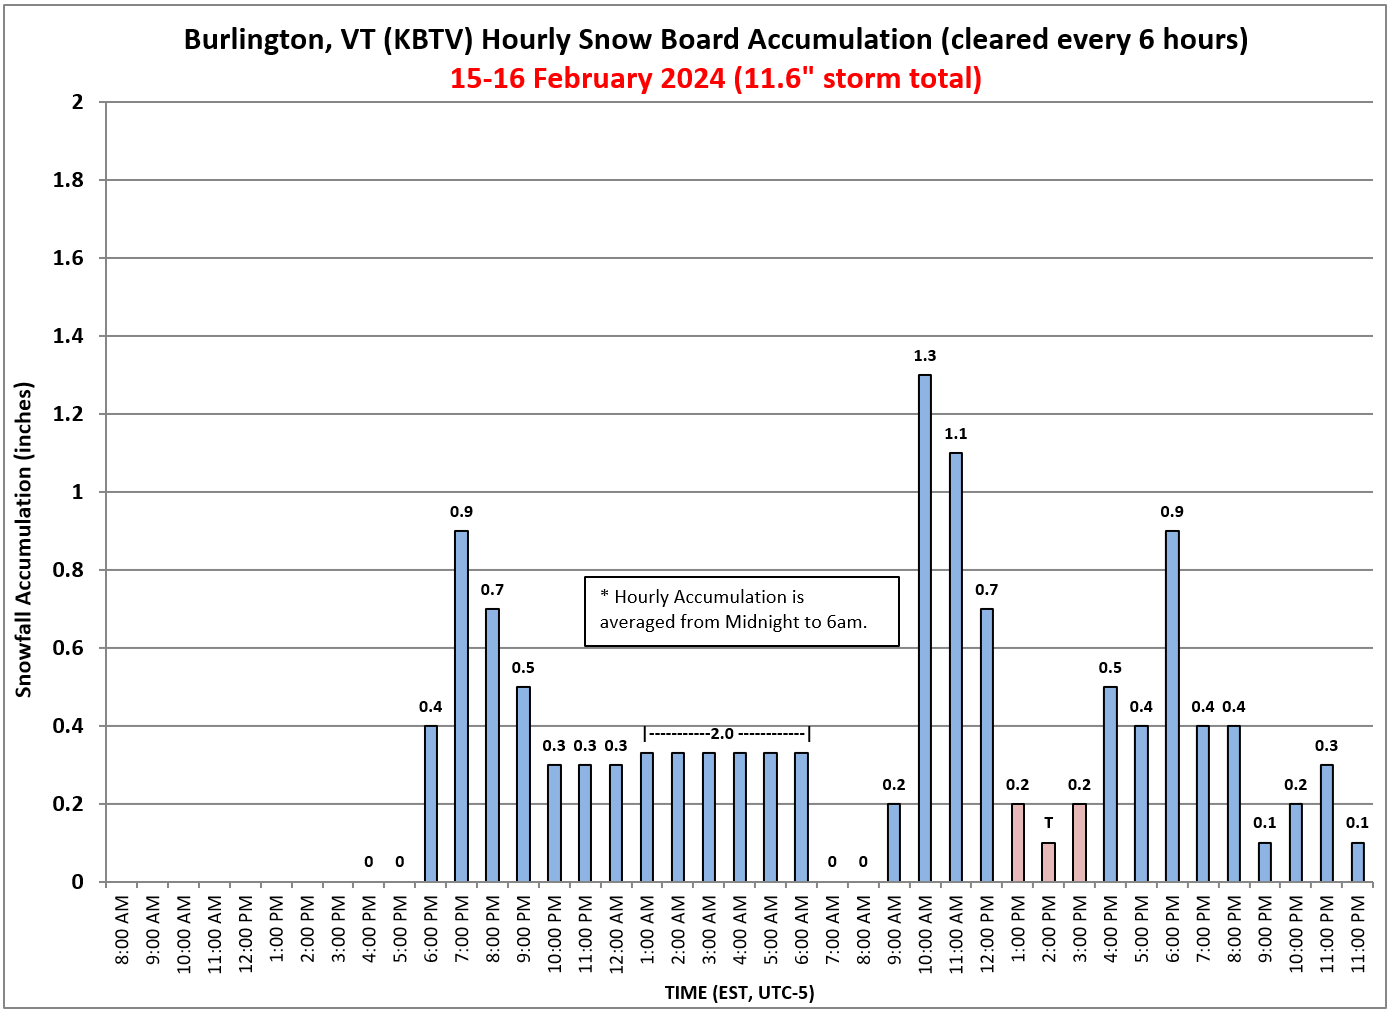
Figure 13. Hourly snowfall accumulation on the snow board at BTV on 15-16 February 2025. Hours with observed mixed precipitation (sleet) shown in magenta. Note that due to compaction, the sum of the hourly snowfall amounts is greater than the storm total snowfall. [click to enlarge]
Blizzard conditions were observed locally in the St. Lawrence Valley, including a 53 mph wind gust at Massena. On the back side of the system, strong gradient flow yielded blustery conditions and difficult conditions for road cleanup during Monday, 17 February. Fortunately, the storm struck over a three-day weekend, mitigating the severity of impact on commuters.
Total snowfall accumulations ranged from 12-18” across the St. Lawrence Valley, the northern Adirondacks, and much of the northwestern quarter of Vermont. Snowfall amounts were generally less than a foot across s-central VT due to a more significant period of mixed wintry precipitation (i.e., sleet and freezing rain) and also less than a foot across northeastern Vermont and the upper Connecticut River Valley due to shadowing effects off the White Mountains of New Hampshire. While not of historical significance, the 11.6” snowfall observed over two days at Burlington International Airport was the 4th largest since the 2019-2020 winter. The heaviest snowfall accumulations occurred in three separate surges: Saturday evening (2/15), mid to late morning Sunday (2/16), and during the early evening hours on Sunday (2/16) (Figure 13). Combined with existing snow on the ground, snow depths reached 12-20” in the southern Champlain Valley (including 19” at KBTV) and generally 20-40” elsewhere across the North Country (Figure 14). For parts of the North Country, these were some of the largest snow depths observed in many years. At KBTV, the 19” snow depth is the highest since a 20” snow depth was recorded on 15 March 2017. At a CoCoRaHS site northwest of Waterbury, Vermont, the 34” snow depth recorded following this storm was the highest since 11 March 2011 (the snow depth briefly reached 39.5” following the 7 March 2011 Winter Storm.
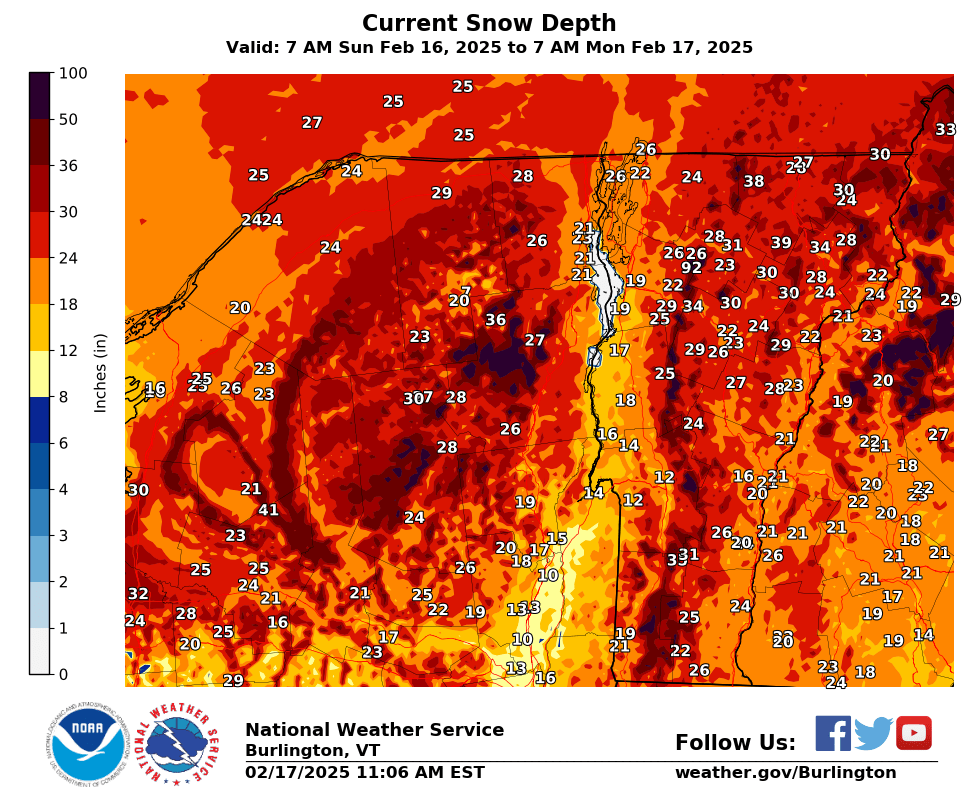
Figure 14. Observed snow depths, in inches, at 7am EDT (12 UTC) on 17 February 2025. [click to enlarge]

