 Email the authors
July 21st, 2022 was one of the most active severe days across the BTV forecast area in over 4 years with 15 warnings and over 30 reports of severe weather reported to the National Weather Service. This event is very unique given that northern New York saw very little thunderstorm activity while Vermont had numerous long-tracked supercells move through the state. Anomalously warm temperatures in the middle of a 6-day heat wave, yielded impressive amounts of instability across the region, adding fuel for the storms and resulting in a very active severe day for Vermont. Almost every county in Vermont reported wind damage (see Figure 1 for a map), and several supercells tracking across the state dropped very large hail in addition to the damaging winds.
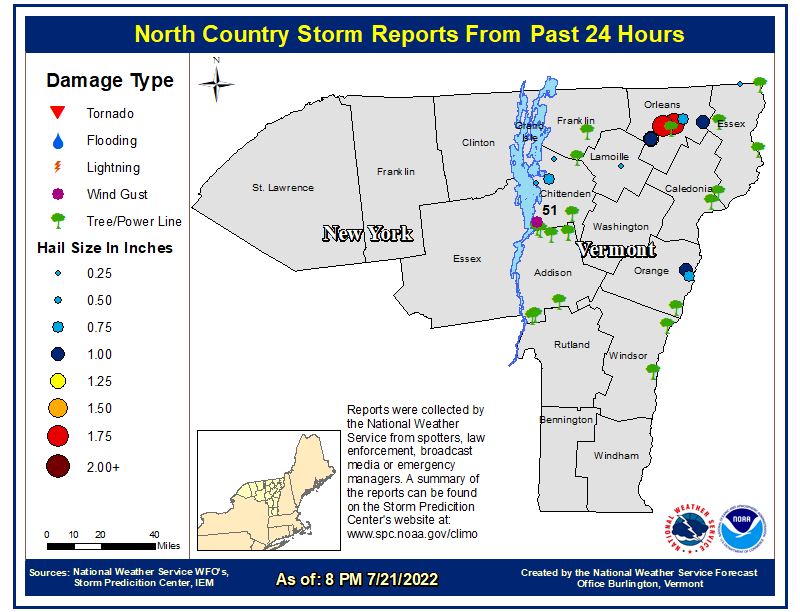
Figure 1: Severe reports received for 21 July 2022. Especially noteworthy is the widespread tree damage across Vermont as well as the large hail reports in Orleans County, VT.[click to enlarge]
Part I: Environmental Analysis
Surface analysis from the morning of the severe event (Figure 2) showed a low-pressure system centered just south of James Bay, with our forecast area solidly within the warm sector of the cyclone. A cold front was analyzed to our west as of 12Z (8 AM EDT), with a pre-frontal trough evident ahead of the cold front (not shown on WPC analysis). Temperatures stayed very warm overnight, with many 12Z observations reporting temperatures already in the mid to upper 70s and dewpoints in the upper 60s to around 70. Within the primed unstable atmosphere, the main forcing mechanisms for several rounds of thunderstorms that day were expected to be the prefrontal trough, which was set to move through mid-day, and eventually the cold front passage that would occur later into the afternoon/early evening and was expected to force an additional round of thunderstorms.
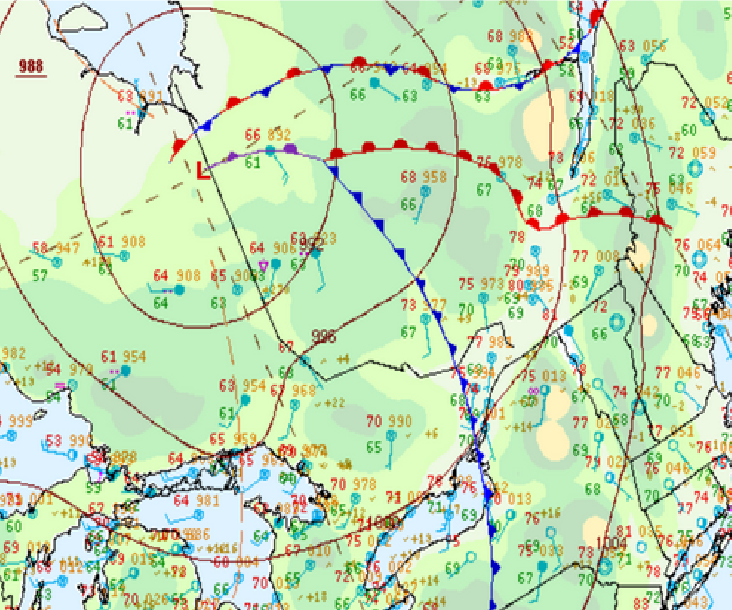
Figure 2: Weather Prediction Center (WPC) Surface Analysis from 1200 UTC on 21 July 2022. [click to enlarge]
The High-Resolution Ensemble Forecast (HREF) 1600 UTC (Coordinated Universal Time) ensemble mean Surface-Based CAPE (SBCAPE) (Figure 3) showed a relatively wide corridor of 1000 to 2000+ J/kg SBCAPE extending from eastern New York through much of New England within the warm sector of the Canadian cyclone. This is on the higher side for what we usually see for our severe weather events in the North Country, and keyed forecasters in on the potential for a very active day with no shortage of instability in the area. Lack of (or questionable) sufficient instability can oftentimes be a limiting factor for severe events in our area, so given the strong instability present on this day, confidence was higher than normal for an active day across our forecast area. Indeed this primed atmosphere is evident on the 1800 UTC NAM 3 km sounding for Burlington initialized at 12Z (Figure 4), which showed forecast CAPE values of right around 2000 J/kg, precipitable water values of 1.73 inches, and even enough veering in the low-levels to potentially support an isolated spin up.
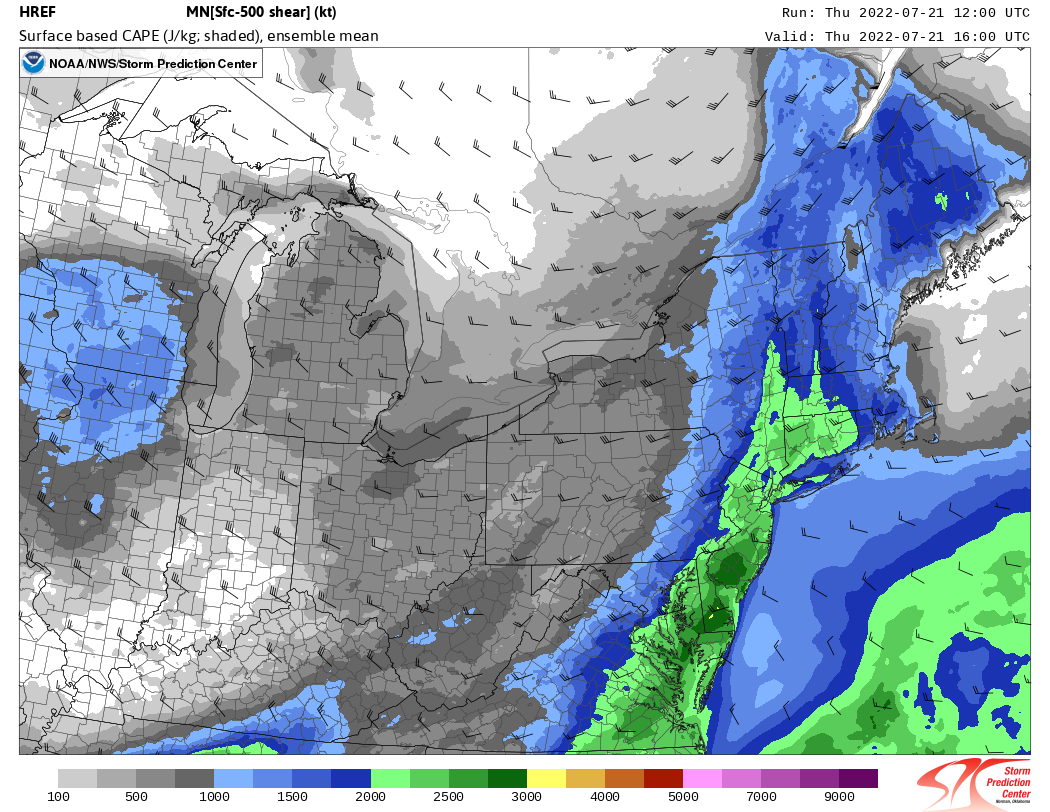
Figure 3: High-Resolution Ensemble Forecast (HREF) ensemble mean Surface-Based CAPE forecast for 1600 UTC 21 July 2022, initialized at 1200 UTC.[click to enlarge]
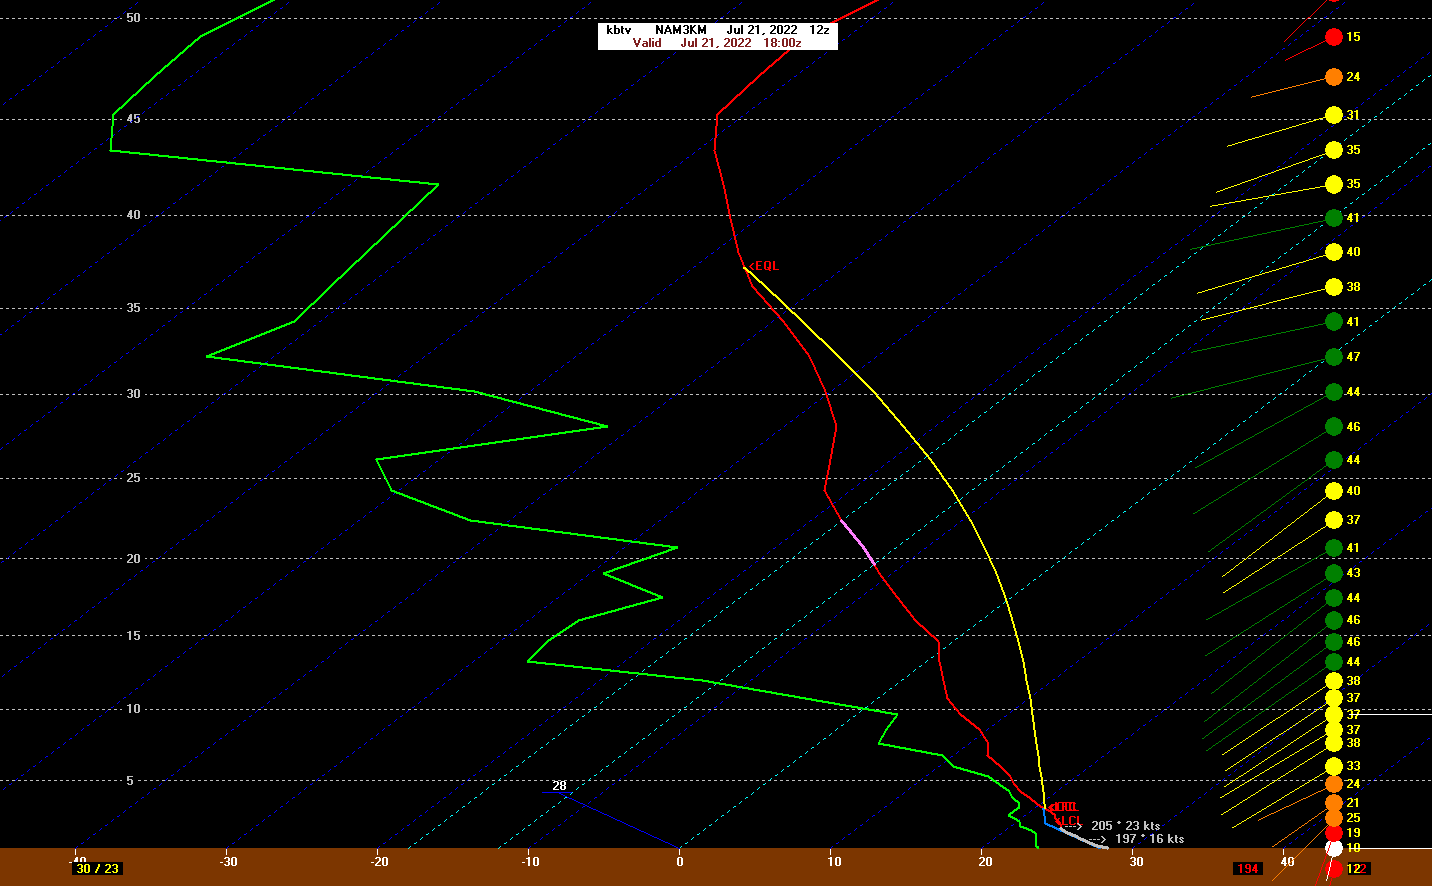
Figure 4: NAM 3 km sounding for Burlington valid at 1800 UTC 21 July 2022 initialized at 1200 UTC[click to enlarge]
Another parameter that was very favorable for severe weather over our forecast area was Downward CAPE, or DCAPE, where 17Z Storm Prediction Center (SPC) Mesoanalysis (Figure 5) analyzed a corridor of 1000+ J/kg DCAPE for portions of our forecast area. DCAPE can be used to estimate the potential strength of downdrafts within thunderstorms. The higher the value of DCAPE, the stronger the downdraft (and strong wind) potential. Values above 900 J/kg are considered very high for our region and indicative of the potential for strong winds and thunderstorm wind damage within stronger storms.
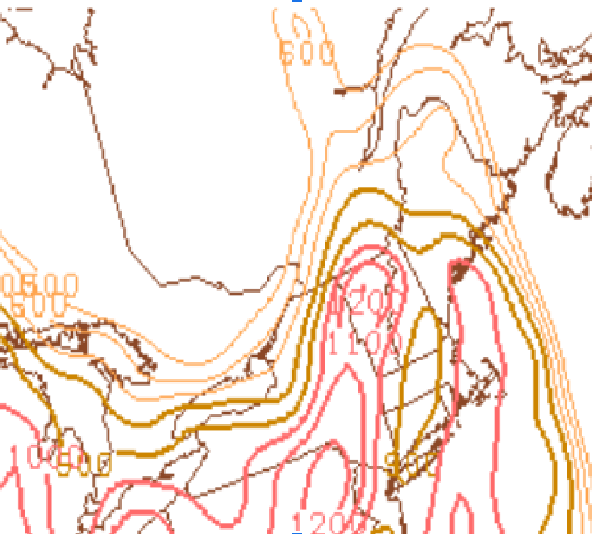
Figure 5: Storm Prediction Center (SPC) Downard CAPE (DCAPE) at 17 UTC on 21 July 2022[click to enlarge]
Looking further up in the atmosphere at 500MB (20,000 feet above ground level), fast flow (around 50 knots) was analyzed over the North Country from 12Z upper air observations analysis on 21 July 2022. This strong south-westerly flow aloft coupled with the southerly surface flow (especially funneled up the Champlain Valley) setup around 35 to 40 knots of deep layer shear, which was sufficient to support multi-cells and longer-lived supercells during the event. Thunderstorms tend to become more organized and persistent as vertical shear increases. In addition, height falls ahead of the upper-level trough would provide the deep lift necessary for severe weather.
Figure 6: 500MB upper air observations (blue), heights (black), and temps (red dashed lines), at 1200 UTC on 21 July 2022.[click to enlarge]
With all the ingredients for an active day over the Northeast present, local WFOs worked closely with the Storm Prediction Center early in the day to issue a Severe Thunderstorm Watch (Figure 7) for much of eastern New York and New England. The primary threats for the day included scattered damaging winds likely with isolated significant gusts to 75 mph possible, as well as isolated large hail to 1.5 inches in diameter. The severe thunderstorm watch also mentioned an isolated tornado threat existed. This watch was valid from 11:30 AM until 8 PM EDT on 21 July 2022.
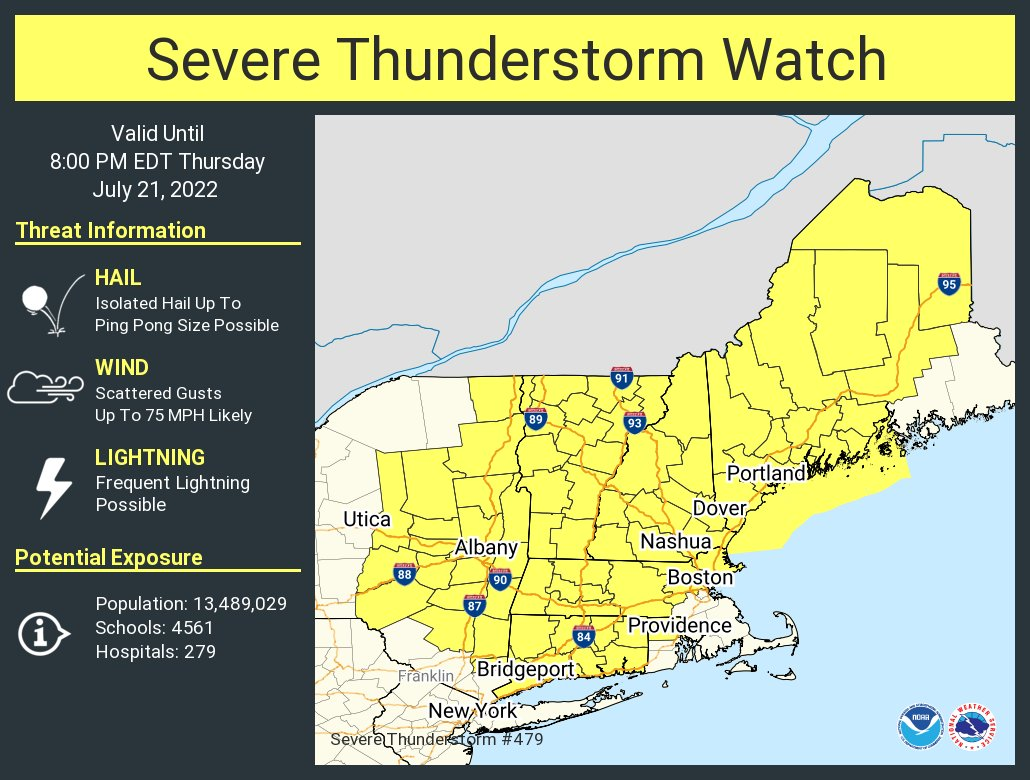
Figure 7: Severe Thunderstorm Watch issued on 21 July 2022. [click to enlarge]
Part II: Radar Analysis
Multiple rounds of thunderstorms were observed throughout the day on July 21, 2022. The environment during the morning hours remained conditionally unstable as we had around 40 knots of 0-6 km bulk shear observed from the KCXX radar and 1500 to 2000 J/kg of CAPE based on RAP analysis. By 11:30 AM, the first supercell of the day formed over Lyon Mountain, New York, and tracked eastward as it crossed over Lake Champlain into South Hero, Vermont, and ultimately moved into Franklin County in Vermont where reports of wind damage were received about an hour after the storm first formed. A second supercell formed a little after noon near Mount Mansfield and drifted eastward. This long-tracked supercell produced widespread wind damage and copious amounts of hail across the Northeast Kingdom of Vermont, with the largest hail stone measuring 1.75” or about the size of a golf ball before crossing into New Hampshire where even more damage was reported. While brief, the storm did have a strong low-level rotation which prompted a tornado warning. Figures 8 and 9 show the classic supercell structure of the second supercell right before it dropped golf ball-sized hail over Albany, VT at 12:28 PM. Pictures of the severe hail from Albany and Irasburg in Vermont can be seen in images 10, 11, and 12.
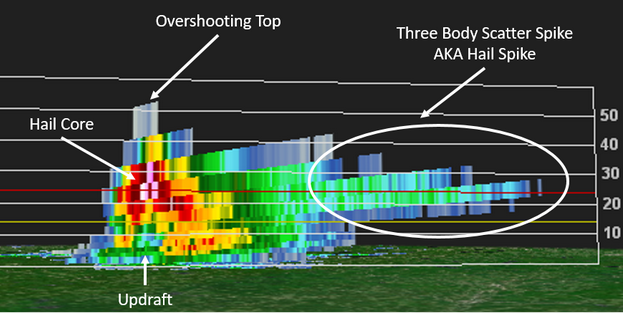
Figure 8: KCXX radar Cross-section at 12:28 PM EDT of the supercell near Albany, VT. A deep bounded weak echo region (BWER) was noted, indicating the presence of a strong updraft. This storm led to multiple golf ball-sized hail reports with radar max estimated size of hail (MESH) of 3.25 inches. [click to enlarge]
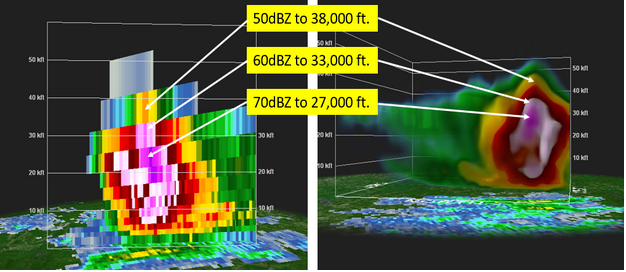
Figure 9: KCXX radar comparison between a 2-D cross-section (left) and 3-D cross-section (right) for the Albany, VT storm at 12:28 PM ET. Very impressive signatures were noted due to the strong and persistent updraft. A core of 70 dBZ reflectivity was noted up to 27,000 feet, indicating very large hail.[click to enlarge]

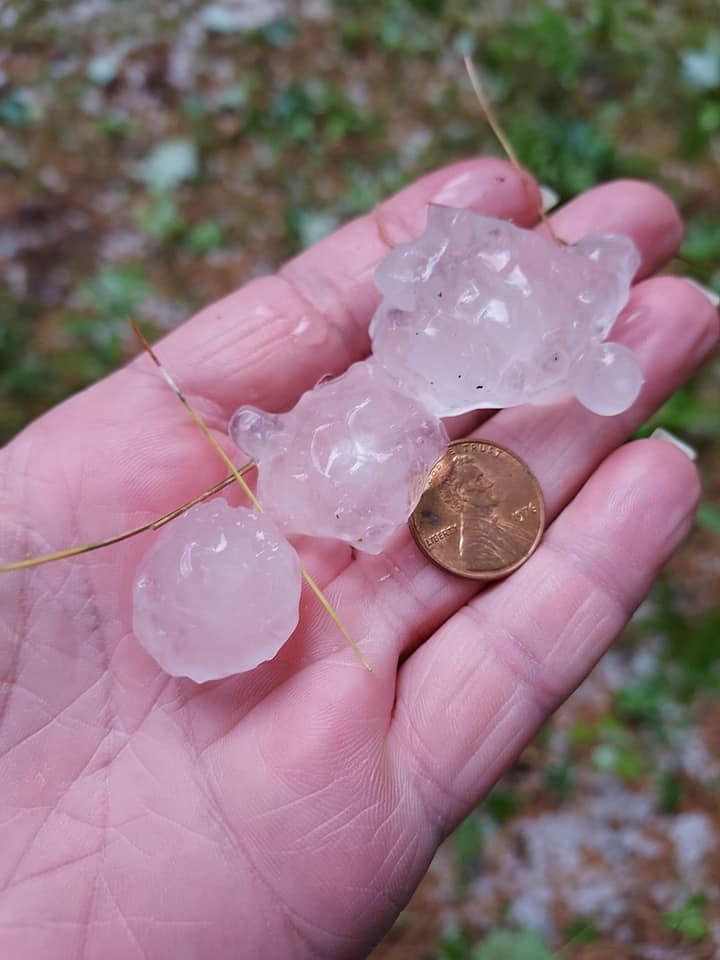
Figures 10 and 11: Pictures of the severe hail in Albany, VT courtesy of Lorri LePage via Facebook. Hail up to golf ball size was reported with this storm.[click to enlarge]

Figure 12: Pictures of the severe hail in Irasburg, VT courtesy of Andrew Leighton via Facebook.[click to enlarge]
As the two aforementioned supercells exited our forecast area, several more storms began to fire up across the Connecticut River Valley in eastern Vermont. A combination of 2000 to 2500 J/kg of CAPE analyzed by the RAP coupled with southerly inflow up the north/south oriented valley allowed for a very favorable environment of low-level shear and instability to develop. The most interesting storm that occurred across the Connecticut River Valley was a storm that formed near Bradford and tracked northeast toward Newbury. Instead of continuing to travel northeast like the rest of the storms did on July 21st, this storm took a northerly turn where it briefly crossed into New Hampshire near Woodsville before crossing back into Vermont southeast of St. Johnsbury. With typical left-moving supercells, it’s common to see an anticyclonic mesocyclone attached to the storm. This, however, wasn’t the case with this long-tracked supercell. Given the terrain of the Connecticut River Valley, the likely conclusion is that this storm followed an axis of greater instability and low-level inflow which caused the deviant track compared to the other storms on this day. Widespread wind damage in the form of downed trees, powerlines, power poles, and power outages were reported from Hartland, VT all the way to Canaan, VT. As the storms in the Connecticut Valley began to wind down, the next round of convection associated with a cold front began to move into the Champlain Valley. As one storm began to cross Lake Champlain, an impressive wind signature began to develop near Essex, NY, and tracked northeastward toward Shelburne. You can see a loop of this storm in figure 13. This storm weakened slightly as it crossed I-89 but began to strengthen once again as strong outflow winds in the 55-60 mph range were observed on radar just northeast of Jericho and persisted as the storm moved toward Pleasant Valley. You can see a loop of this storm in figure 14.
Figure 13: Loop of velocity radar data from KCXX. Note the area of enhanced inbound velocity approaching Shelburne, which produced scattered wind damage.[click to enlarge]
Figure 14: Loop of velocity radar data from KCXX. Note the area of outbound velocity moving through Pleasant Valley. Wind damage was reported near Jeffersonville and Johnson with this storm.[click to enlarge]
Part III: Summary
This severe event was highlighted by multiple long-tracked supercells that brought widespread wind damage to the North Country. While we lacked the surface forcing to produce more widespread thunderstorm activity, the environmental conditions were still very favorable for storms that did form to quickly become strong to severe. The combination of 1500-2500 J/kg of CAPE and deep layer shear upwards of 50 knots allowed for the supercells that did form to have persistent mesocyclones which allowed for the unusually large hail and widespread wind damage. It’s not every day that we see 90-degree temperatures coupled with 70-degree dew points while also having favorable upper-level flow for thunderstorms. A look back at reanalysis data shows that many times that we are 90 degrees or warmer across the North Country we have both high pressure at the surface while having upper-level ridging which stunts the formation of thunderstorms.
References

