
High temperatures are expected Tuesday. Heat Advisories are in effect for much of the region from 11 AM to 8 PM Tuesday. Heat index values between 93 and 103 degrees are expected. Take extra precautions when outside. Severe Thunderstorms are likely Tuesday evening after sunset, especially near the International Border. Damaging winds will be the main threat, with large hail and a tornado possible. Read More >
 Email the authors
Introduction
The signals for heavy precipitation were clear over a week before the event as forecasts showed a strong thermal gradient (front) oriented from southwest to northeast. Moisture sources including the southern Pacific Ocean, the Gulf of America, and the Atlantic Ocean would support ample moisture to overrun the frontal boundary. In the medium range, the main questions were 1) where exactly the front would be positioned, critical for placing relatively narrow axes of snow and mixed precipitation, and 2) how quickly arctic high pressure to our north would push the front southward, helping determine the duration of heavier precipitation. A swath of heavy snow ended up occurring across the vast majority of our forecast area (Figure 1 below), including measurements of 10 to 18 inches of snowfall. Areas just to the south, including Springfield, Vermont, reported up to a…“ of an inch of ice accumulation.
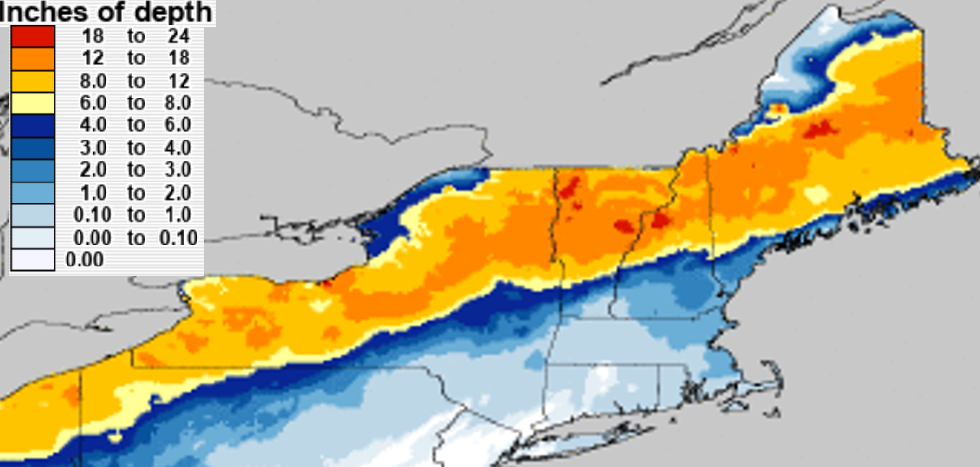
Figure 1: National Snowfall Analysis from the National Operational Hydrologic Remote Sensing Center (NOHRSC) depicting 48 hour snowfall ending 7 AM on 5 February 2022.[click to enlarge]
Upper Air Analysis
The polar jet configuration at 7 PM on February 3rd (figure 2), featuring a ~ 180 kt jet max pushing northeastward into eastern Quebec, suggests intense upper level divergence across northern Vermont and northern New York underneath its right rear quadrant. Underneath this type of jet structure, widespread precipitation can be anticipated, especially if deep moisture is present associated with the strong synoptic scale ascent. The highly amplified upper level pattern draws sub-tropical air poleward such that you can trace streamlines from southern Baja California to northern Vermont at this time.
Figure 2: The 250 hPa upper air analysis on 3 February 2022 at 7 PM. Isotachs (dark blue>75 knots, light blue > 100 knots, lighter blue > 125 knots, purple > 150 knots, darker purple > 175 knots), streamlines (black), wind barbs (blue; 1 pennant=50 knots, 1 barb=10 knots, ½ barb=5 knots), temperatures (red) and dew points (green).[click to enlarge]
Examining the atmospheric thermal profiles, the 7 AM Albany, New York upper air sounding on 4 February 2022 highlighted a warm nose near between 850 hPa and 700 hPa well associated with brisk southwest winds of 65 to 95 knots (Figure 3). In addition, you can see the low level northerly flow of 30 knots at 925 hPa, advecting much colder air southward. The sub-freezing layer was about 3000 feet deep, while the warm layer aloft was only 500 to 1000 feet, but just enough to melt the snow. This resulted in mixed precipitation across southern Vermont and parts of eastern New York overnight Thursday into Friday morning. The precipitable water observed was 0.87 inches, which was just 0.04 inches away from the daily maximum value of 0.91 inches for February 4th (since 1948). This was a good indication of the amount of available moisture in the atmosphere and the potential for a widespread moderate to heavy precipitation event.
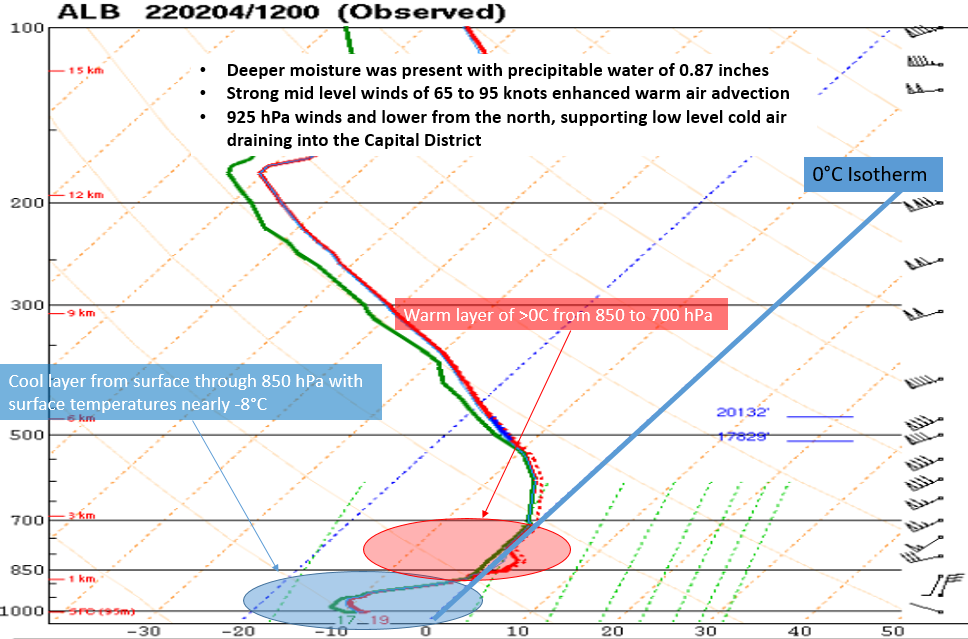
Figure 3: Upper air sounding from Albany, New York on 4 February 2022 at 7 AM. [click to enlarge]
Figure 4 below shows the GOES 16 Mid-level Tropospheric Water Vapor on 4 February 2022 at 7 PM, which clearly indicates the deep moisture advection across the eastern half of the United States, ahead of the mid/upper level trough over the southern High Plains. This abundant moisture was enhanced by the subtropical jet across northern Mexico and low level southerly jet over the northern Gulf of America. In addition, the right rear quadrant of the polar jet was observed over southern Canada, helping support large scale upper level divergence and mid level ascent over the northern New England region. At the surface a nearly stationary boundary was draped from the Mississippi River Valley into southern Canada on the evening of February 3rd, with several embedded areas of weak low pressure.
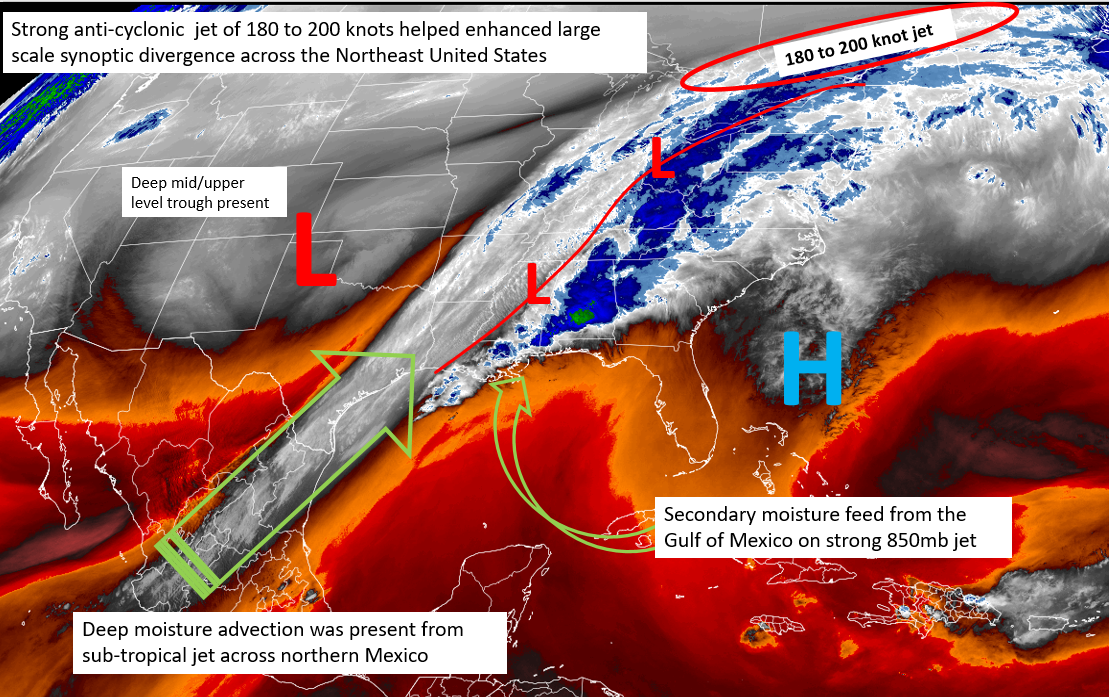
Figure 4: GOES 16 Mid-Level Tropospheric Water Vapor on 4 February 2022 at 7 PM. [click to enlarge]
Strong thermal and moisture gradients, along with areas of enhanced frontogenesis in the low to mid levels of the troposphere, stayed over much of the northern two thirds of Vermont and northern New York on the cold side of the surface boundary. The heaviest snowfall, defined by multiple hours of visibility under 1 SM, matched well with frontogenesis at 700 hPa (Figure 5 below). This was marked by a sharp temperature gradient ranging from -2 °C over southern Vermont to -10 °C in the northern Champlain Valley early in the morning on February 4th. The convergent flow from westerly winds over the St Lawrence Valley as opposed to southwesterly flow across central New York, helped to tighten the gradient and maintain frontogenesis in our area. When an area is located under favorable frontogenesis with deep layer moisture present, conditions support mesoscale banding of precipitation, which can result in localized moderate to heavy snowfall rates.
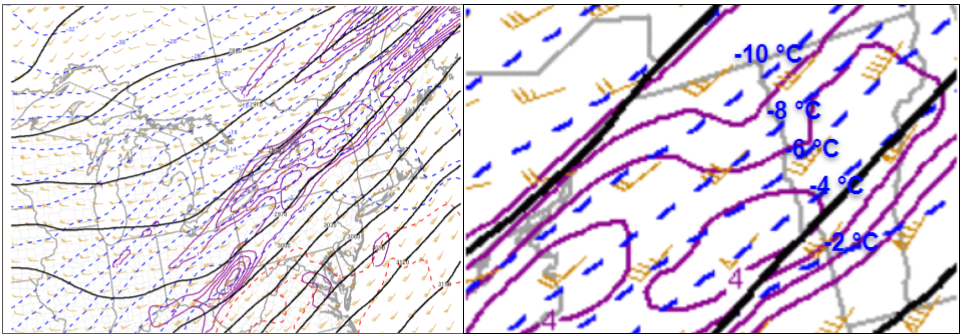
Figure 5. Regional (left) and local (right) RAP 13 km analysis of 700 hPa heights (solid black lines), temperature (blue dashed lines), wind barbs (orange; 1 pennant=50 knots, 1 barb=10 knots, ½ barb=5 knots), and frontogenesis (purple contours) valid at 3 AM on 4 February 2022. [click to enlarge]
Since frontogenesis occurs both vertically and horizontally, it is helpful to illustrate the process in a two dimensional chart with the vertical direction on the y-axis and the horizontal direction the x-axis. Figure 6 below is the NAM 3km vertical cross section taken from near the International Border (point A) to the eastern tip of Long Island (point B). The 2D frontogenesis (pink lines) shows the slantwise structure to the temperature profile, with deeper/colder air toward point A and shallow near surface frontogenesis at point B, along with a tight curve in the 0 °C isotherm. The strongest omega (color filled) is between the 850 hPa and 700 hPa in this cross section and corresponds just above an area of enhanced 2D frontogenesis and associated warm nose around 800 hPa located over the central-southern Champlain Valley. The enhanced omega couplet was located just below the favorable dendritic snow growth zone (DGZ) at 1 AM on 4 February 2022, resulting in fine needle-like flakes across most of the North Country. The colder/denser air was draining down the St. Lawrence and Champlain Valley on brisk north-northeast winds, which is highlighted by the -12 °C (dotted red line) in the image below.
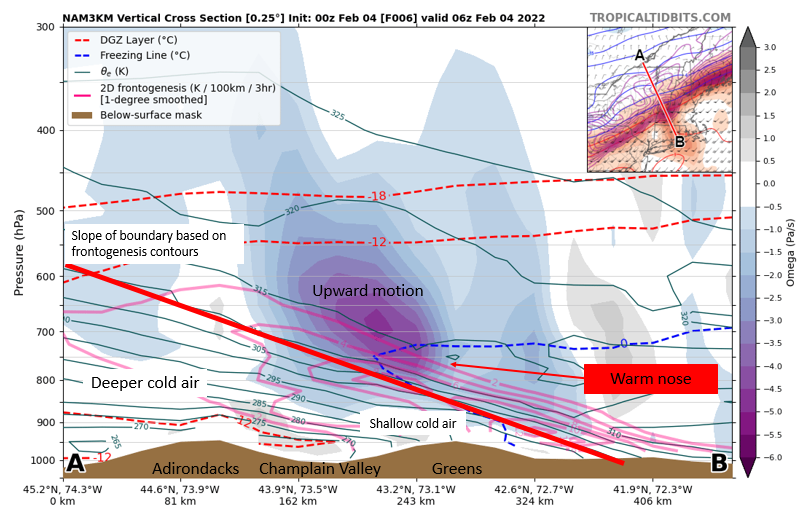
Figure 6: NAM 3km vertical cross section of omega (color filled), dendritic snow growth (DGZ) (red dotted lines -12 °C and -18 °C), theta e (green lines), freezing isotherm (blue dotted line), and 2D frontogenesis (pink lines) initialized on 3 February 2022 at 7 PM valid at 1 AM on 4 February 2022.[click to enlarge]
Snow Ratios
The NAM 3km sounding at Burlington, VT (figure 7, below), indicated very strong winds of 80 to 97 knots within the favorable snow growth region (-12 °C to -18 °C) at 1 AM on 4 February, resulting in needle-like snowflake structure as the winds tore the bigger flakes apart. Furthermore, this zone was 15,000 to 20,000 feet above the surface, with additional winds below helping to break up the flakes into fine dense needles. This created very low snow ratios in the range of 8:1 to 10:1 through 7 AM on February 4th, with surface visibilities around a ½ SM in moderate snow. Snowflake size did improve from needles to dendrites on Friday with lighter winds aloft and a developing dual favorable snow growth zone as colder air moved into the region, along with enhanced upper level support from embedded short wave energy.
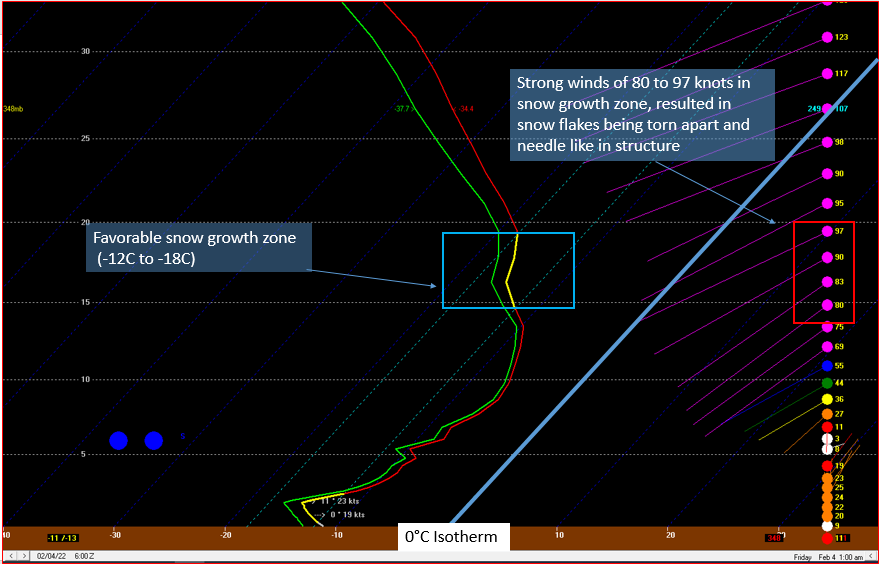
Figure 7: NAM 3km at Burlington, Vermont, initialized on 3 February 2022 at 7 PM, valid for 1 AM on 4 February 2022.[click to enlarge]
Mixed Precipitation Southern Vermont
A warm layer between 5000 and 8000 feet above the ground level across southern Vermont caused a mix of sleet and freezing rain to occur on Thursday night into Friday morning. Strong southwest winds of 60 to 80 knots, helped to produce temperatures between 1 and 4 °C within this layer, while below 5000 feet temperatures were below freezing, supporting the messy wintery mix of precipitation. Figure 8 below shows the NAM 3km predicted atmospheric sounding at Springfield, Vermont, initialized on 3 February 2022 at 7 PM, valid for 1 AM on 4 February 2022.
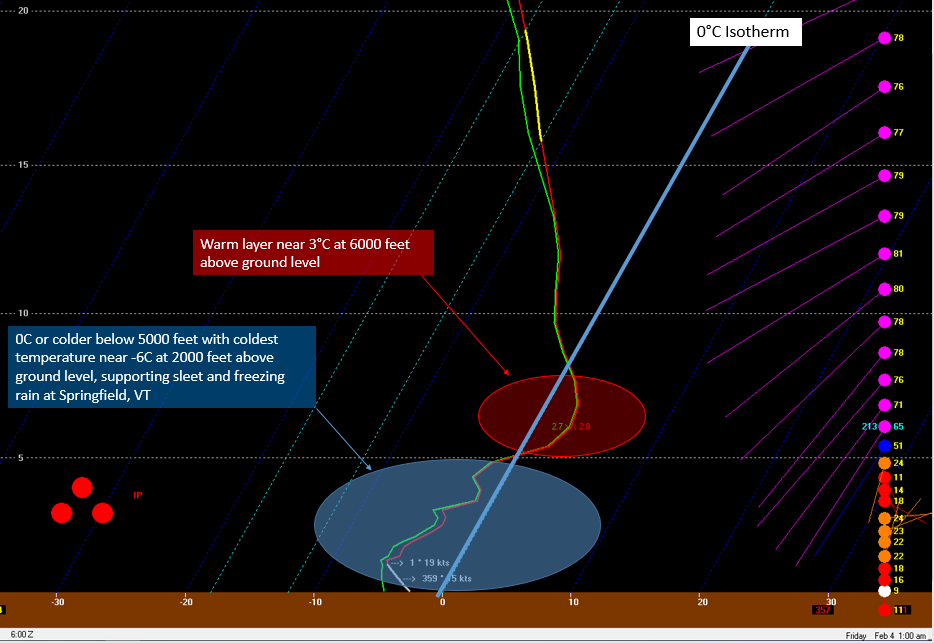
Figure 8: NAM 3km at Springfield, Vermont, initialized on 3 February 2022 at 7 PM, valid for 1 AM on 4 February 2022.[click to enlarge]
The progged precipitation type radar mosaic from the NAM 3km initialized at 7 PM on 3 February showed a mix of light rain (green color) and snow (blue color) across the region on Thursday morning, but as colder air filtered into the North Country, precipitation quickly changed to snow. However, this model depiction was too quick at advecting the colder air south and turning the rain over to snow across southern Vermont, where a prolonged period of sleet and freezing rain (pink-purple color) occurred overnight Thursday into Friday morning. Springfield Automated Surface Observing Station (ASOS) reported a…“ of an inch of ice accumulation by 7 AM Friday, with some isolated power outages. Meanwhile, the darker blue shading just north of the mixed precipitation zones, suggested areas of moderate to heavy snowfall predicted by the NAM 3km model on Thursday night into Friday morning across northern New York into central-northern Vermont.
Figure 9: NAM 3km progged mosaic radar precipitation type from 7 AM Thursday to 7 PM Friday 3-4 February 2022. [click to enlarge]
Figure 10 below shows the Multiple Sensor Multiple Radar (MRMS) winter precipitation type from 1 AM to 7 AM on 4 February 2022. This radar imagery only shows a distinction between rain (green color) and snow (blue color), while not highlighting the wintry mix of sleet and freezing rain that occurred over southern Vermont very well. It does show how the rain vs snow line slowly pushed southward into northern Massachusetts and eastern New York, before becoming stationary on Friday morning. The darker blue colors on the display below indicate areas of moderate to localized heavy snowfall occurring with surface visibilities ranging between a ¼ and a ½ sm and snowfall rates up to 1 inch per hour.
Figure 10: Multiple Sensor Multiple Radar (MRMS) winter precipitation type from 1 AM to 7 AM on 4 February 2022.[click to enlarge]
Actual precipitation type can be assessed in real time via the Correlation Coefficient (CC) radar product. The CC provides a measure of the consistency of the shapes and sizes of precipitation within the radar beam. A higher value near 1.0 indicates a higher consistency in the size and shape of precipitation, while values in the 0.85 to 0.95 range indicates greater variability in the shapes and sizes. Figure 11 below shows the MRMS CC product from 1235 AM to 425 AM on 4 February 2022. This data clearly highlights the mixed precipitation transition zones from near Binghamton to Albany, New York and cutting across Rutland and Windsor counties in Vermont, where CC values in a narrow nearly stationary axis were in the 0.85 to 0.95 range. These values indicate a mix of precipitation shapes and sizes associated with the combination of big wet snow flakes and smaller sleet pellets,and rain/freezing rain droplets. It should be noted that the transition zone was nearly stationary during this 4 hour loop.
Figure 11: Multiple Sensor Multiple Radar (MRMS) Correlation Coefficient from 1235 AM to 425 AM on 4 February 2022.[click to enlarge]
Surface Analysis
A large area of arctic high pressure extended from the northern Plains into central-southern Canada on February 3rd, which helped to drive low level cold air southward across the St Lawrence and Champlain Valleys by early afternoon. Temperatures under this high pressure system were between -2 °F and -10 °F with even colder dewpoints. A series of weak areas of low pressure developed along the strengthening surface boundary, which extended from the Mississippi River Valley into central New England by 7 PM on 3 February 2022. Temperatures south of the boundary were well into the 60s and 70s with severe thunderstorms and tornadoes occurring in the warm sector over Alabama. Meanwhile, the North Country was in the battle zone between warm moist air to the south advecting northward, and colder-drier air moving southward, producing favorable conditions for our widespread moderate snowfall, with some wintry mix precipitation over southern Vermont. Figure 12 below shows the surface evolution on the afternoon and evening of 3 February 2022 across the eastern United States.
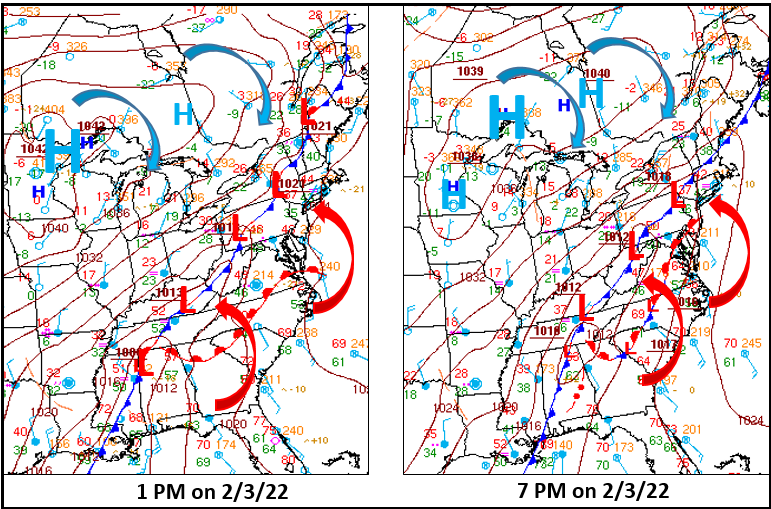
Figure 12: Weather Prediction Center (WPC) surface analyses at 1 PM (above left) and 7 PM (above right) on 3 February 2022.[click to enlarge]
Strong arctic high pressure continued to expand across southern Canada, helping to deepen the cold air across our region, while waves of weak areas of low pressure continued along the sagging cold front from the Ohio Valley into southern New England on February 4th. Eventually drier air resulted in the steadier snow, becoming flurries over northern New York, but heavy snowfall occurred as waves of low pressure rode along the boundary across central and southern Vermont on Friday. Brisk northerly wind channeled down the Champlain and St Lawrence Valleys, producing wind chill values well below zero on Friday. The lack of strong winds between 2000 and 4000 feet above ground level resulted in a relatively uniform precipitation shield, with limited terrain influence.
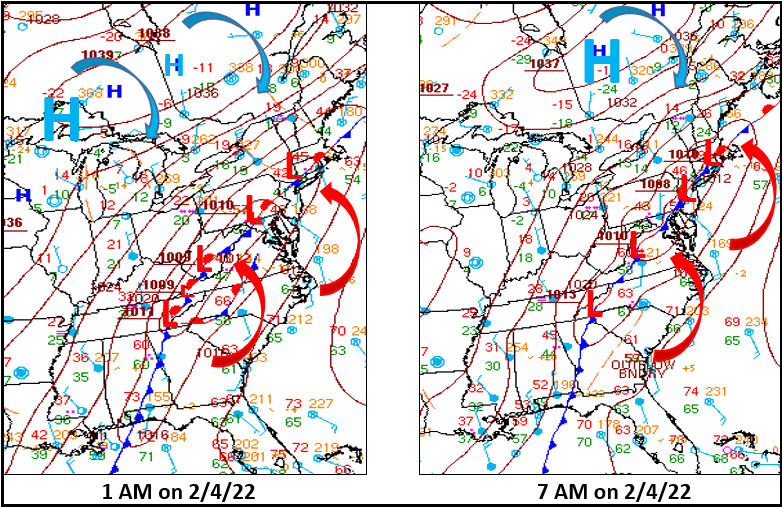
Figure 13: Weather Prediction Center (WPC) surface analyses at 1 AM (above left) and 7 AM (above right) on 4 February 2022.[click to enlarge]
Summary
The 3-4 February (Thursday - Friday) 2022 winter storm was not a typical event for our area with its long duration and lack of terrain influence on precipitation. Impacts were minimal with the main "impact" being much appreciated snowpack for wintertime recreational activities. Some valley locations in central and southern areas reported minor ice accretion on flat untreated surfaces Thursday morning with air temperatures in the 30s. Because precipitation was rather light initially and some roadways were preemptively treated with knowledge of the falling temperatures and expected increase in snowfall intensity later on, limited travel impacts were observed on Thursday. Thermal profiles cooled aloft so that when surface temperatures fell below freezing, it was a gradual process allowing snow to accumulate before the ground froze, which prevented icy roads from being a problem.
A uniform 10 to 18 inches storm total snowfall was observed in most of Vermont and northern New York (Figure 14). As snow accumulated, its character gradually changed from needles to plates and dendrites as colder low level air steadily cooled the clouds under influence of arctic high pressure to the north, helping mitigate any heavy/wet snow impacts. The main forecasting challenge was related to a zone of mixed precipitation just north of the surface cold front; a period of freezing rain with limited power outages was reported in far southeastern Windsor County, Vermont edging a little farther north than expected. Most of the reported power outages were south of our CWA (County Warning Area). Much of the snow accumulation and heavier snowfall rates occurred late Thursday/early Friday, resulting in some vehicle slide offs along I-89 Friday morning. Proactive school closures, relatively low traffic volume, and planning by road crews likely mitigated any significant road closures or multi car accidents during the storm. The above is possible owing to accurate, consistent, and well-communicated weather forecasts.
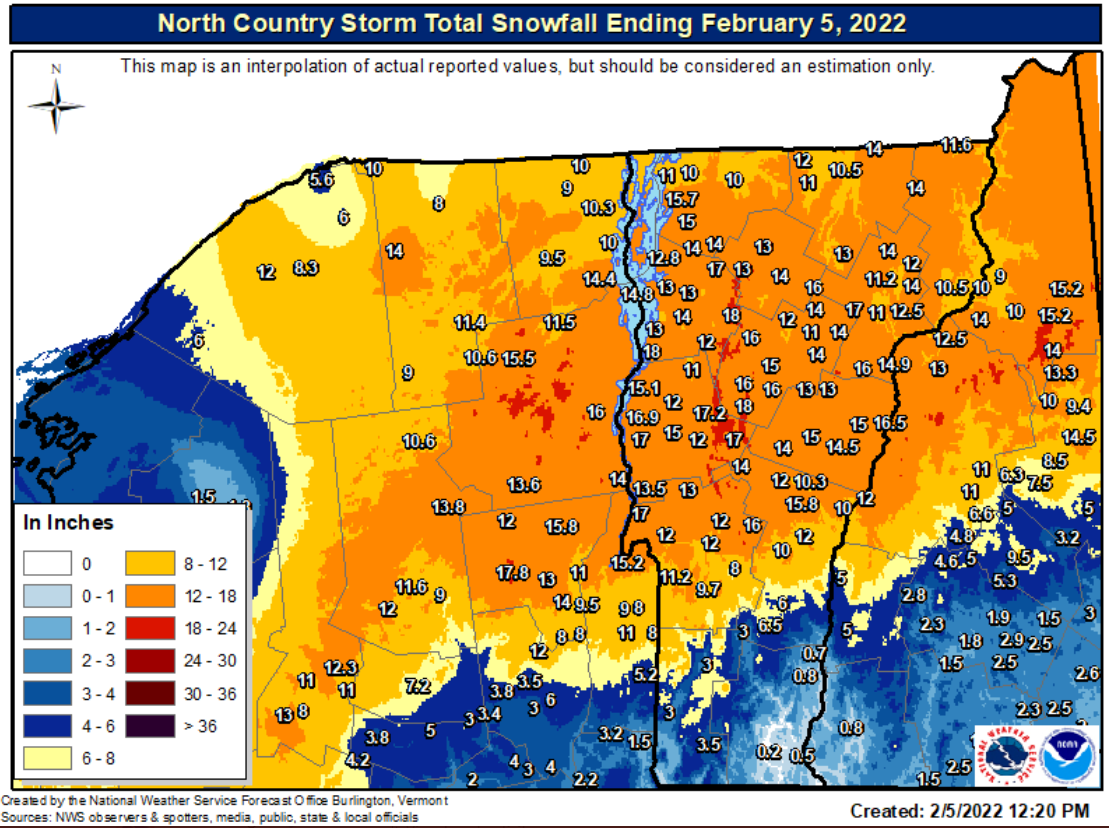
Figure 14: Storm total snowfall amounts 3-4 February 2022. [click to enlarge]
Impacts
Impacts were minimal with the main "impact" being much appreciated snowpack for wintertime recreational activities. Some valley locations in central and southern areas reported minor ice accretion on flat untreated surfaces Thursday morning with air temperatures in the 30s. Most of the reported power outages were south of our CWA. Because precipitation on Thursday was rather light, limited travel impacts were observed. Some roadways were preemptively treated Thursday morning with knowledge of the falling temperatures and expected increase in snowfall intensity during the advertised long-duration event. Thermal profiles cooled aloft so that when surface temperatures fell below freezing, it was a gradual process allowing snow to accumulate before the ground froze, which prevented icy roads from being a problem. Since the bulk of the heavier snowfall rates occurred overnight/early Friday morning, travel was not too heavily impacted during the main event. There were some vehicle slide offs noted along I-89 Friday morning. Schools were prepared due to our consistent messaging on the snowfall amounts and timing. Many districts announced Thursday evening that schools would be closed the next day. Proactive school closures, relatively low traffic volume, and planning by road crews likely mitigated any significant road closures or multi car accidents during the storm. The above is possible owing to accurate, consistent, and well-communicated weather forecasts.

