 Email the authors
Introduction:
Between December 16th and 17th, a long duration, heavy wet snow event caused widespread power outages over the North Country, particularly across higher elevations of Vermont. This was an elevation dependent event, with two waves of snow. Within the valleys, snow accumulation was minimal in the first wave during the day Friday due to warm surface temperatures. The second wave of snow that developed overnight into the early morning hours produced broader accumulations across the region due to heavier snowfall rates, and is when the primary impacts to utilities occurred. In total, the lower valleys received between 4 and 10 inches of snow, while higher elevations received between 12 and 20 inches, with a few localized totals of 2 feet (Figure 1). This review will look at the meteorology of why we experienced this long duration event, and will look at the storm’s impacts in terms of experimental Winter Storm Watch/Warning criteria.
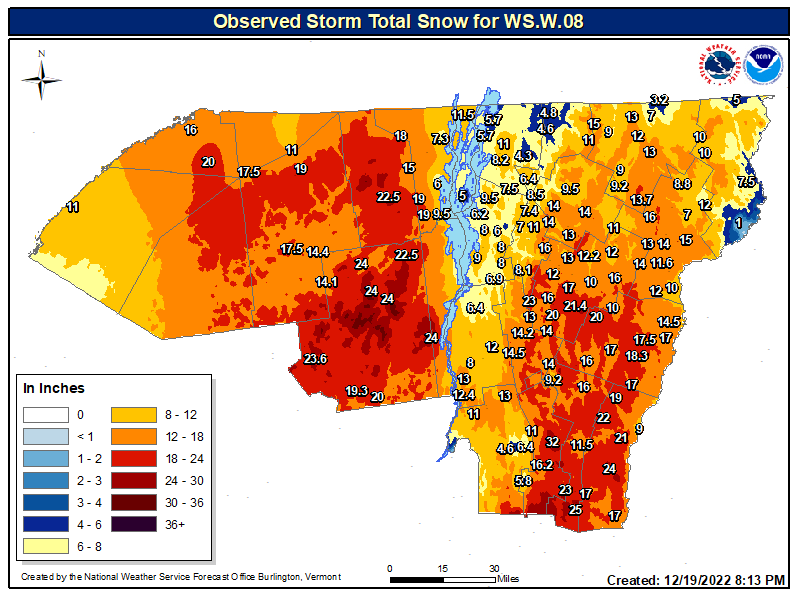
Figure 1: Storm Total Snowfall Accumulations for December 16th and December 17th, 2022[click to enlarge]
Synoptic Weather Pattern:
Prior to December 16th, an expansive, stacked, and deep area of low developed to the west of the Great Lakes region. Cool and dry continental polar advected into the southern US as the cyclone matured, creating a sharp thermal boundary near the coastline. The triple point of the cyclone’s occlusion was to the east of the Appalachians, and positioned near the warm, moist waters of the Gulf Stream. Favorable conditions for height falls were present as a negatively tilted trough was ejected towards the Mid-Atlantic Coast and a zonal 150 knot upper jet stretched across the Mid-South into the Mid-Atlantic Coast.
Surface analysis showed developing low pressure tracked from near Atlantic City, New Jersey on the early morning of December 16th to a location just south of Cape Cod by 7 PM on the 16th with a central pressure of 995hPa. Low pressure continued to slowly track northward over the Cape and into the Gulf of Maine by 7 AM on December 17th, as blocking high pressure prevailed over eastern Canada. Surface temperatures were mainly in the upper 20s to lower 30s during this time frame with periods of heavy wet snow occurring. The lack of cold arctic high pressure and persistent southeasterly flow, resulted in marginally cold temperatures for snow, with very low snow ratios of 8 to 1 being observed. During the daytime, accumulating snowfall mainly occurred in the mountains above 1500 feet; however as low pressure crossed Cape Cod, better lift associated vorticity advection from the 500hPa shortwave and favorable frontogenesis occurred overnight on the 16th into the 17th. Occasional moderate to heavy snow occurred at all elevations in the northward moving band, with snowfall rates within this band of 1 to 2 inches per hour. Many residents woke up to a fresh 6 to 12 inches of snow on the morning of December 17th, with locally higher amounts in the mountains. This heavy wet snow caused widespread power outages and very slippery travel across the region. Figure 2 shows the surface evolution on 16 December 2022 at 7 PM (lower left image) and 1 AM on 17 December 2022 (lower right image).
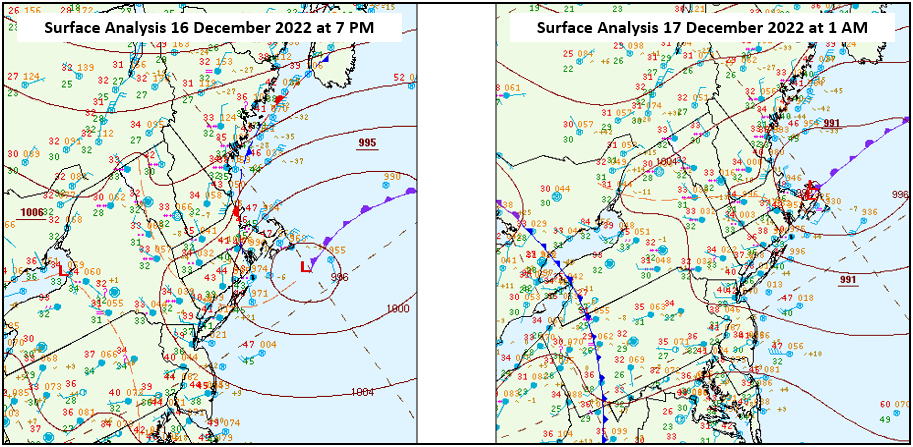
Figure 2: Surface analysis on 16 December 2022 at 7 PM (left) and on 17 December 2022 at 1 AM (right).[click to enlarge]
Forecast Model Assessment of Temperatures and Winds:
The High Resolution Ensemble Forecast (HREF) data suggested 2 meter temperatures would range between 30°F and 34°F (Fahrenheit) as coastal low pressure developed near Atlantic City, New Jersey and tracked northward toward the Gulf of Maine by 7 AM on December 17th. Initially 2 meter winds were from the east-southeast across most of Vermont, with northeast winds down the St. Lawrence Valley, but as low pressure tracked north of the region, winds shifted to the north-northwest and slightly cooler air filtered back into the North Country. Figure 3 shows the HREF 2-meter temperature, wind, and mean sea level pressure, ensemble mean from 7 AM on 16 December to 1 PM on 17 December 2022.
Figure 3: High Resolution Ensemble Forecast (HREF) 2-meter temperature, wind, and mean sea level pressure, ensemble mean from 7 AM on 16 December to 1 PM on 17 December 2022.[click to enlarge]
Despite the warm temperatures, the HREF 1-hour precipitation and dominant precipitation type, ensemble mean loop below highlighted mostly snow was expected to fall during this long duration event (Figure 4). Darker blue colors mainly over the Adirondacks of northern New York and Green Mountains of Vermont represented snowfall rates of about 1 to 2 inches per hour at times during this Nor’easter, with rain mixing with the snow across the Champlain Valley during the afternoon hours on December 16th.
Figure 4: HREF one-hour precipitation, and dominant precipitation type ensemble mean loop from 7 AM on 16 December to 1 PM on 17 December 2022.[click to enlarge]
Figure 5 below shows the 850hPa analysis on 16 December 2022 at 7 PM. This analysis indicated a complex pattern across the Great Lakes into the Northeast United States with primary low pressures over central Wisconsin, while secondary low pressure was developing across southern New England. Meanwhile, cold high pressure was anchored over eastern Canada. This gradient between high pressure and developing low pressure, created a strong 850hPa jet of 40 to 50 knots on the evening of December 16th (highlighted in red on the map below). This caused downslope shadowing that reduced precipitation rates in the valleys, which led to slightly warmer temperatures and less precipitation/snowfall observed across the Western Slopes near Rutland and over the Northeast Kingdom of Vermont. However, at the summits, 850hPa analysis indicated temperatures in the -2°C to -4°C range, just cold enough to support a heavy wet snowfall with very low snow ratios.
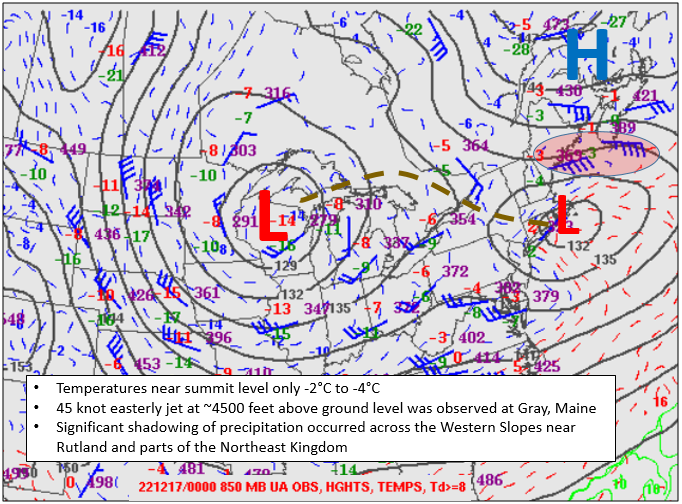
Figure 5: Upper air analysis at 850hPa on 16 December 2022 at 7 PM.[click to enlarge]
By midnight on 17 December 2022 (Figure 6 below) The NAM-3KM sounding at Burlington, VT showed the entire column was at or below 0°C, with surface temperatures at freezing, supporting heavy wet snowfall. Additionally, deep layer moisture was present through 20,000 feet, which included the favorable snow growth region (-12°C to -18°C), supporting large flake size and better potential for snowfall accumulations, especially at night given the marginal surface temperatures. However, the forecast sounding below indicated moderately strong 925hPa to 850hPa winds of 35 to 45 knots would continue resulting in lighter snowfall totals with amounts in the 3 to 6 inch range across the Champlain Valley and sheltered regions of northeastern Vermont overnight.
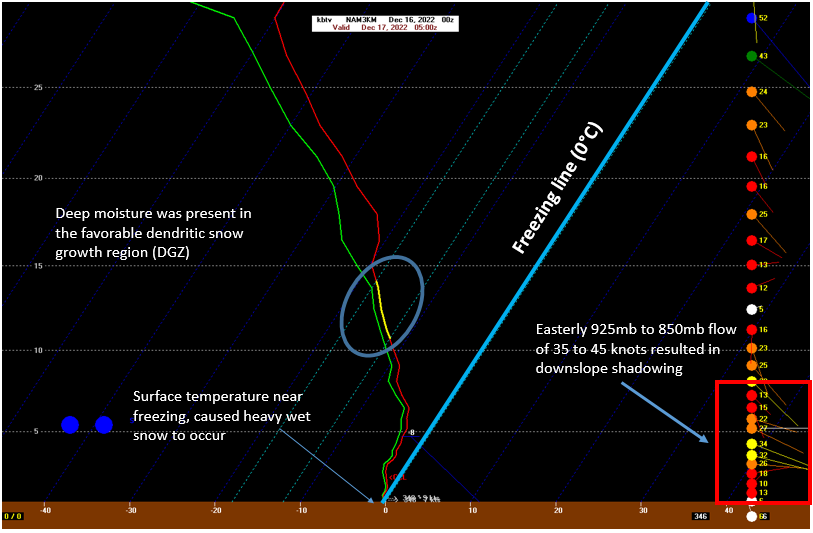
Figure 6: NAM-3KM sounding at Burlington, VT initialized at 7 PM on December 15, valid for midnight on 17 December 2022.[click to enlarge]
Radar Observations:
Figure 7 shows the Multiple Radar Multiple Sensor (MRMS) winter precipitation type mosaic loop from 550 AM to 1150 AM on 16 December 2022. Radar imagery highlighted the initial band of moderate snow lifting from south to north across our region with some light rain mixed with the snow across the Champlain and St. Lawrence Valleys during the morning hours on December 16th. Periodic breaks in the precipitation was observed across parts of the Western Slopes as dry air from departing high pressure remained in place. Much of the initial band of snow fell as virga near the International Border. Better moisture remained across the higher elevations of the Adironacks and southern Green Mountains allowing for snowfall rates of about 1 to 2 inches per hour that impacted the Friday morning commute and caused scattered power outages.
Figure 7: Multiple Radar Multiple Sensor (MRMS) mosaic loop from 550 AM to 1150 AM on 16 December 2022.[click to enlarge]
Once low pressure closed off at 850hPa and 700hPa, a northward advection of deep moisture and moderate snowfall occurred across Vermont and into the eastern Adirondacks on the evening of December 16th. The NAM–12KM predicted a well-defined deformation zone on the northern periphery of the cyclonic circulation, which contributed to a band of strong frontogenetic forcing (see Figure 8 below) and mesoscale banded precipitation with intense snowfall rates of up to 1 inch per hour.
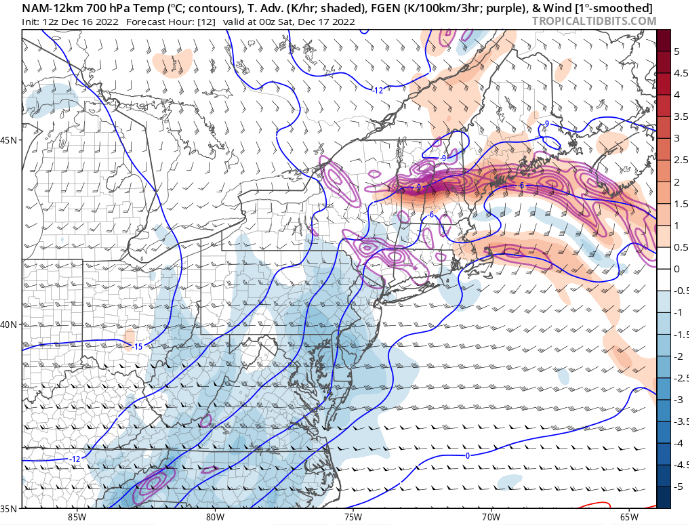
Figure 8: NAM 12KM 700hPa temperatures (blue lines), temperature advection(shaded), frontogenesis (purple contours) and wind (barbs), initialized on 16 December at 7 AM, valid for 7 PM on 16 December 2022.[click to enlarge]
Modeling did very well in highlighting this potential and based on radar data and surface observations, this was verified, resulting in additional heavy snowfall overnight into the early morning hours on the 17th. Given this banded precipitation occurred at night with intense precipitation rates, an additional 6 to 12 inches of snow fell by Saturday morning. The darker blues bands of precipitation in Figure 9, suggest bands of moderate to heavy snowfall lifting from north to south across our region. It should be noted in the loop below the MRMS precipitation type algorithm did indicate mostly rain (green color) in the St Lawrence and Champlain Valleys, but snow was falling during overnight hours. This band of heavy snowfall was associated with a developing deformation zone and strong frontogenetic forcing on the northern periphery of a deepening and closing 700hPa cyclonic circulation.
Figure 9: Multiple Radar Multiple Sensor (MRMS) mosaic loop from 1050 PM to 350 AM on 16-17 December 2022.[click to enlarge]
Forecast Messaging and the Experimental Winter Storm Warning Criteria:
Outside of the meteorological considerations, this long duration event with a mix of rain and snow for parts of our valley regions was a great test for the changes in our winter storm watch and warning criteria that focuses more on an event based total of 7 inches. In marginal temperature regimes, the forecast challenges of timing precipitation rates that allow rain to transition to snow and allow for accumulations that exceed melting complicates the forecast. Long duration events may also have two distinct waves of snowfall, but each one alone may not reach our standard thresholds for issuing Winter Storm headlines (6” in 12 hours or 9” in 24 hours). This event had both challenges to the forecast, and the experimental event based criteria (storm total greater than 7”) is intended to allow forecasters to focus less on unattainable levels of forecast accuracy in these complex scenarios that could take away from expressing information about the impacts we do know. The first issued winter headlines had both Winter Storm Watches and Warnings due to the uncertainties present with the low track’s impact on our wind fields and temperatures on the snowfall totals in the lower valleys (Figure 10). Such a choice was made simpler as a result of the event-based approach.
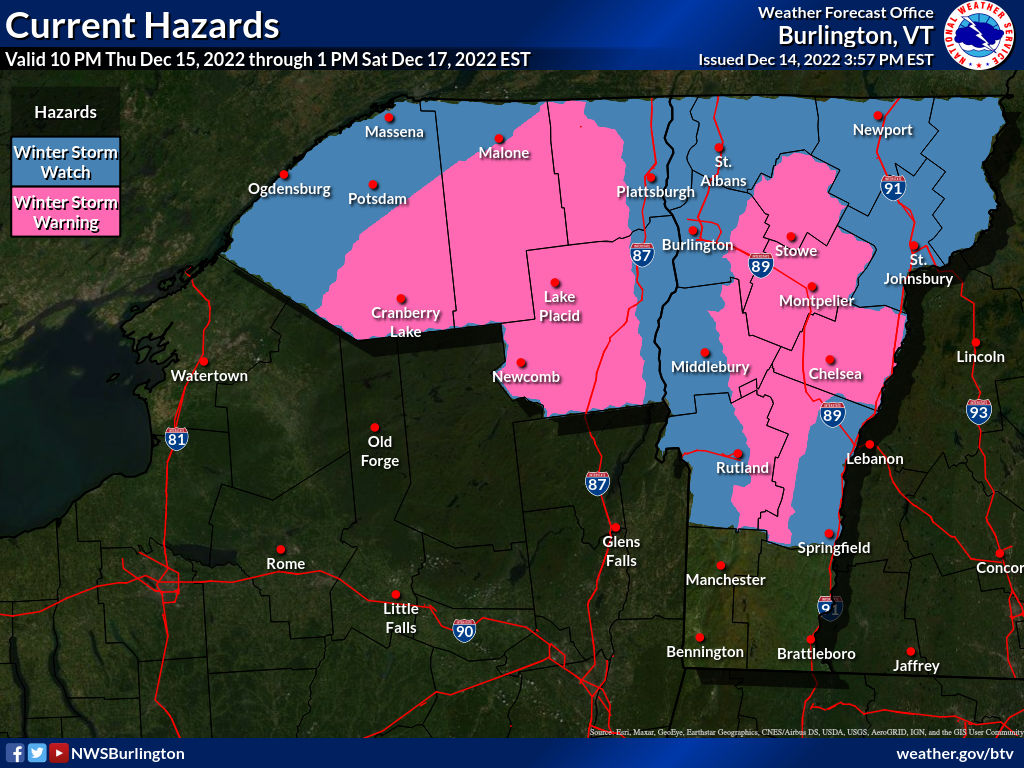
Figure 10: The first winter weather headlines issued on the December 14th afternoon forecast package. Areas in blue indicate where Winter Storm Watches were issued in the lower valleys, and areas in pink indicate where Winter Storm Warnings were issued in the Adirondacks and upslope regions of Vermont.[click to enlarge]
On our side, we are learning how to manage this. The initial snowfall rates were not as heavy in the Champlain Valley and parts of the Northeast Kingdom due to the observed wind field and temperatures that we have discussed. This limited the initial impacts to travel in the Champlain Valley on Friday morning. However, as we become more accustomed to the experimental Winter Storm Watch/Warning criteria, then we can make better use of the timeline graphics or interstate snowfall graphics around the period of greatest interest (Figure 11 and Figure 12). We encourage users to follow along and offer comments once the evaluation period for the experiment begins in Spring 2023.
(https://www.weather.gov/media/btv/NWSBurlington_WinterStormWarningCriteria2022.pdf)
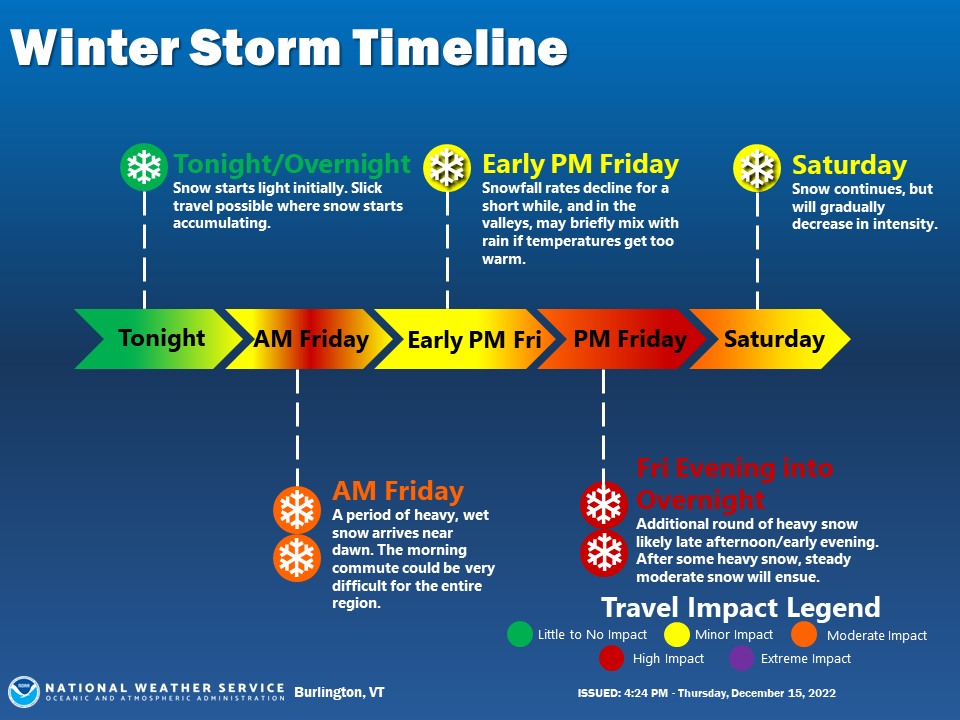
Figure 11: Winter storm timeline graphic posted to NWS Burlington social media accounts Thursday evening, December 15th.[click to enlarge]
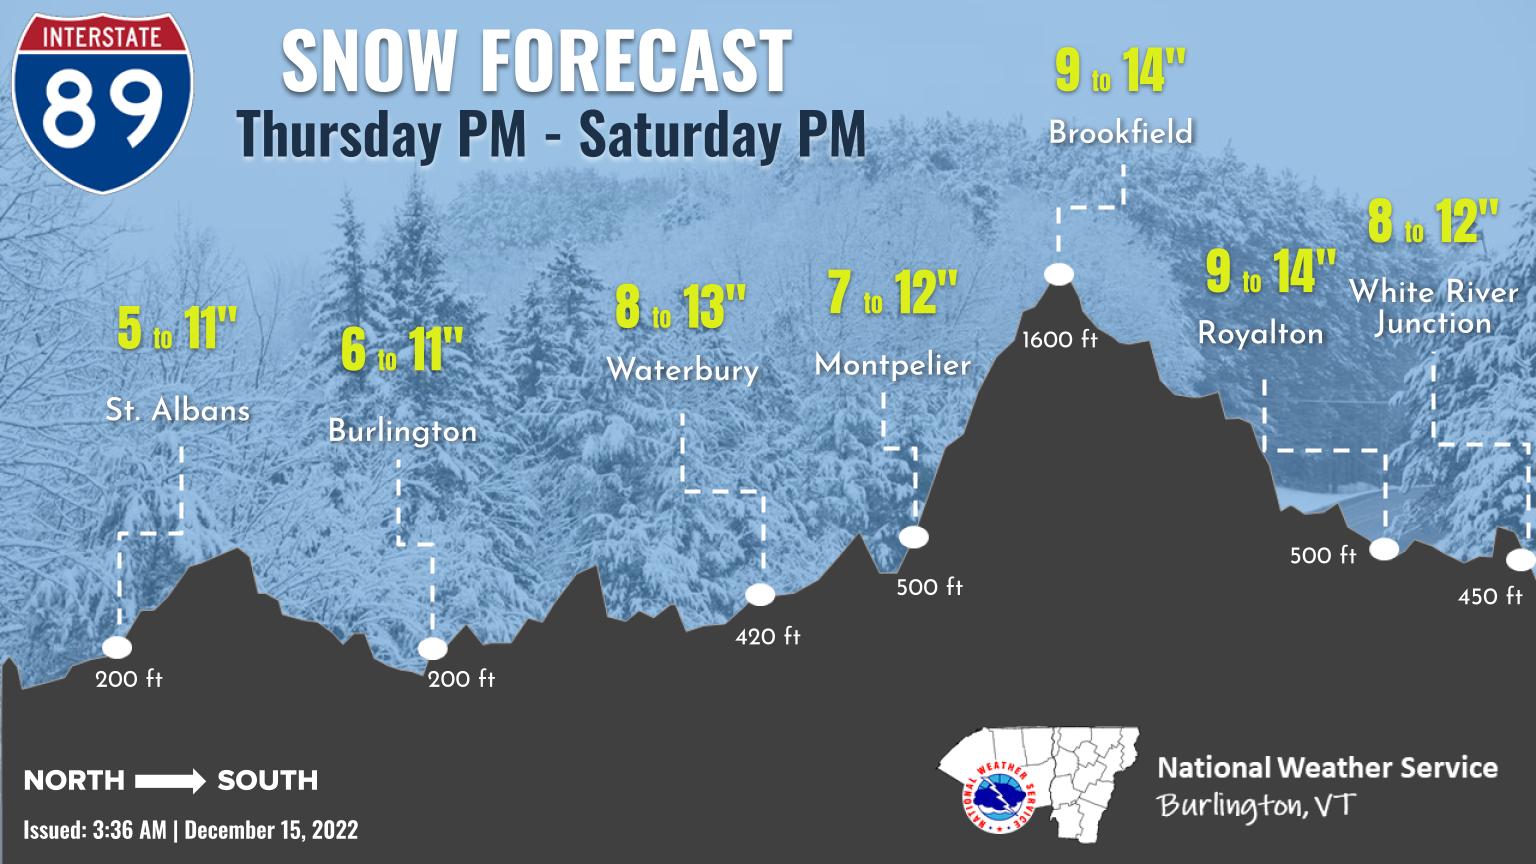
Figure 12: Interstate snowfall graphic depicting ranged forecast values with the varying elevation along the roadway that was posted to NWS Burlington social media accounts early December 15th, 2022.[click to enlarge]
Summary:
This heavy wet snow event was a challenge to forecast, with a sharp elevational dependent snowfall gradient observed from 4 to 10 inches in the Champlain Valley and parts of the Connecticut River Valley to 18 to 24 inches in the eastern Adirondacks and parts of the central/southern Greens. This long duration heavy wet snow event caused widespread power outages across northern New York into Vermont with nearly 75,000 customers losing power. Figure 13 below shows customers without power from December 16th to the 17th across Vermont. Data from Vermont Outages indicated almost 2,000 events or incidents of trees or wires down during the event. Recovery efforts were slowed due to the limited warm-up behind this system, which prevented snow from melting and caused some additional outages into the weekend. In addition to the power outages, travel was impacted both on Friday and Saturday, especially across the higher terrain where 18 to 24 inches of snow was observed.

Figure 13: Number of customers impacted by power outages from 12 AM on December 16th to 11:45 PM on December 17th. Information provided by VTOutages.org[click to enlarge]
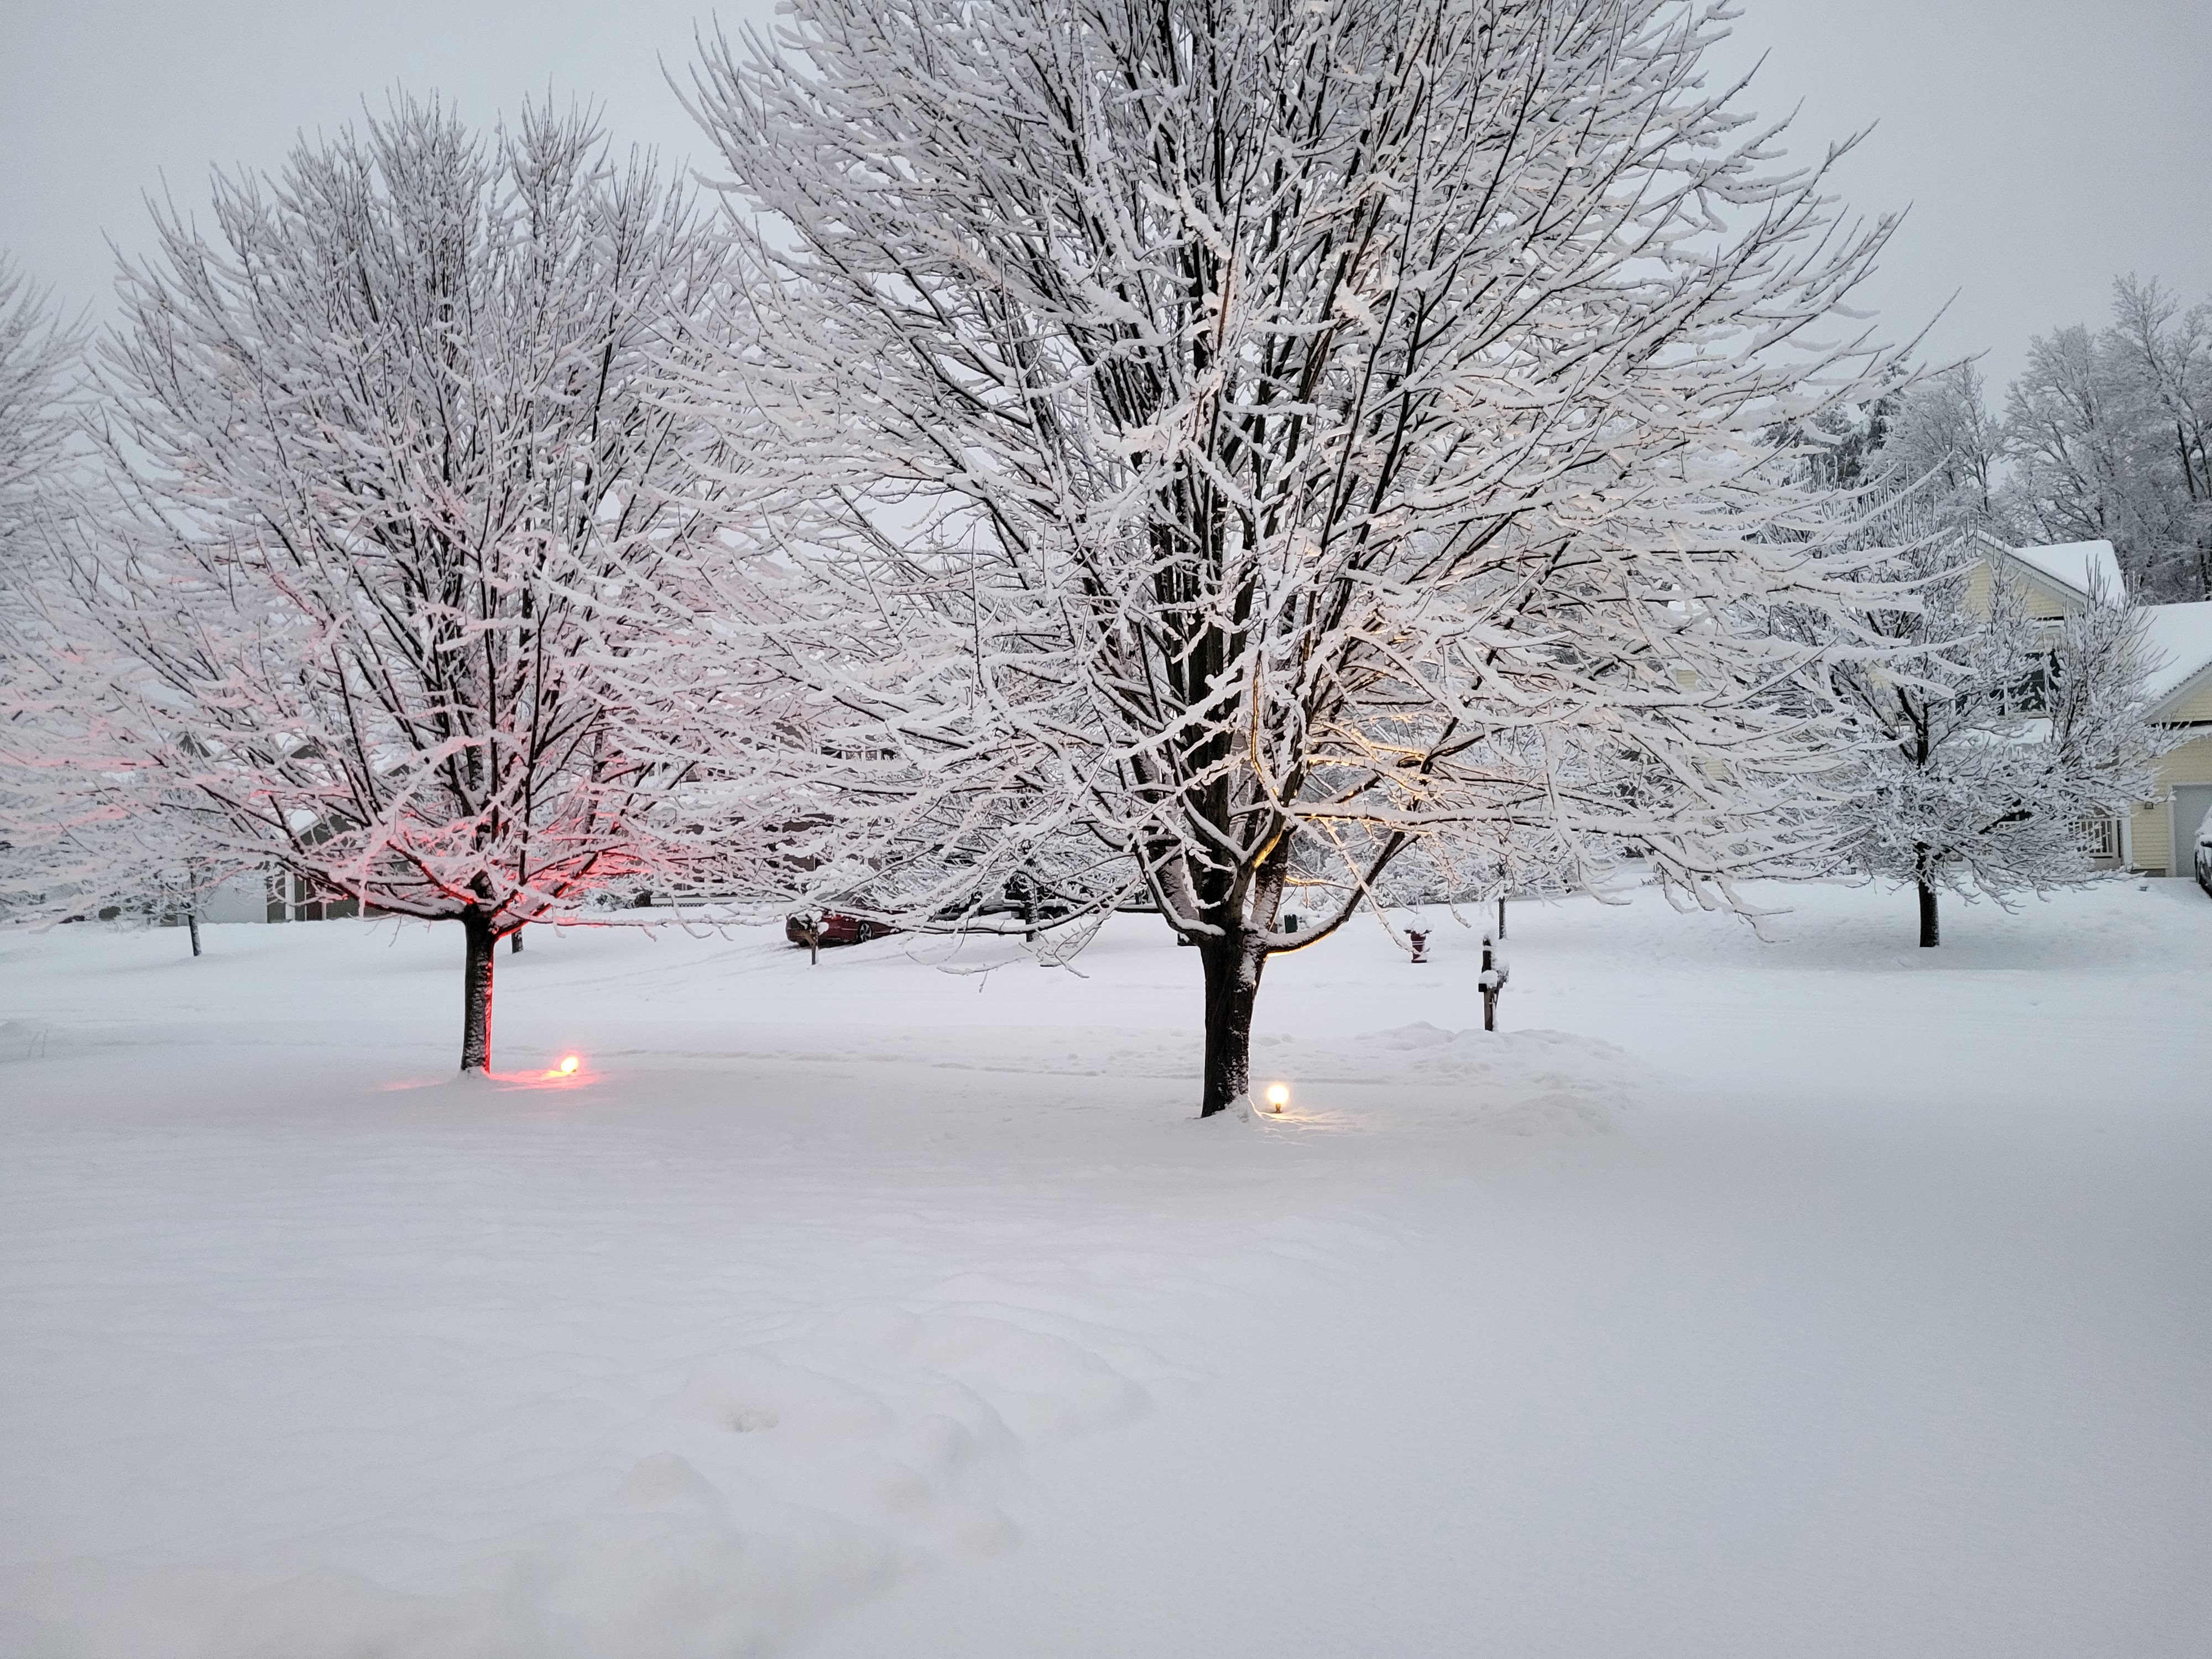
Figure 14: A snowy street view on December 17th[click to enlarge]

