 Email the authors
Introduction:
A heavy wet snowfall impacted portions of northern New York and central and northern Vermont on 11 December 2023. A very warm and moist air mass developed ahead of an approaching cold front, which saw Burlington reach 54 degrees on Sunday, December 11th. These very warm temperatures prior to the event, combined with changing thermal profiles during the event, presented forecasters with many challenges with regards to snowfall. A very sharp elevation dependent gradient from just a few inches of very wet snow occurred in the Saint Lawrence, Champlain, and Lower Connecticut Valleys, as temperatures hovered near freezing. Given warm temperature profiles snowfall ratios were in the 6-8 to 1 range, meaning 1 inch of liquid produced roughly 6 to 8 inches of snow. Meanwhile, the Adirondacks and portions of the central and northern Green Mountains experienced 8 to 14 inches of snow, with some localized higher amounts and snow ratios in the 10-12 to 1 range. Figure 1 below shows the snowfall distribution associated with this challenging event across our forecast area.
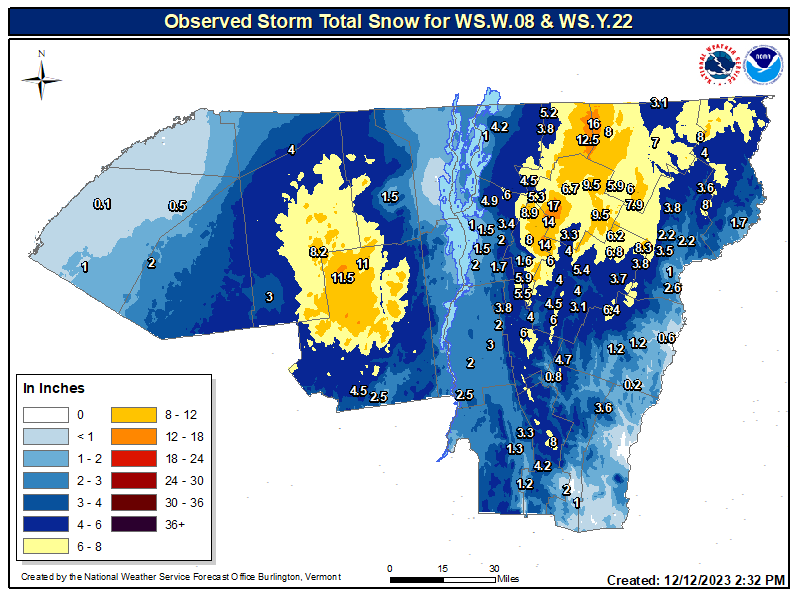
Figure 1: Observed storm total snowfall through 7 AM on 12 December 2023.[click to enlarge]
Upper Air and Surface Features:
In this section we are going to review the strong upper level dynamics associated with this event. The 250mb analysis indicated a potent upper level jet was lifting from the central Appalachian Mountains into southern Canada, with winds of 150 to 180 knots. The right rear quadrant of this full latitude jet configuration promoted strong synoptic scale ascent, which helped to enhance elongated surface low pressure from eastern North Carolina to Cape Cod on the evening of December 10th. In addition, the south to north jet structure supported deep moisture advection from the Gulf of America into the Northeast United States. This was evident from the Albany, NY upper air sounding that showed a precipitable water value of 1.06 inches on the evening of December 10th, which was above the 90th percentile and near the daily maximum for the date. Figure 2 below shows the 250mb analysis on the evening of 10 December 2023.
Figure 2: The 250mb analysis valid at 7pm EST, 10 December 2023. Isotachs are shaded in 25 knot increments above 75 knots. (From NOAA/Storm Prediction Center)[click to enlarge]
Figure 3 below is the 500mb upper air analysis at 7 PM EST on 10 December 2023, clearly showing a complex deep full latitude trough. This trough featured a potent piece of short wave energy located over southern Alabama, which was responsible for the severe outbreak across Tennessee and parts of the southern Appalachian Mountains. Meanwhile, northern stream energy was located within the mid/upper level trough axis over the central Great Lakes and responsible for providing cooler temperatures into our region. However, the phasing of these two pieces of energy occurred slightly later due to the fast progressive flow aloft, resulting in surface low pressure deepening further north in latitude and keeping the heavier precipitation to our east. The heavier precipitation rates and northern stream trough (cold pool aloft) interaction were needed for producing heavy snowfall in the valley locations during this event, but occurred too late.
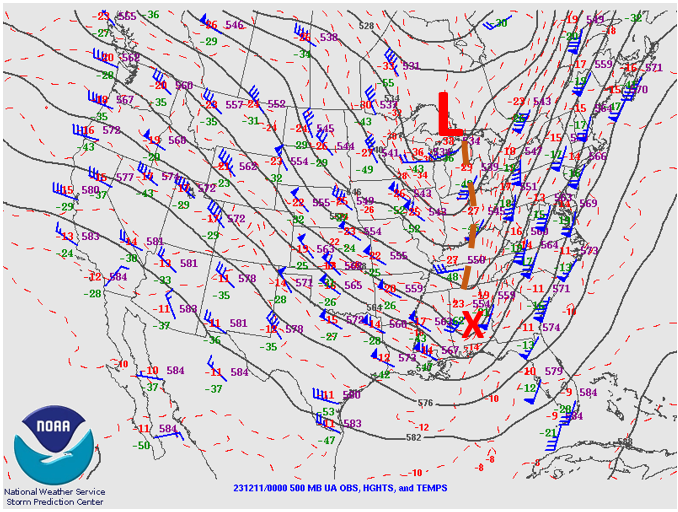
Figure 3: The 500mb upper air analysis on 10 December at 7 PM EST, with wind barbs, (plotted in blue, 1 pennant=50 knots, 1 barb=10 knots, 1/2 barb=5 knots), heights (black lines), and temperatures (dotted red). (From NOAA/Storm Prediction Center)[click to enlarge]
Radar and Satellite:
The brighter red and yellow colors in the GOES 16 infrared satellite imagery below (figure 4) highlights the colder/higher clouds tops associated with areas of heavy precipitation, which was mostly located off the southern New England and Mid-Atlantic Coast. In addition, a backside baroclinic leaf was present associated with the strong ascent from the 250mb jet and resulted in a period of accumulating snowfall on Monday morning across much of our region. The fast movement of the clouds suggested a very progressive flow aloft and prevented surface low pressure from developing in time to produce a widespread heavy snowfall across portions of our valley locations, including the Champlain Valley.
Figure 4: GOES-16 band 13 (clean longwave infrared window) valid from 316 AM to 751 AM EST on 11 December 2023.[click to enlarge]
The Multiple Radar Multiple Sensor (MRMS) winter precipitation mosaic from 150 AM to 750 AM on 11 December shown below (figure 5) indicates mostly rain falling in the evening hours, but as cooler air slowly filtered into the region, snow began to fall, especially above 2000 feet across the Adirondacks and northern Green Mountains. The transition to snow slowly occurred in the parts of the Champlain Valley and lower terrain of central/northern VT during the early morning hours on the 11th. The winter mosaic struggled with identifying the correct precipitation, especially in the valleys, where the radar thought rain was falling. At the Patrick Leahy Burlington International Airport we switched to snow between midnight and 1 AM, with light snow falling most through most of the morning hours. We hovered near 32-33F and with precipitation rates only 0.03 to 0.05 per hour due to the lack of strong frontogenesis and weaker surface low pressure, snow had difficulties accumulating. In addition, the warm Lake Champlain waters, above freezing ground temperatures, and high compaction rate produced only light accumulations of snow in the Champlain Valley through 8 AM on the 11th. Also, note the brighter yellow and red reflectivity returns were most located over southern New England, indicating the heavier precipitation rates associated with surface low pressure were mostly missing our region.
Figure 5: Multiple Radar Multiple Sensor (MRMS) winter precipitation mosaic from 150 AM EST to 750 AM on 11 December 2023. (From NOAA/Global Systems Laboratory)[click to enlarge]
Figure 6 below shows the MRMS winter precipitation mosaic from 750 AM to 150 PM on 11 December. Once again the MRMS winter precipitation mosaic struggled in the valleys with the depiction of light rain, while most of the morning the Champlain Valley experienced light snow. The light precipitation rates were not enough to overcome the marginal temperatures to produce accumulating snowfall across most of the St Lawrence and Champlain Valley. The radar loop clearly shows the aerial coverage and intensity of the precipitation decreasing, especially in the afternoon as surface low pressure was racing across the Gulf of Maine and deepened too far east, to advect deeper moisture back into our forecast area. By early afternoon the heaviest precipitation was mostly confined to the northern Green Mountains, while a light mixture of rain and snow was observed in many valley locations as temperatures slowly climbed into the 30s.
Figure 6: Multiple Radar Multiple Sensor (MRMS) winter precipitation mosaic from 750 AM EST to 150 PM on 11 December 2023. (From NOAA/Global Systems Laboratory)[click to enlarge]
Modeling Data:
It's always interesting to compare progged model forecasts two days (42 hours) prior to the event with actual observed surface and radar observations. Figure 7 below shows the NAM 3KM (left) and GFS (middle) mean sea level pressure (black lines), 1000 to 500mb thickness (red/blue dotted lines), and progged precipitation type (image) for 1 PM on December 11th (42 hour forecast), initialized on 09 December at 7 PM, with actual observed surface and radar (right) at 1 PM on 11 December 2023. Both models indicated strong sub-985 mb low pressure near Portland, Maine with bands of moderate to heavy snowfall anticipated over central and eastern Vermont on Monday afternoon. However, observed surface analysis showed a much weaker 992mb low pressure over far eastern Maine, with the heaviest axis of precipitation exiting eastern VT and mostly located across eastern Canada at 1 PM on 11 December 2023. The timing of low pressure deepening to our north and east, along with the fast track, resulted in lower precipitation rates and slightly warmer temperatures, especially in the valleys, along with less snowfall.
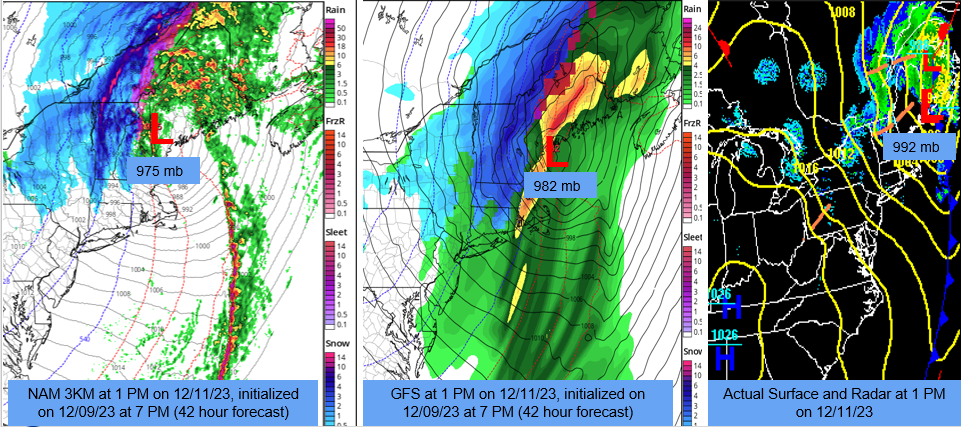
Figure 7: NAM 3KM (left) and GFS (middle) mean sea level pressure (black lines), 1000 to 500mb thickness (red/blue dotted lines), and progged precipitation type (image) a 42 hour forecast for 1 PM on December 11th, initialized on 09 December at 7 PM, with actual observed surface and radar (right) at 1 PM on 11 December 2023.[click to enlarge]
The NAM 3KM 2-meter air temperatures highlighted the very warm temperatures ahead of this system, with values in the mid 40s to lower 50s on Sunday afternoon. However, as a cold front moved across the region temperatures were progged to slowly fall, with values dropping below freezing by very early Monday morning across the higher terrain. However, temperatures hovered near freezing throughout the day and only started to drop below 32 degrees after the precipitation ended. These warm temperatures prevented higher snowfall accumulation, especially the deeper valley locations. Figure 8 below is the NAM-3KM 2-meter temperature (image) initialized on 09 December 2023 at 7 AM EST valid from 7 AM Sunday December 10 to 7 PM on December 11th.
Figure 8: NAM-3KM 2-meter temperature (image) initialized on 09 December 2023 at 7 AM EST valid from 7 AM Sunday December 10th to 7 PM on December 11th. Image courtesy of Tropical Tidbits.[click to enlarge]
The next image is the NAM-3KM instantaneous precipitation rate (blue=snow/green=rain), mean sea level pressure (black lines), and 1000-500mb thickness (red/blue lines), initialized on 09 December 2023 at 7 AM EST valid from 7 AM Sunday December 10th to 7 PM on December 11th. As surface low pressure tracked from eastern North Carolina into southern New England, rapid intensification was progged by the NAM solution, resulting in heavier banded snowfall from the eastern Adirondacks into most of central and northern Vermont. Hourly snowfall rates of 1 to 2 inches per hour were anticipated with this solution, along with very low surface visibilities. Typically a surface low pressure tracking near Boston, Massachusetts is very favorable for producing heavy snowfall across our region, especially if temperatures are cold enough. However, a much weaker and faster system verified, preventing most of our valleys from receiving heavy snowfall during this event.
Figure 9: NAM-3KM instantaneous precipitation rate (blue=snow/green=rain), mean sea level pressure (black lines), and 1000-500mb thickness (red/blue lines), initialized on 09 December 2023 at 7 AM EST valid from 7 AM Sunday December 10 to 7 PM on December 11th. Image courtesy of Tropical Tidbits.[click to enlarge]
Messaging and Associated Graphics:
This event provided several messaging challenges due to fluctuations in how low pressure would track across the region. Initially, the most likely hazardous weather was going to be flooding, but over time, the forecast transitioned to heavy, wet snow due to an eastward shift in where the low would track and how intense it might be. Then, the next challenge became about how to ramp down wording as it became apparent low pressure would likely track too far east or intensify enough so as to produce the snowfall rates needed to overcome above freezing surface temperatures in the lower elevations. Figure 10 below depicts a simple timeline of how the forecast message evolved.
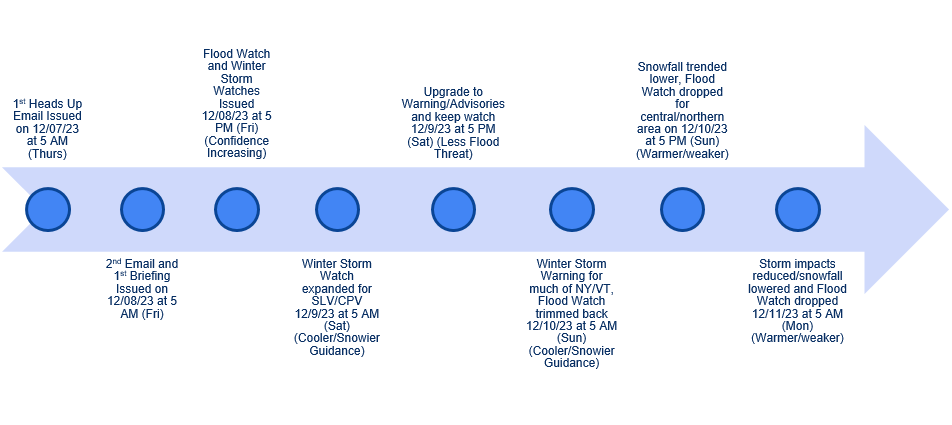
Figure 10: Timeline of products and services provided by Weather Forecast Office (WFO) Burlington, Vermont prior to the event.[click to enlarge]
A text only heads-up email was first provided on 7 December, roughly four days ahead of the event, highlighting the potential for flooding, strong wind gusts up to 40 mph, and wet snow possible within the system. The first briefing package issued on 8 December took the proactive step of issuing a multi-slide briefing as opposed to a one pager with a single image for our decision makers. For some context, the National Weather Service is committed to becoming more proficient with applying probabilistic messaging, and early communications from our office relied on probabilistic graphics and messaging due to the range of potential impacts associated with this weather event. Figure 11 shows one such example, but not shown were probabilities of exceeding 4” of snow, showing the region with the greatest potential for flooding by annotating a map of the region, and ensemble river forecasts.
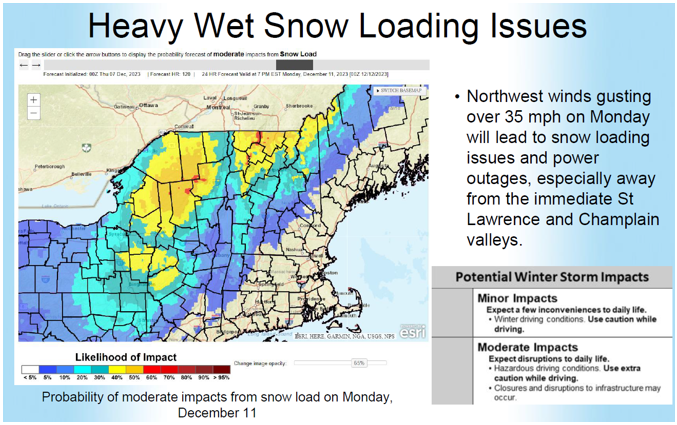
Figure 11: An example of probabilistic weather hazard graphics used in a heads-up email to our partners on 8 December, 2023 at 5 AM EST. The likelihood of moderate impacts (disruptive to daily life) for snow loading on powerlines was shown with forecast wind gusts to communicate the potential for power outages.[click to enlarge]
The use of probabilistic graphics did not end there. Even as the forecast shifted away from messaging flooding, probabilistic messaging was still applied. Partly, this was due to model snowfall outputs increasing while also maintaining a high degree of spread (as much as 6-12” range between reasonable best and worst case scenarios). The use of 10th and 90th percentile forecasts provided the range of possibilities at a glance (Figure 12). Sometimes, these types of graphics are interpreted as an indication that the meteorologists are hedging their bets, but these are intended to be useful tools to communicate risk. When the range of possibilities are as wide as this event, we want to be able to provide as much information as possible to decision makers and to be transparent about the potential that the forecast does not go according to plan.
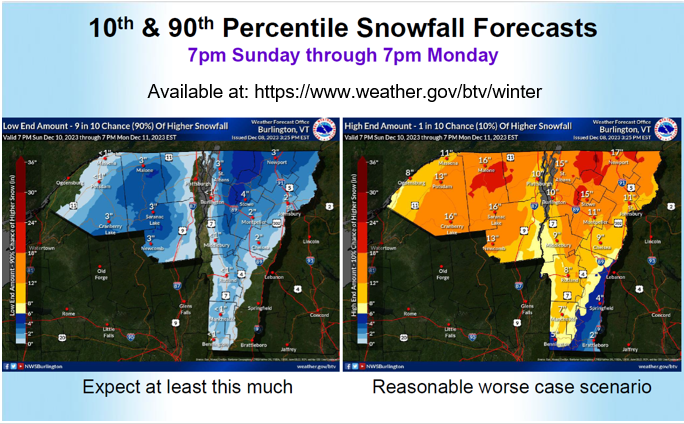
Figure 12: Example of probabilistic graphics used in a heads-up email to our partners on 8 December, 2023 at 4 PM EST. These show the 10th percentile snowfall forecast representing a reasonable lowest possible accumulation (left) and the 90th percentile snowfall forecast representing a reasonable highest possible accumulation (right). When the 10th and 90th percentile are close, this indicates less spread in possible outcomes, but a large range between the 10th and 90th percentile indicates many possible outcomes.[click to enlarge]
Another factor to messaging was the timing on Monday morning. As we push ourselves to provide advanced notice on potentially impactful events lying on the other end of a holiday or a weekend, we rely on probabilistic messaging to make early decisions on headlines. By written definition, a Winter Storm Watch is intended to convey 50 percent confidence in meeting or exceeding snowfall thresholds (7” for an event in Vermont and northern New York), and a Winter Storm Warning is intended to convey 80 percent confidence. Forecaster discretion is applied depending on the potential impacts that a system may cause. For this event, there was greater confidence in heavy, wet snow across Vermont than there was across northern New York. So 30 hours prior to the event, the Winter Storm Watch was upgraded over much of Vermont, but was maintained across northern New York for another forecast cycle (Figure 13) to demonstrate forecaster confidence in where the greatest impacts were most likely to be. This is not the first time we have done this, with concurrent Winter Storm Watches and Warnings also used with the heavy, wet snow event from 16-17 December, 2022.
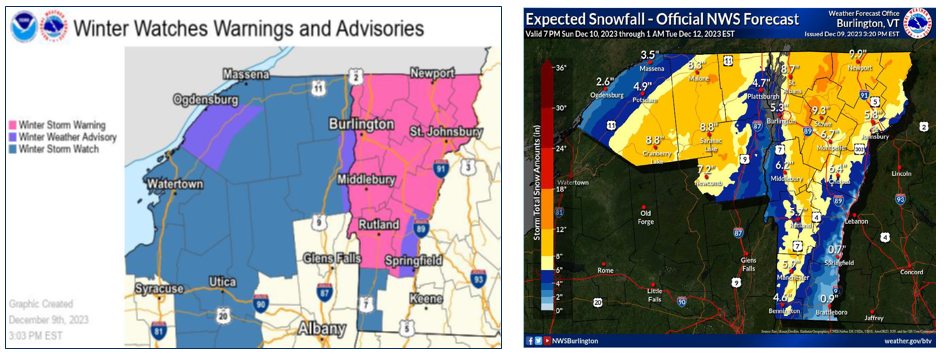
Figure 13: Left) Winter Watches (Blue), Warnings (Pink), and Advisories (Purple) on 9 December 2023 at 3 PM EST. Winter Storm Warnings and Winter Weather Advisories were issued where confidence was highest, while a Winter Storm Watch was maintained where confidence was moderate. Right) The expected snowfall accumulations associated with the winter weather headlines on 9 December 2023 at 3 PM EST.[click to enlarge]
Verification and Impacts:
The National Weather Service Office in Burlington, Vermont takes verification of all our products we issue very seriously, especially winter storm watches and warnings, because we realize the importance of providing outstanding customer service. Figure 14 below shows our observed storm total snow from spotters, COCORAHs, media, public, etc. (upper left), first storm total snowfall forecast (middle) issued on 08 December 2023 at 4 PM, and storm total snowfall first forecast error in inches (lower right). Our initial snowfall forecast had the sharp elevation dependent gradient, but was overdone across portions of northern New York and parts of central and northern Vermont by 2 to 6 inches. This event continued to be challenging with later forecasts increasing snowfall amounts, resulting in large errors, especially across portions of northern New York and the Champlain Valley, where snow amounts were lighter due to warmer temperatures, less precipitation and compaction. Our goal for all winter storms is to have as little snowfall error as possible, even during marginal temperature events with sharp gradients. We will take this opportunity to learn from our snowfall errors, while utilizing new technology to continue to improve our products and services provided to our customers for future success.
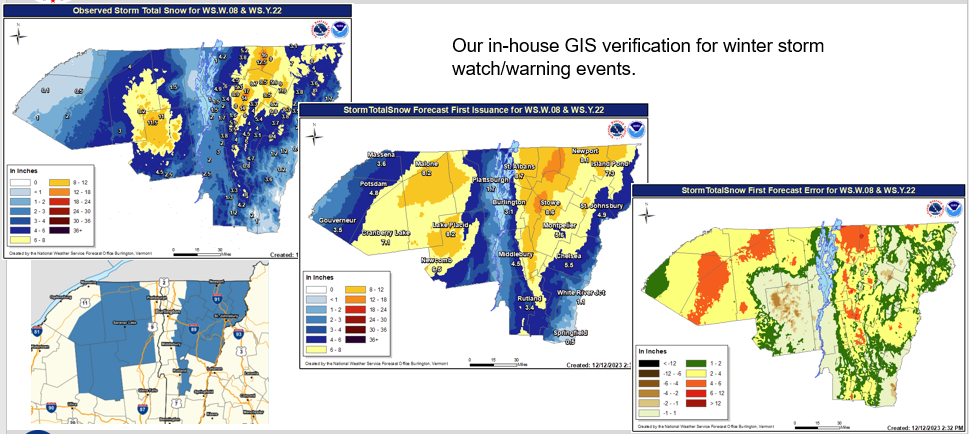
Figure 14: Observed total snow (upper left), first storm total snowfall forecast (middle) issued on 08 December 2023 at 4 PM, storm total snow first forecast error in inches (lower right) and map of winter storm watches (lower left).[click to enlarge]
Conclusion:
This winter storm was very complex and challenging for forecasters at the National Weather Service Office in Burlington, Vermont, especially given the marginal temperature profiles. Many locations in the deeper valleys underperformed in terms of expected snowfall versus observed snowfall, because of warm surface temperatures and high compaction rate. Snow ratios were only in the 6-8 to 1 range, while the mountains saw ratios in the 10-12 to 1 range for this event. Furthermore, the warm lake waters influenced conditions near Lake Champlain, resulting in just an inch or so of slushy snow accumulation. A very sharp and highly elevation dependent snowfall occurred with this event, with amounts ranging from a few inches in the valleys to almost a foot in parts of the Adirondacks and northern Green Mountains of Vermont. This storm did disturb power to over 10,000 customers across northern New York and Vermont, with several spikes in outages seen in Vermont per the chart in the lower right image below.
In addition, both air and vehicle travel was impacted on Monday, with multiple schools closing for the day. One inch per hour snowfall rates were observed, with surface visibilities below 1 mile at times. Given the temperatures hovering near freezing, conditions quickly improved by mid afternoon, especially treated road surfaces. The final image is taken in Milton, VT early Monday morning showing the heavy wet snowfall accumulating to trees and bushes. While this event presented many challenges and our forecasted snowfall amounts fell short in valley locations, forecasters here at Burlington take these events very seriously and will review this event internally for making additional improvements to our products and services for future success to our partners and users across the North Country.
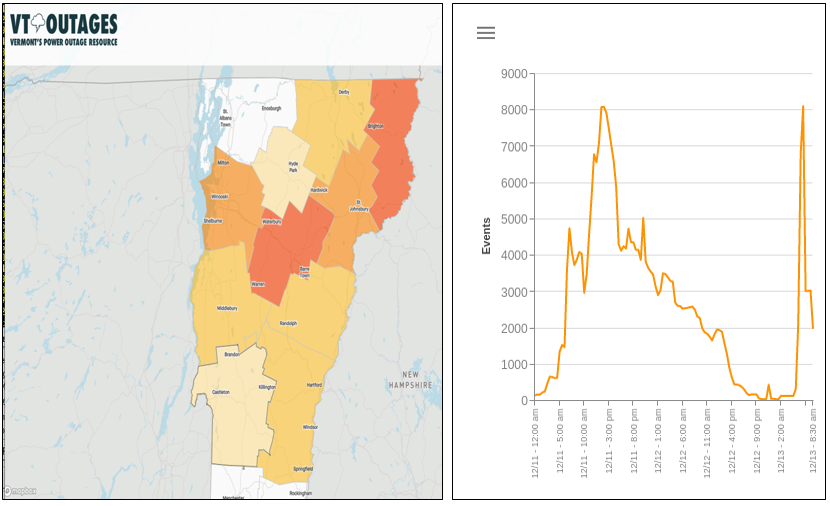
Figure 15: Power outages map early morning of December 11th (left) and graph of power outage events (right) from 12 AM on 11 December to 830 AM on 13 December 2023.[click to enlarge]
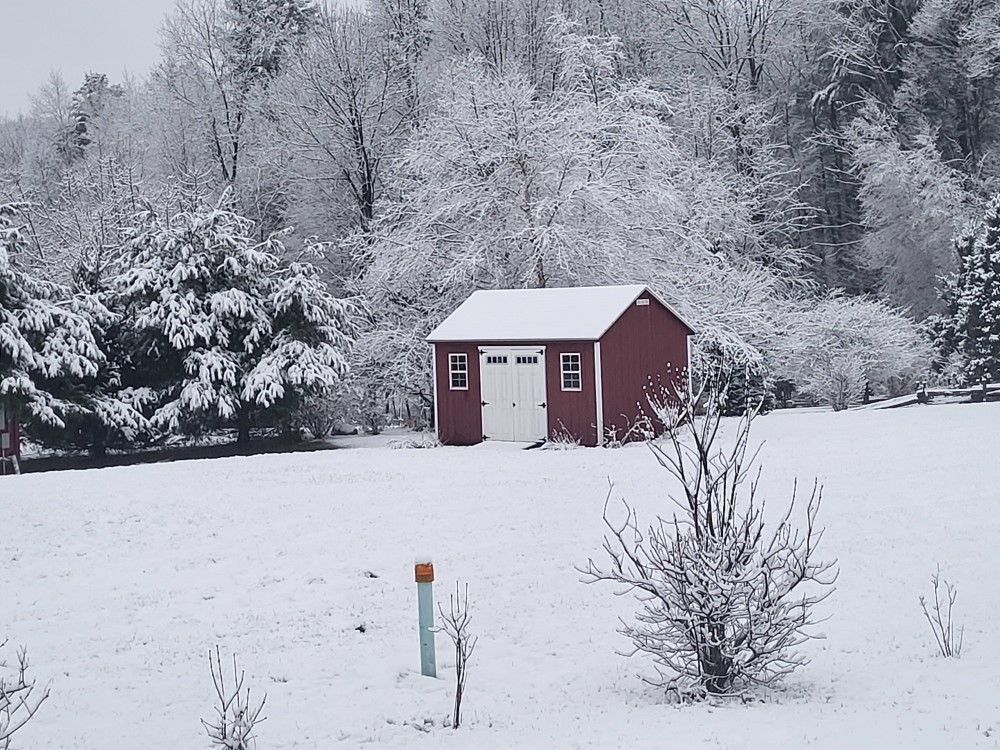
Photo taken by Brooke Taber (NWS Burlington) in Milton, VT at 753 AM on 11 December 2023.[click to enlarge]

