 Email the authors
After an extensive period of dry weather across late September into early October, a very slow moving frontal boundary tracked east across northern New York on October 6th, which did not depart the region until early October 8th. Strong confluence developed ahead of the boundary due to a broad area of high pressure in the Canadian Maritimes and increasing easterly flow ahead of post-Tropical Storm Philippe. An increasingly negatively tilted upper trough and meridional jet stream parallel to the boundary aided in efficient moisture transport while ensuring the boundary was slow to translate east. This front also approached after a period of record breaking warmth, with the Burlington Airport recording 3 daily record max temperatures in a row October 3rd through 5th, with an all-time record for the month of October broken on October 4th of 86 degrees. This record warmth resulted in a sharp thermal gradient that produced strong frontal forcing with precipitable waters near 200 percent of normal around 1.40”. These factors resulted in an extensive period of moderate to locally heavy rain focused along far northeastern New York. Plattsburgh, New York recorded the wettest calendar day in its period of record at 3.94 inches of rain on October 7th. Antecedent dry conditions precluded widespread flood impacts, but portions of northern New York observed some street flooding and minor flooding along the East Branch of the Ausable River. For this analysis, we will explore more of the meteorological factors and context of the event as it relates to the limited impacts experienced.
II. Synoptic Meteorology500 hPa heights (20,000 feet above ground level) indicated an anomalous deep full latitude trough located over the central Great Lakes at 12 UTC on 07 October 2023, which became negatively tilted as several potent shortwaves rounded the trough base and deepened at all levels. The developing negatively tilted mid/upper level trough, enhanced a deep layer conveyor belt of warm moist air into our region on strong southerly flow of 70 to 100 knots (circled in red in Figure 1 below), resulting in areas of moderate to heavy rainfall. When a system is this deep and closed off at all levels of the atmosphere, movement is generally slow and impacts such as heavy rainfall can linger for multiple hours, especially along a slow moving cold front.
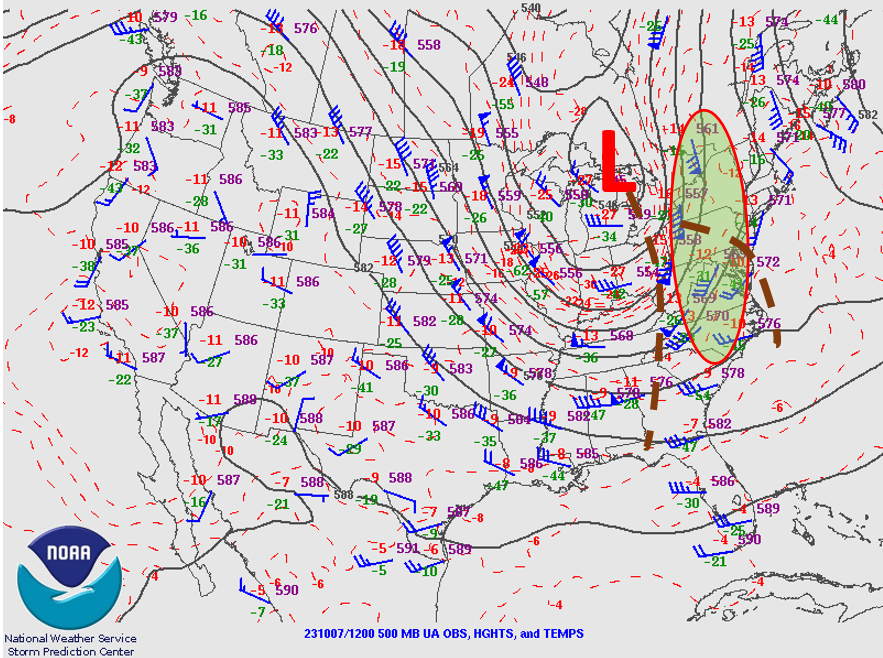
Figure 1: The 500 hPa (20,000 feet above ground level) upper air height analysis on 07 October 2023 at 12 UTC. Wind barbs, (plotted in blue, 1 arrow=50 knots, 1 barb=10 knots, 1/2 barb=5 knots), 500 hPa heights (black lines), and temperatures (dotted red). [click to enlarge]
Another synoptic scale feature that helped to produce moderate to heavy rainfall across our forecast area was a favorable dual structure of the 250 hPa jet. Figure 2 below shows the 250 hPa jet analysis at 12 UTC on 07 October 2023, which indicates a strong right rear quadrant of the polar jet with winds of 90 to 120 knots. Meanwhile, a weaker subtropical jet was racing across the lower Ohio Valley into the central Appalachian Mountains. The combination of these two jets helped strengthen the upper level shortwave trough, while producing very favorable upper level divergence for strong synoptic scale ascent and localized heavy rainfall. These upper dynamics, combined with a slow moving surface cold front and associated low level convergence contributed to the areas of moderate to heavy rainfall footprint.
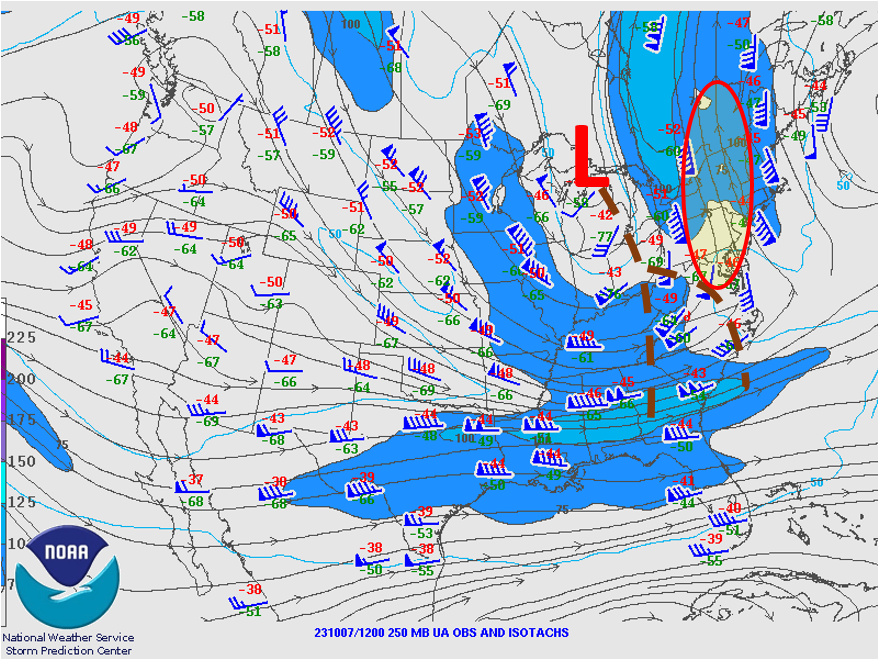
Figure 2: The 250 hPa upper air analysis on 07 October 2023 at 12 UTC. Isotach (dark blue >75 knots and lighter blue >100 knots, streamlines (black), wind barbs, (plotted in blue, 1 pennant=50 knots, 1 barb=10 knots, 1/2 barb=5 knots). [click to enlarge]
The precipitable water (PW) analysis showed a sharp west to east gradient across the Northeast United States per Figure 3 below. Values across our region ranged from around 1.0 inch across the western St. Lawrence Valley to 1.4 inches over the northern Champlain Valley at 17 UTC on 07 October 2023. PW values of 1.4 inches were near 200% of normal for early October and the presence of rich moisture resulted in moderate to heavy rainfall, especially as forcing from ascent increased. Deeper moisture with PW values of 1.8-1.9 inches associated with post tropical cyclone Philippe stayed offshore, but curved back into eastern Canada and portions of eastern Maine. The 850 hPa moisture transport vector analysis showed the strongest moisture advection occurring from central/southern New England into parts of the Champlain Valley at 17 UTC on October 7th. Strong moisture advection along a slow moving cold front is another indication of potential heavy rainfall.
Figure 3: The Storm Prediction Center (SPC) mesoanalysis precipitable water black line (inches) (light green color filled >1.0 inch and darker green color filled >1.50) and 850 hPa moisture transport vector (orangish-brown arrows) on 07 October 2023 at 1700 UTC. The SPC mesoanalysis uses the Rapid Refresh (RAP) model 1-hr forecast in conjunction with surface observations as its basis. [click to enlarge]
In addition to the slow progression of synoptic features, post tropical cyclone Philippe was lifting northwest towards the Maine Coast, steered by a high latitude block. Enhanced easterly flow in the low-levels between Philippe and the deep layer high positioned near Newfoundland enhanced convergence along the boundary. Observing the 1000-925 hPa frontogenesis, almost pure convergence between the accelerating maritime air mass and westerly winds behind the front can be observed across the Champlain Valley, along with a strengthening thermal gradient (Figure 4). Temperatures for much of the week had ranged in the mid 70s to mid 80s across the region, and surface dewpoints had risen into the 60s ahead of the frontal boundary, leaving abundant moisture pre-established across the region (not shown). Record breaking warmth and the enhancement of easterly flow ahead of Philippe also aided in producing significant rainfall.
Figure 4: The Storm Prediction Center (SPC) mesoanalysis of 1000 to 925 hPa mean Pettersen frontogenesis (purple lines), heights (black lines), temperatures (red dotted lines), and winds from 12 UTC to 2100 UTC on 7 October 2023.[click to enlarge]
Weak instability on the order of 100-250 J/kg of most unstable CAPE developed east of the boundary as well (Figure 5). This narrow instability axis persisted along and ahead of the frontal axis. Though not strong, this supported continued upward motion while the front remained over the region. The lack of convective inhibition allowed for sustained updrafts along the slow moving boundary. Convective elements were occasionally observed along the cold front, and likely provided a boost to rainfall rates as well. This instability was rather shallow, though, and was not of a magnitude sufficient enough for more significant rainfall rates.
Figure 5: The Storm Prediction Center (SPC) mesoanalysis of equilibrium temperature in degrees celsius (color filled), Most Unstable Convective Available Potential Energy (MUCAPE) (J/kg lowest 400 hPa) (red lines), and Most Unstable Convective Inhibition (MUCIN) (hatched fill) at 1800 UTC on 7 October 2023. [click to enlarge]
This event received considerable attention due to the potential for heavy rainfall. Due to severe impacts from the Great Vermont Flood of 10-11 July 2023, many were concerned with the potential for renewed flooding. However, unlike the recent historic flood event, precipitable water and instability were lower for this October 7th event. Additionally, central Vermont had observed very heavy rainfall just three days prior to the Great Vermont Flood of July 2023, while this event featured dry weather in the two weeks prior to this event. Different tools for measuring flood potential such as Flash Flood guidance or at what percentage streamflows were compared to normal were less favorable for flooding for this event on 7 October (not shown). The High Resolution Ensemble Forecast (HREF) system depicted a narrow swath of 2 to 4 inches of rain across northern New York into the Champlain Valley, with localized totals between 4 and 5 inches possible (Figure 6). Rainfall rates were not expected to be as high, and this would limit the potential for flash flooding. In comparison with 10-11 July 2023 floods, this was a smaller rainfall footprint and would fall across climatologically less reactive river basins. Eastern Vermont was at lower risk for heavy rainfall comparatively. So from the perspective of either flooding or flash flooding, the environmental factors that contributed to the significant impacts in the Great Vermont Flood of 10-11 July 2023 were not there, but the message of minor river flooding in northern New York or street flooding near clogged storm drains was the primary concern.
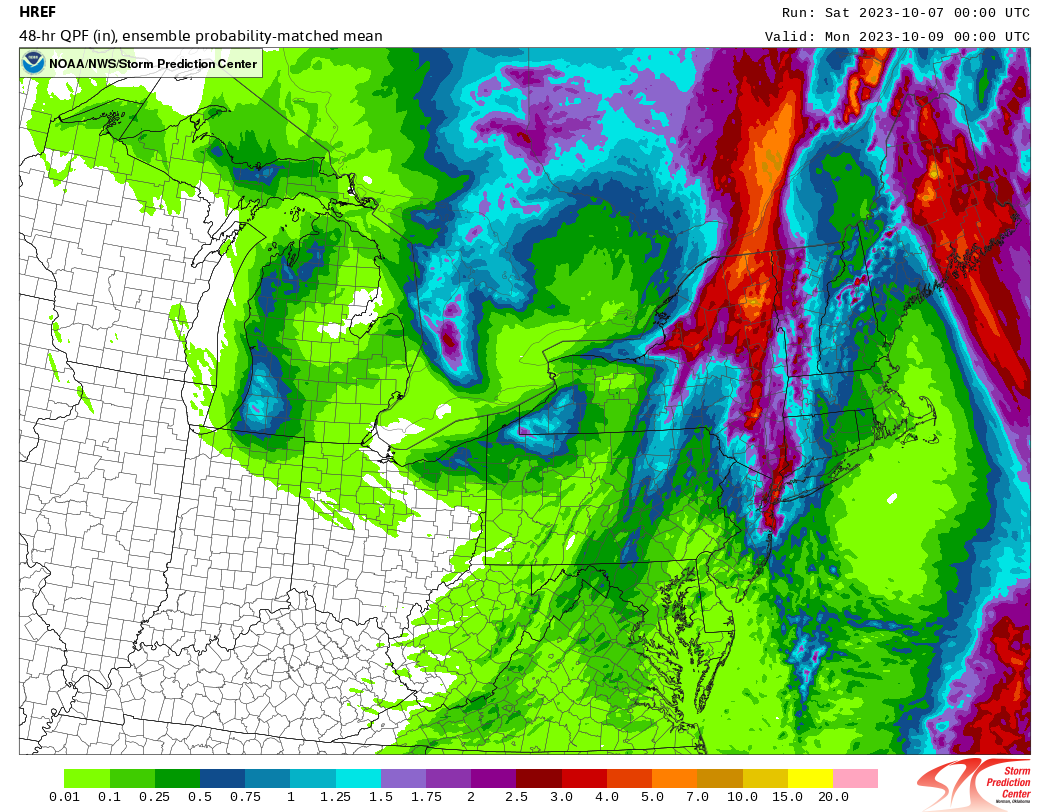
Figure 6: The Storm Prediction Center (SPC) High Resolution Ensemble Forecast (HREF) 48 hour ensemble mean of quantitative precipitation forecast (QPF) (inches) initialized on 07 October 2023 at 00 UTC, valid through 09 October 2023 at 00 UTC. [click to enlarge]
In this section we will briefly describe the radar evolution of the moderate to heavy rainfall across northern New York into parts of western and central Vermont during this storm. The first radar loop below shows localized heavy rainfall moving from south to north across northern New York into the Champlain Valley, while movement eastward is very slow through 1750 UTC on 7 October 2023 (Figure 7). Hourly rainfall rates within the brighter yellow and orange colors in the radar imagery below were in the quarter to half inch range. The lack of deeper instability and warm cloud depths less than 10,000 feet, prevented hourly rainfall rates from exceeding one inch per hour.
Figure 7: Multiple Radar Multiple Sensor (MRMS) from 1150 UTC to 1750 UTC on 7 October 2023. [click to enlarge]
Figure 8 below shows the Multiple Radar Multiple Sensor (MRMS) radar imagery from 1750 UTC to 2350 UTC on 07 October 2023. Localized very heavy rainfall prevailed from the eastern Adirondack Mountains in northern New York into the Champlain Valley and western slopes of Vermont, while very light rain occurred over eastern sections of Vermont. The slow moving cold front paralleling the flow aloft along with enhanced channeling on southerly winds up the Champlain Valley helped to enhance rainfall totals across this region. By early evening, the axis of precipitation started to change orientation from south to north to more of a southeast to northwest direction as the mid/upper level trough became negatively tilted. Storm total rainfall amounts ranged from 0.50 to 1.0 across the western St. Lawrence Valley and parts of the Northeast Kingdom of Vermont, while an axis of 2 to 5 inches occurred from the eastern Adirondacks into the Champlain Valley, including the Western Slopes of the Green Mountains. This heavy rainfall contributed to minor river flooding on the Ausable and a few road closures across Essex County, New York on 7 October 2023.
Figure 8: Multiple Radar Multiple Sensor (MRMS) from 1750 UTC to 2350 UTC on 7 October 2023. [click to enlarge]
Forecasts from the HREF were excellent for the event. Observed rainfall amounts from 7 and 9 October featured an area of 2 to 4 inches of rain between the Adirondacks of New York into the Green Mountains of Vermont. Within that area were a number of locations that reported rainfall amounts up to 5 inches. A few reliable stations reported values in excess of 5 inches, like 5.30” at the Port Henry CWOP, and a mesonet located in Bloomingdale, New York observing 5.55”. A handful of public reports also approached 5 inches in the area . Rainfall amounts gradually decreased outside of this region, with parts of the Northeast Kingdom in Vermont and the St. Lawrence Valley of New York observing less than 1 inch of rain (Figure 9).
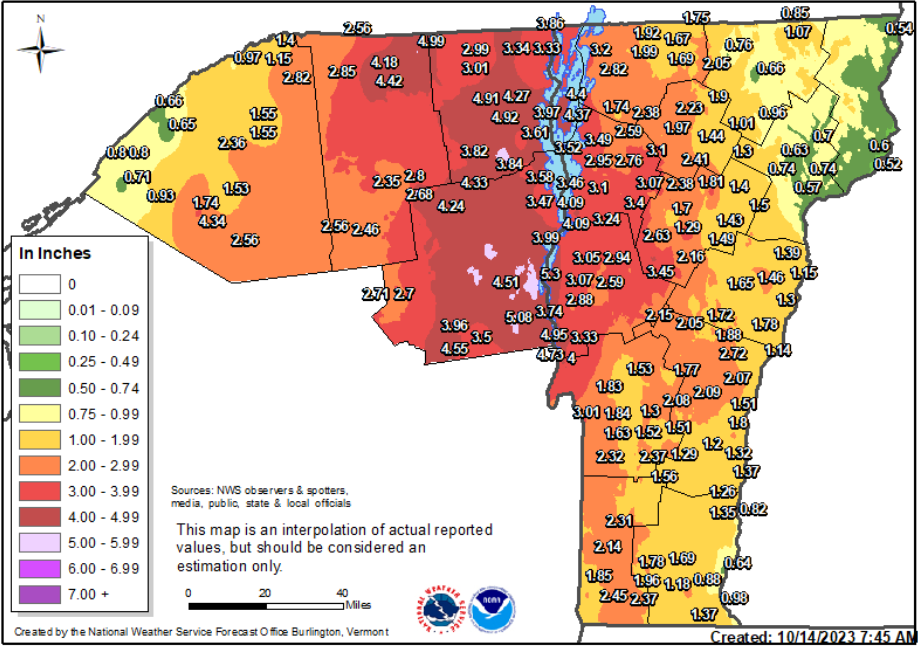
Figure 9: Observed storm total rainfall across the North Country from 7 October to 9 October 2023. [click to enlarge]
Two climate sites within our area of responsibility observed record breaking precipitation totals. At Plattsburgh, New York, a new calendar day precipitation record for its entire period of record (beginning 1945) was observed, with 3.94” recorded on 7 October. Burlington, Vermont observed its 3rd wettest October day, with 2.80” recorded and breaking the daily record for 7 October (since 1884). The period of heaviest rain was observed between late morning and early afternoon in the region, followed by steady light to moderate rain during the evening. Figure 10 below depicts the hourly precipitation rates observed at Plattsburgh, New York, which was 0.75” in one hour at the heaviest.
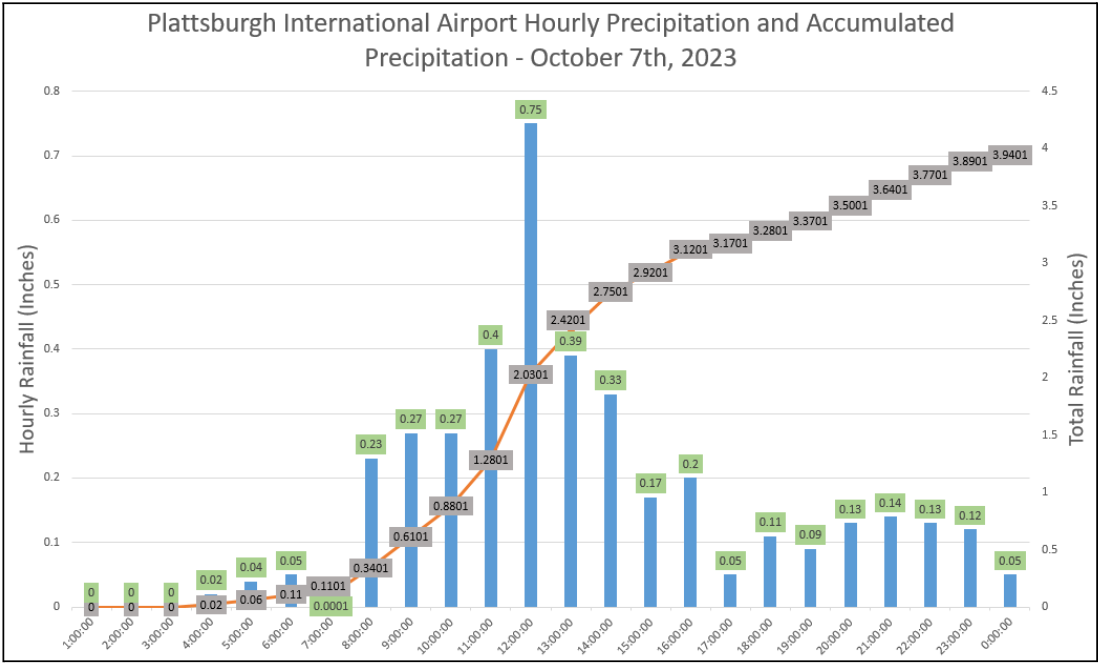
Figure 10: Plattsburgh International Airport hourly precipitation (blue bar graph) and accumulated precipitation (red line) on 7 October 2023 accessed via Iowa Environmental Mesonet. Values of a trace are shown as 0.0001. [click to enlarge]
Figure 11 below shows the hydrograph on the East Branch of the Ausable River at Ausable Forks (ASFN6) from 12 UTC on 7 October 2023 to 12 UTC on 12 October 2023. The East Branch of the Ausable River tends to be fast to respond to heavy rainfall. Note the sharp rise of over 7.5 feet from early evening on the 7th into the early morning hours of October 8th, as a result of the heavy rainfall that occurred over the river basin. The river gage reported minor flood stage (7.0 ft) just before 20 UTC (4 PM EDT). The ASFN6 gauge crested at 8.85 feet at 06 UTC (2 AM EDT on October 8th), which was just below moderate flood stage (9.0 feet). When the gauge reaches 8.0 feet, which is well in minor flood stage, water can approach Route 9N in the town of Jay near Trumbulls Corner, minor flooding can occur in Keene, and water begins to overflow onto Hulls Falls Road, Route 73, and Route 9N near Marcy Field. Flood waters gradually receded below flood stage shortly after 1330 UTC (9:30 AM EDT) on October 8th.
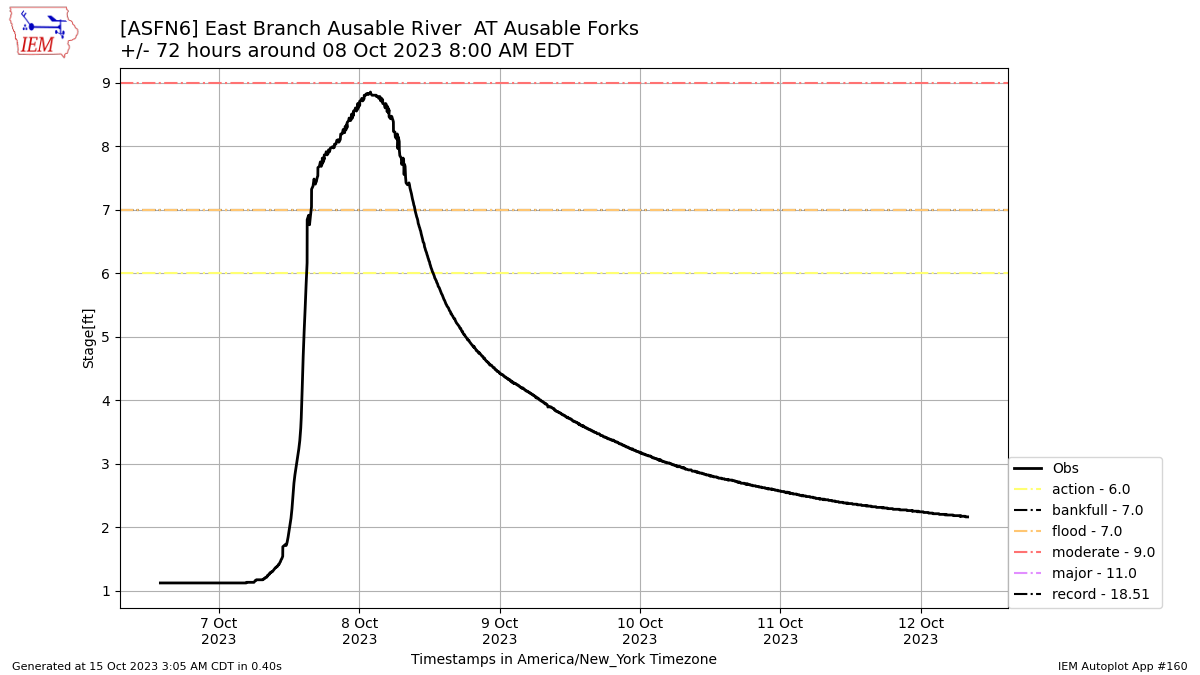
Figure 11: Hydrograph on the East Branch of the Ausable River at Ausable Forks in Essex County, New York between 7-12 October 2023. [click to enlarge]
In addition to river flooding on the East Branch of the Ausable River, street flooding was reported in Essex County, New York during the evening hours of October 7th. In the region of heaviest rain, 4 towns reported road closures due to water on roadways. Hoffman Road near Schroon Lake was reported closed due to flooding. Multiple road closures were reported near Ticonderoga, including Old Chilson Road. Near the town of Moriah, a road shoulder was washed out due to flood waters. Near Westport, Route 22 was briefly closed due to flooding, as well (Figure 12). These reports of street flooding were closely collocated with localized rainfall totals near or above 5 inches. Heavy rainfall fell directly over Lake Champlain. After several weeks of dry weather, the water level on Lake Champlain was steadily decreasing, though remaining above normal due to the rainfall observed in July. Prior to the rainfall on October 7th, the Lake Champlain level dropped to 96.11 ft, and then steadily reached a relative peak at 96.95 ft after the event was over (Figure 13).
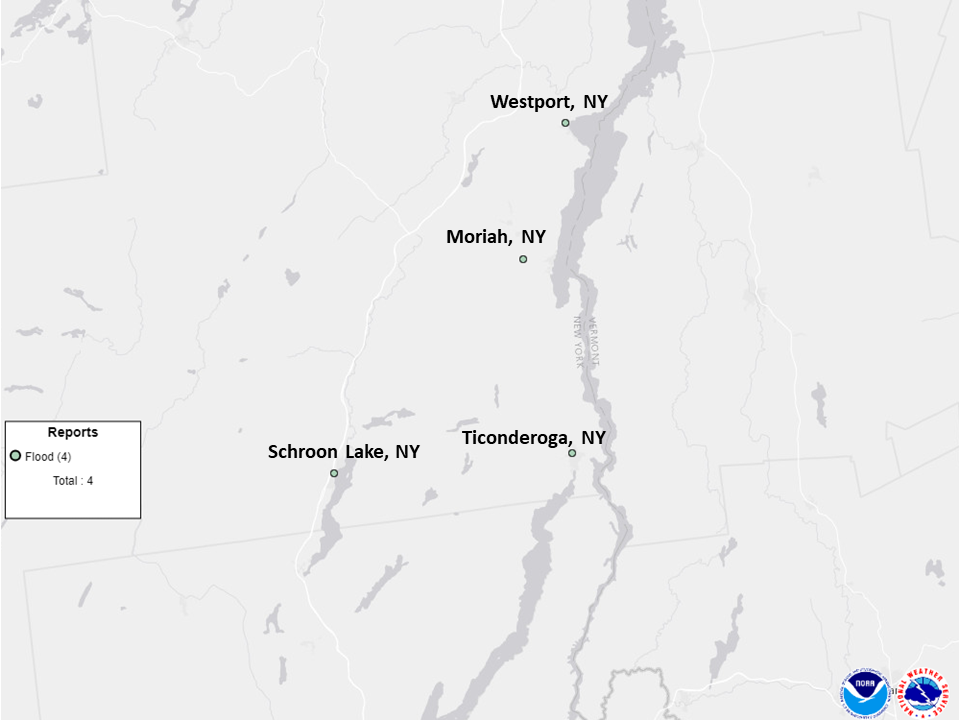
Figure 12: A map showing the location of 4 flood reports across Essex County, New York on 7 October 2023. [click to enlarge]
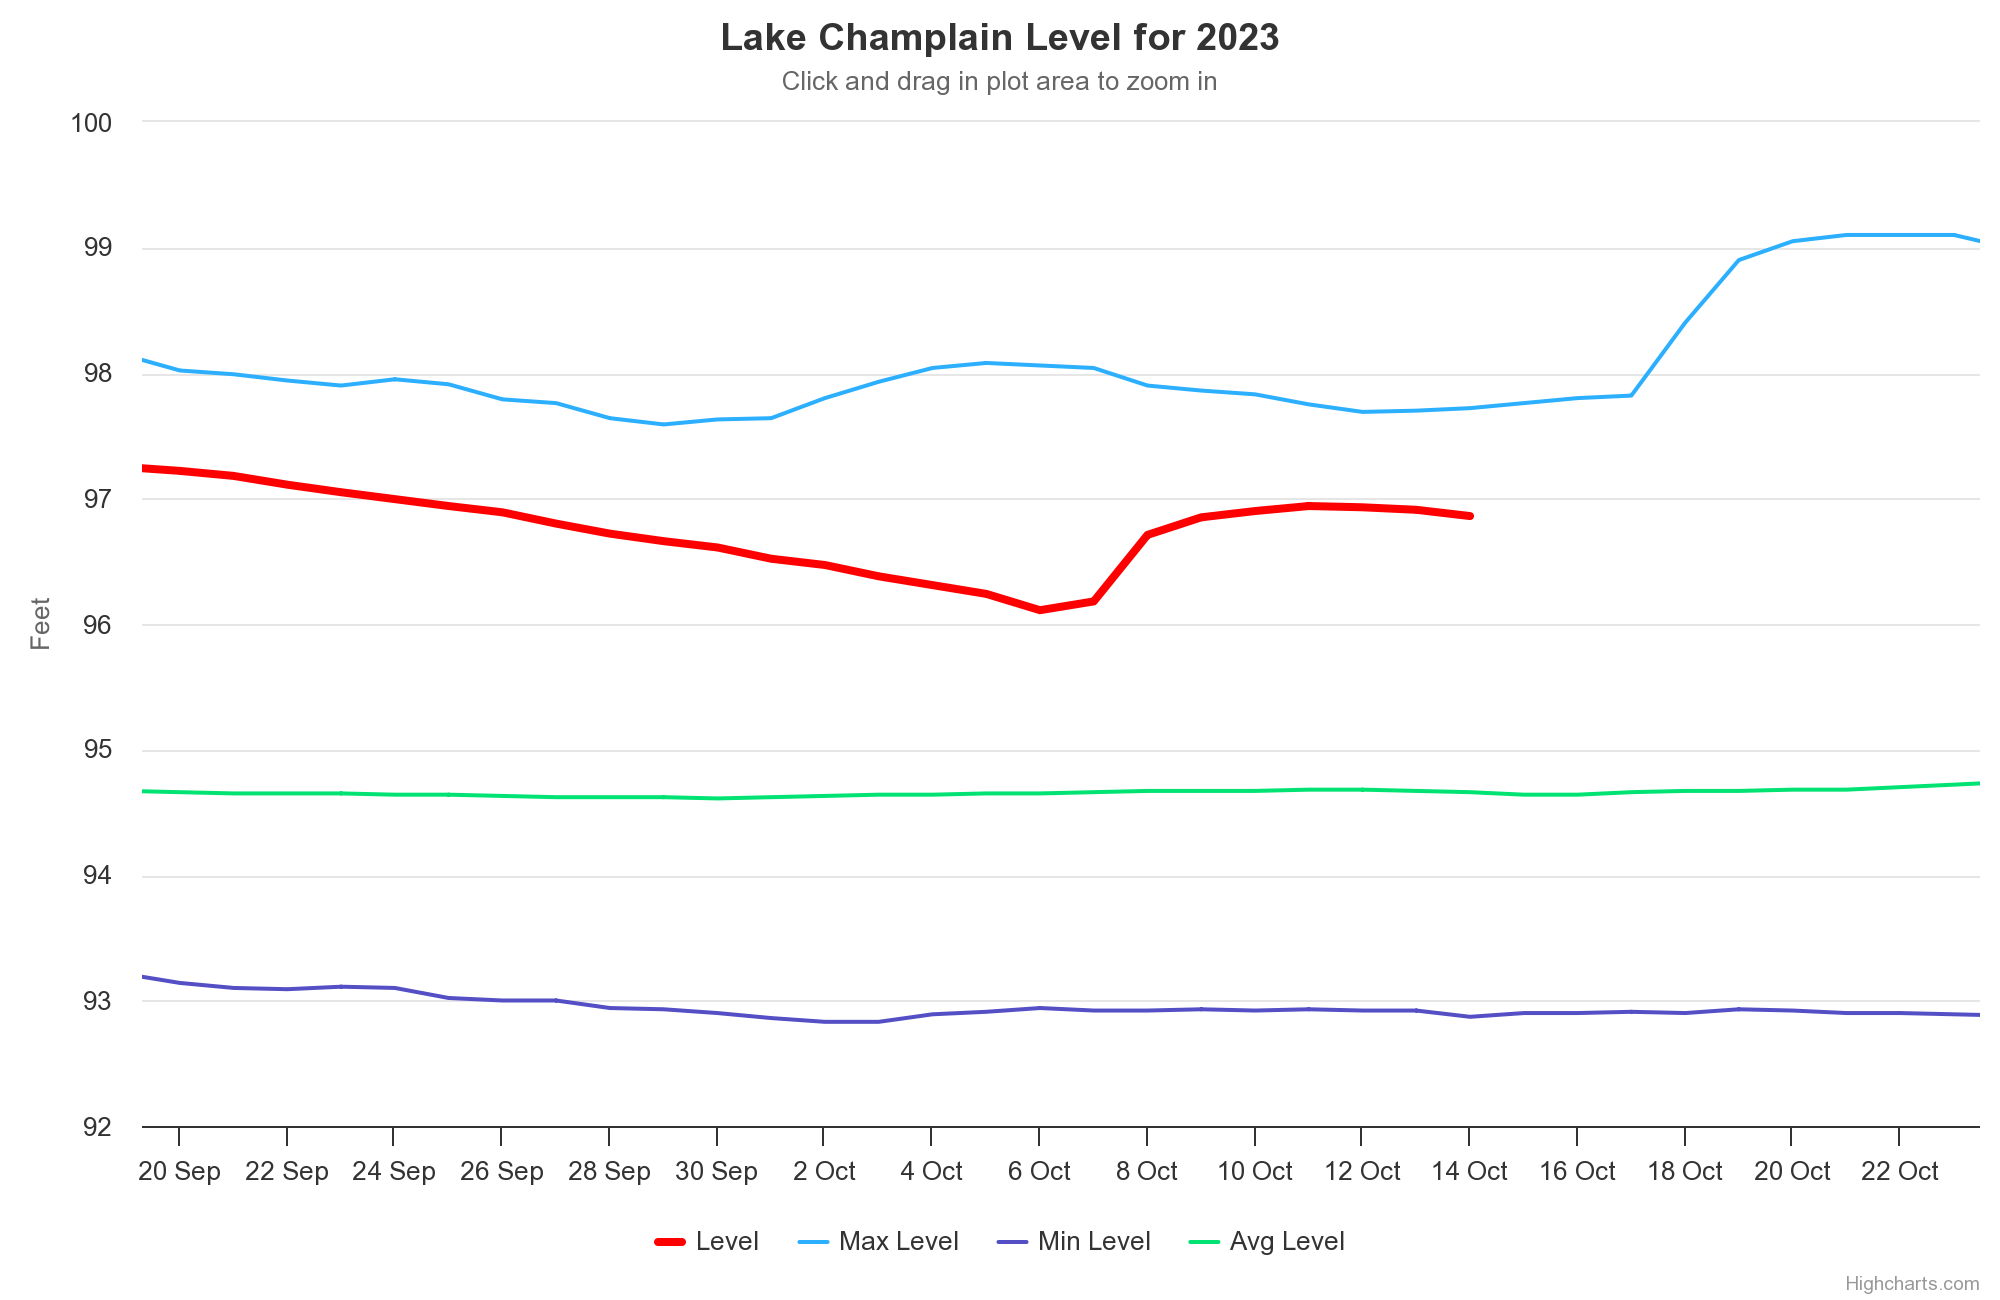
Figure 13: Hydrograph of current Lake Champlain lake level (red line), maximum level (light blue line), average level (green line), and minimum level (purple line) from 20 September to 22 October. [click to enlarge]
A slow-moving, dynamic cold front brought a broad area of 2 to 4 inches of rain across Vermont and northern New York, locally up to 5 inches in parts of Northeastern New York from 6 to 8 October. The rainfall amount was record breaking in parts of the Champlain Valley, but the duration of the time over which the rain fell was long enough to preclude flash flooding. This event highlights the importance of context. Despite the record breaking rainfall, dry antecedent conditions and the location of heaviest rain falling across less reactive basins precluded significant, widespread flooding. However, a number of street flood reports occurred across Essex County, New York and the East Branch of the Ausable River nearly reached moderate flood stage. Overall, this will likely be remembered for reinforcing New England’s poor luck with dry weather during a weekend in 2023.

